Decision-making and the Iowa Gambling Task

1. Participant recruitment
- Patient recruitment
- Recruit 10 patients with damage to the ventromedial sector of the prefrontal cortices.
- Damage to this region is confirmed by neuroimaging with MRI. The ventromedial prefrontal cortex is located at the most anterior medial wall of the cerebral cortex, on the ventral surface. Damage can be unilateral or bilateral, but should not extend beyond the ventromedial prefrontal cortex. An example of the brain of such a patient is shown in Figure 1.
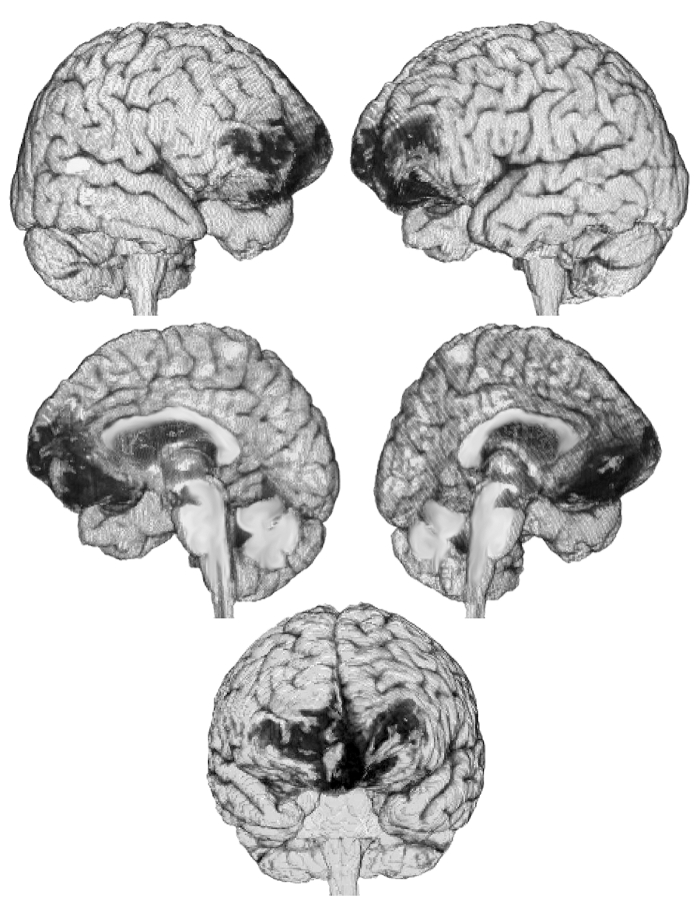
Figure 1: Computer reconstruction of the brain of a patient with VMPFC damage. This patient has bilateral damage to the medial prefrontal cortex, as shown in this 3D reconstruction made from MRI images. Images courtesy of Hanna Damasio.
- Control recruitment
- Recruit 20 participants without brain damage, who are matched in age and intellect with the patient population.
- Make sure that the participants have been fully informed of the research procedures and have signed all the appropriate consent forms.
2. Data collection
- In order to examine decision-making deficits in patients with ventromedial prefrontal cortex damage, patients and control participants will perform the Iowa Gambling Task.1
- Seat the participant at a table in front of four decks of identical-looking cards.
- Give the participant $2000 in play money.
- Provide instructions to the participant about how the experiment will unfold.
- Tell the participant that the game requires a series of card selections, turning over one card at a time from any of the four piles of cards.
- Tell the participant that the goal of the task is to maximize profit on the loan money.
- Tell the participant that after turning each card, they will receive a certain amount of money (predetermined for each card turn from each deck).
- Tell the participant they are free to switch from any deck to another, at any time, as often as they want.
- There is no time limit for the participant to choose a deck.
- Begin the task.
- After turning some cards, the participant is given money but also has to pay a penalty. The amount of the penalty is announced after the card is turned, and is predetermined for each card turn from each deck (known only to the experimenter; Figure 2). Give the participant the amount of play money that they earn, and tell them to hand the experimenter any money they have lost, before proceeding to the next turn.
- Turning a card from deck A or B yields $100, turning a card from deck C or D yields $50. Penalty amounts are higher in decks A and B than in decks C and D.
- Decks A and B are equivalent in terms of overall net loss over trials, but in deck A the punishment is more frequent and of lower magnitude than in deck B.
- Decks C and D are equivalent in terms of overall net gain, but in deck C the punishment is more frequent and of lower magnitude than in deck D.
- Use the preprogrammed schedule of reward and punishment on the score card (Figure 2).
- For example, if the participant first chooses a card from Deck A, they get a $100 reward and no punishment.
- If the second card choice is also from Deck A, they get a $100 reward and no punishment.
- If the third card choice is also from Deck A, they get a $100 reward and a $150 punishment.
- Keep track of the card turns by marking each of the 100 turns in the appropriate cell in Figure 2.
- The participant makes 100 card turns, choosing a card from any deck each time. Since there are only 40 cards in each deck, they might run out of cards in a given deck before the end of the experiment.
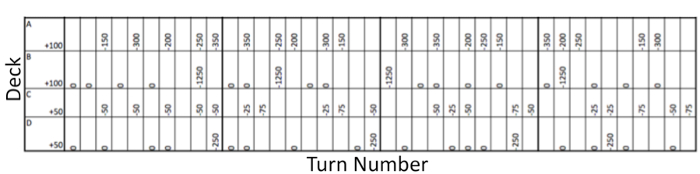
Figure 2: Programmed schedule of reward and punishment. This chart is used by the experimenter to determine the reward and punishment for each card turn. The participant is rewarded with the dollar amount in the first column, and is presented with a punishment based on the schedule detailed in the following columns. Each row represents one deck of cards, either A, B, C, or D. For each card turn from that deck, the participant receives the dollar amount in the first cell. Each column represents the card turn from that deck. For example, the first two turns from deck A have no penalty, then the third turn from deck A has a $150 penalty. There are 40 cards in each deck, each represented by a column in the chart. Please click here to view a larger version of this figure.
3. Data analysis
- Observe and compare the timeline of responses for control and patient populations. Then, to analyze patients' performance and compare their performance to normal performance, use an analysis of variance (ANOVA) to examine the number of cards from each deck chosen by normal controls and by patients. The ANOVA should have the variables of group (controls vs. patients) and choice (A, B, C, D).
- A subsequent Newman-Keuls t-test can be used to show which pairwise differences contribute to significance of the ANOVA.
Source: Laboratories of Jonas T. Kaplan and Sarah I. Gimbel—University of Southern California
Decision-making is an important component of human execu…
Chapters in this video
0:00
Overview
1:11
Experimental Design
3:30
Running the Experiment
4:59
Representative Results
6:17
Applications
7:54
Summary
Copyright © 2026 MyJoVE Corporation. All rights reserved.