Maintenance of organismal proteostasis requires the coordination of protein quality control responses such as chaperone expression from one tissue to another. Here, we provide tools used in C. elegans that allow monitoring of proteostasis capacity in specific tissues and determine intercellular signaling responses.
Method Article
Tissue-Specific RNAi Tools to Identify Components for Systemic Stress Signaling
In This Article
Summary
Abstract
Over the past decade there has been a transformative increase in knowledge surrounding the regulation of protein quality control processes, unveiling the importance of intercellular signaling processes in the regulation of cell-nonautonomous proteostasis. Recent studies are now beginning to uncover signaling components and pathways that coordinate protein quality control from one tissue to another. It is therefore important to identify mechanisms and components of the cell-nonautonomous proteostasis network (PN) and its relevance for aging, stress responses and protein misfolding diseases. In the laboratory, we use genetic knockdown by tissue-specific RNAi in combination with stress reporters and tissue-specific proteostasis sensors to study this. We describe methodologies to examine and to identify components of the cell-nonautonomous PN that can act in tissues perceiving a stress condition and in responding cells to activate a protective response. We first describe how to generate hairpin RNAi constructs for constitutive genetic knockdown in specific tissues and how to perform tissue-specific genetic knockdown by feeding RNAi at different life stages. Stress reporters and behavioral assays function as valuable readouts that enable the fast screening of genes and conditions modifying systemic stress signaling processes. Finally, proteostasis sensors expressed in different tissues are utilized to determine changes in the tissue-specific capacity of the PN at different stages of development and aging. Thus, these tools should help clarify and allow monitoring the capacity of PN in specific tissues, while helping to identify components that function in different tissues to mediate cell-nonautonomous PN in an organism.
Introduction
Cellular proteostasis is monitored by an intricate network of protein quality control components such as molecular chaperones, stress responses and degradation mechanisms including the ubiquitin proteasome system (UPS) and autophagy1,2. The activation of stress response pathways, such as the HSF-1 mediated heat shock response (HSR), the unfolded protein response of the endoplasmic reticulum (UPRER) and the mitochondria (UPRmito) is vital for cellular adaptation to and survival during environmental challenges or protein misfolding disease that lead to toxic protein aggregation1,2,3,4,5,6.
Cellular proteostasis is coordinated by an additional layer in multicellular organisms, such as C. elegans, that requires the orchestration of cellular stress responses across different tissues to activate protective protein quality control components such as molecular chaperones7. In the past decade, cell nonautonomous activation of “cellular” stress response pathways has been observed for the heat shock response (HSR), the UPRER and the UPRmito, as well as transcellular chaperone signaling (TCS)3,4,7,8,9,10. In each case, the nervous system as well as signaling from the intestine plays a crucial role in controlling the activation of chaperones across tissues, to protect against the toxic consequences of acute and chronic protein misfolding stresses3,5,9,11. This transmission from the neurons to the intestine and other cells in the periphery can be achieved by neurotransmitters as is the case for the UPRER and the HSR6,8,11. In one form of cell nonautonomous stress signaling, TCS, that is activated by the increased expression of HSP-90 in the neurons, secreted immune peptides play a role in the activation of hsp-90 chaperone expression from the neurons to the muscle5. In another form of TCS, reducing the expression of the major molecular chaperone hsp-90 in the intestine leads to an increased expression of heat-inducible hsp-70 at permissive temperature in the body wall muscle5,10. In this particular case, the specific signaling molecules activated in the stress-perceiving intestine and the responding muscle cells are, however, unknown.
Thus, in order to identify how chaperone expression is activated from one tissue to another, an approach is required that allows to monitor the capacity of the proteostasis network (PN) and stress response activation at the tissue-specific level. To investigate which stress response pathway is activated in the individual tissues, an available selection of transcriptional chaperone reporters fused to fluorescent protein tags can be utilized (see also Table 3). These include fluorescently tagged hsp-90, hsp-70 and hsp-16.2 transcriptional reporters that indicate the induction of the HSR, hsp-4 that indicates the activation of the UPRER and hsp-6, indicating the UPRmito. The combination of these reporters with a tissue-specific stress condition then allows a powerful read-out that will pin-point individual tissues responding to an imbalance of the PN in a distal “sender” tissue perceiving the stress. To induce a stress condition or imbalance of the PN in a specific tissue, different approaches can be taken. For example, one such approach is by ectopic expression of the activated form of a stress transcription factor (e.g., xbp-1s) and another one is by reducing the expressing levels of an essential molecular chaperone (e.g., hsp-90) using tissue-specific promoters8,10. To deplete PN components in only one cell type, tissue-specific knockdown by RNAi is a useful tool.
In C. elegans, RNAi is however systemic; double stranded RNA in the environment can enter and spread throughout the animal to silence a targeted gene12,13. This systemic spread of ingested dsRNA is mediated by SID (systemic RNAi defective) proteins, such as SID-1 and SID-2 proteins that are dsRNA transporters, as well as SID-5, that colocalizes with late endosome proteins and is implicated in the export of ingested dsRNA14,15,16. SID-1 is a multi-pass transmembrane protein in all cells except neurons, and is required for dsRNA export as well as import into cells17. SID-2 expression is restricted to the intestine where it functions as an endocytic receptor for ingested dsRNA from the intestinal lumen into the cytoplasm of intestinal cells16. Neurons lack a response to systemic RNAi, and this correlates with reduced expression of the transmembrane protein SID-1 in neurons, that is essential for dsRNA to be imported15,18. Thus, for tissue-specific RNAi to be effective in only one cell-type, the systemic spread of dsRNA needs to be prevented. This can be achieved by utilizing the RNAi-resistant sid-1(pk3321) mutant that prevents the release and uptake of dsRNA across tissues15. Expression of a tissue-specific hairpin RNAi construct in this mutant or the ectopic expression of SID-1 in a specific tissue can then complement the function of mutant sid-1 and will allow for tissue-specific RNAi19.
So how is dsRNA ingested by the intestine in a sid-1 loss of function mutant and how can it then reach neurons or muscle cells that ectopically express a SID-1 construct? In one current model explaining this mechanism, endocytosed dsRNA is taken up into the intestinal cytoplasm via SID-2 and then exported into the pseudocoelom by another SID-1 independent mechanism, involving SID-5 and transcytosis17. Thus because SID-1 is required for dsRNA import17, only cells expressing wild type SID-1 will be able to take up the dsRNA released from the intestine into the pseudocoelom.
Here we demonstrate the use of a set of tools that allow for tissue-specific RNAi. We use the example of the molecular chaperone Hsp90 to describe the construction of hairpin RNAi that can be useful to constitutively knock down gene expression in a specific tissue10. The described approach could be used for any target gene of interest. The response of other tissues to the proteostasis imbalance caused by tissue-specific hsp-90 RNAi can be probed by monitoring the expression of fluorescently tagged stress reporters in other tissues. As a second method for tissue-specific RNAi, we demonstrate how the sid-1 mutant system can be adapted for feeding RNAi-expressing bacteria rather than expression of a hairpin RNAi construct. This can be useful when performing a candidate or genome-wide RNAi screen to identify components required for a tissue-specific response. Likewise, developmental defects associated with depletion of a vital PN component will require RNAi-mediated knockdown in specific tissues at later stages of development. We demonstrate how a SID-1 complementation system can be used on a candidate RNAi screen for tissue-specific TCS modifiers. In the example, we aim to identify signaling components that upon knockdown in the “stress-perceiving” sender tissue (intestine) and the stress effecting tissue (muscle) lead to the changed expression of a fluorescently tagged hsp-70 reporter in muscle cells.
Protocol
1. Tissue-specific RNAi in two ways: Hairpin RNAi and tissue-specific SID-1 complementation
- Generation of hairpin RNAi constructs for tissue-specific expression in sid-1 mutants
- Amplify the target gene sequence (e.g., hsp-90 sequence isolated from the hsp-90 RNAi clone from the Ahringer RNAi library20) by PCR. Place a nonpalindromic sequence at the 3’ end of the hsp-90 sequence, that is a SfiI site (ATCTA)21.
NOTE: The primers used for cloning the hsp-90 with the SfiI sequence (underlined) are:
as-hsp90-SfiI 5’-GGCCATCTAGGCCCTGGGTTGATTTCGAGATGCT-3’
as-hsp90 5’ TCATGGAGAACTGCGAAGAGC-3’. - Subclone the amplified sequence into the commercial cloning kit vector (e.g., TOPO pCR BluntII).
- Isolate the inverted hsp-90 sequence from the hsp-90 RNAi clone (Ahringer RNAi library)20 by restriction digestion using XbaI and PstI restriction sites and place it downstream of the hsp-90-SfiI sequence in the vector (from step 1.1.1), resulting in an hsp-90 hairpin construct (Figure 1).
- Subclone the hairpin construct into a Gateway entry vector pDONR221 and fuse it with Gateway entry clones that contain tissue-specific promoters for either expression in neurons (rgef-1p); in the intestine (vha-6p); or the bodywall muscle (unc-54p) and the unc-54 3’UTR (or any other 3’UTR of choice) in a Gateway reaction as described in the protocol of the supplier.
- Linearize the resulting hairpin RNAi constructs (Figure 1) using a unique restriction site outside the coding sequence and microinject as a complex array at a concentration of 1 ng/µL hairpin RNAi construct, mixed with 100 ng/µL N2 Bristol genomic DNA (digested with ScaI) into a C. elegans strain expressing the hsp-70p::RFP reporter (strain AM722) and crossed into the genetic background of sid-1(pk3321) mutants (strain NL3321). For a protocol on how to perform microinjection of complex arrays please follow22.
- As a negative control, use empty vector hairpin constructs expressing the nonpalindromic SfiI containing sequence (GGCCATCTAGGCC) under control of a tissue-specific promoter.
- Use the increased hsp-70p::RFP expression of the reporter as a readout to score positive transformants expressing hsp-90 hairpin RNAi (Figure 3). For a more general approach to verify the tissue-specific knock-down of any gene of interest, measure whole animal mRNA levels using qRT-PCR of the gene of interest.
- Integrate the extrachromosomal array of the resulting strain expressing the intestine-specific hsp-90 hairpin construct (PVH2; see Table 1) by gamma-irradiation. For integration of the extrachromosomal arrays into the genome, please see22.
- Amplify the target gene sequence (e.g., hsp-90 sequence isolated from the hsp-90 RNAi clone from the Ahringer RNAi library20) by PCR. Place a nonpalindromic sequence at the 3’ end of the hsp-90 sequence, that is a SfiI site (ATCTA)21.
- Tissue-specific SID-1 expression to allow for tissue-specific RNAi by feeding dsRNA-expressing bacteria
- Subclone the sid-1 genomic DNA from vector TU867 (unc-119p::SID-1)19 into the Gateway entry vector pDONR221. Primers for cloning of sid-1 DNA can be found in19. Fuse the sid-1 pDONR221 construct with Gateway entry clones containing muscle- (myo-3p) or intestine- (vha-6p) specific promoters and the unc-54 3’UTR (or any other 3’UTR of choice) in the Gateway reaction as described before in 1.1.4.
- Microinject the resulting vha-6p::SID-1::unc-54 3’UTR or myo-3p::SID-1::unc-54 3’UTR constructs at a concentration of 30 ng/µL together with a red fluorescent pharyngeal co-injection marker (e.g., myo-2p::RFP; 5 ng/µL) into sid-1(pk3321) mutants.
- Integrate the extrachromosomal intestine- or muscle-specific sid-1 arrays into the genome as described in22. Here, this resulted in strains PVH5 [myo-3p::SID-1; myo-2p::RFP];sid-1(pk3321) and PVH65 [vha-6p::SID-1; myo-2p::RFP];sid-1(pk3321).
- For neuron-specific expression of sid-1 in the sid-1(pk3321) mutant, use strain TU3401 uIs3401[unc-119p::SID-1; myo-2p::RFP];sid-1(pk3321) that was generated previously by Calixto et al.19.
- As mentioned in 1.1.7, ensure tissue-specific knockdown of the gene of interest by measuring mRNA levels of the desired target gene by qRT-PCR. Alternatively, confirm tissue-specific RNAi sensitivity by using a fluorescent protein (e.g., GFP or RFP) expressed in the same tissue and treat worms with GFP or RFP RNAi. Expose nematodes to GFP/RFP RNAi as synchronized L1 stage larvae and grow on the RNAi bacteria until Day 1 of adulthood (see Figure 2). In our case, we used strains expressing SID-1 in the neurons, muscle or intestine and crossed into strains expressing HSP-90::RFP in neurons (AM987), in the intestine (AM986) and in the muscle (AM988).
2. Using stress reporters and proteostasis sensors to monitor cell autonomous and cell nonautonomous proteostasis
NOTE: To monitor PN capacity in specific tissues, use tissue-specific proteostasis sensors (such as strains expressing Q44 in the intestine or Q35 in the muscle – see Table 3) and stress reporters (such as the heat-inducible hsp-70p::mCherry reporter; Table 3).
- Genetically crossing the sid-1 (pk3321) mutant allele into a proteostasis sensor strain and confirming the presence of sid-1(pk3321) by feeding RNAi
- Genetically cross the proteostasis sensor/stress reporter strain into the genetic background of the sid-1 (pk3321) mutant strain. To establish genetic crosses between different transgenic strains, please follow23 for a detailed protocol.
NOTE: sid-1(pk3321) mutants are resistant to feeding RNAi and hence treatment of embryos with RNAi against an essential gene (such as elt-2 or hsp-90) will only lead to developmental arrests or larval lethality in strains heterozygous or wildtype for the sid-1 gene. - Let 10 gravid hermaphrodites lay eggs on RNAi plates against elt-2 or hsp-90 and control (empty vector; EV) RNAi plates at 20 °C. Remove the mothers after 1 - 2 h. Use N2 Bristol and the sid-1(pk3321) mutant as controls.
- Observe development of the larvae on the RNAi plates over the next 2-3 days. elt-2 RNAi will result in L1 larval arrest, while hsp-90 RNAi results in L3 larval arrest in N2 Bristol. sid-1 mutants will be unaffected by the RNAi treatment and will develop into gravid adults.
NOTE: C. elegans homozygote for sid-1(pk3321) will show a uniform population developing into adulthood. Heterozygotes will be indicated by mixed populations of some animals showing larval arrest, and some animals developing into adults.
- Genetically cross the proteostasis sensor/stress reporter strain into the genetic background of the sid-1 (pk3321) mutant strain. To establish genetic crosses between different transgenic strains, please follow23 for a detailed protocol.
- Confirming the presence of sid-1(pk3321) by genotyping
- Pick 15-20 worms of the selected candidate F2 strain into a PCR tube containing 15 µL of Worm Lysis Buffer (Table 2).
- Place the tube at -80 °C for at least 10 min or overnight.
- Incubate the tube in the PCR machine using the following program:
- 65 °C for 60 min (lyse worm); 95 °C for 15 min (inactivate Proteinase K); hold at 4 °C.
- Use 2 µL of the worm lysate as a “template” to perform the PCR reaction for genotyping, using the following primers for sid-1: sid-1 forw: 5’-agctctgtacttgtattcg-3’ and sid-1 rev: 5’-gcacagttatcagatttg-3’.
- Use the following program for PCR genotyping: 1 cycle at 95 °C for 3 min; then 30 cycles of 95 °C for 10 , 55 °C for 30 s, and 72 °C for 30 s; 1 cycle at 72 °C for 10 min, hold at 4 °C.
- Purify the ~650 bp PCR product using a PCR purification kit (Table of Materials) and sequence the sid-1 PCR product to identify the G-to-A point mutation of the sid-1 (pk3321) allele. Alternatively, the G-to-A point mutation creates an ApoI restriction site, which can be used on the PCR product for genotyping as described in24.
- Using iQ44::YFP as a proteostasis sensor for the intestine
- Synchronize C. elegans expressing Q44::YFP in the intestine (strain OG412) or crossed into the sid-1(pk3321) mutant background by bleaching, following the protocol described in25. Plate synchronized L1 larvae onto a 9 cm nematode growth media (NGM)-agar plate containing OP50 bacteria and grow until L4 stage at 20 °C.
- Collect L4 animals by washing worms off the plate using 5 mL of M9 buffer. Transfer the M9 buffer containing L4 worms to a 15 mL tube using a glass pipette or a siliconized plastic pipette, and centrifuge at 1000 x g for 1 min at room temperature to gently pellet the worms. Remove the supernatant carefully, ensuring to leave the worm pellet undisturbed.
- Critical Step: To transfer or plate out nematodes use a glass pipette or a plastic pipette tip that was treated with a siliconizing agent (e.g., SigmaCote) following the manufacturer’s instruction. This prevents the sticking of worms to the plastic surface of a pipette tip.
- Repeat step 2.3.2 three more times to wash off all OP50 bacteria from the worms.
- Take up the worm pellet in 5 mL of M9 buffer and count the number of worms present in 10 µL.
- Plate L4 animals on 6 cm NGM Agar plates containing empty vector control (EV) or hsp-90 RNAi bacteria at a density of 10 worms per plate (prepare 5 plates per time point and biological replicate) and incubate for 24 -48 hours at 20 °C.
- After 24 hours (=Day 1 adults) and 48 hours (=Day 2 adults) count the number of Q44 foci in the intestines of nematodes exhibiting aggregates. Score a total of at 30-50 nematodes per biological replicate.
3. Tissue-specific candidate RNAi screen for modifiers of cell nonautonomous proteostasis
NOTE: For the tissue-specific RNAi screen we used strain PVH172 allowing for intestine-specific RNAi by feeding RNAi bacteria and strain PVH171 allowing for muscle-specific RNAi (see Table 1 for genotype).
- Preparation of the candidate RNAi plates
- Prepare 6 cm NGM agar plates supplemented with 100 µg/mL ampicillin, 12.5 µg/mL tetracycline and 1 mM IPTG according to standard methods25.
- Use the Ahringer RNAi library to obtain the candidate RNAi clones for the RNAi screen20.
- Inoculate 3 mL of LB-amp media (50 µg/mL ampicillin in LB media) in at 15 mL tube with the desired RNAi clone using a plastic pipette tip. Grow at 37 °C overnight with agitation.
- The next day add Isopropyl-b-D-thiogalactopyranosid (IPTG) (from a 1 M stock) to a final concentration of 1 mM in the bacterial overnight culture.
- Agitate the cultures for a further 3 h at 37 °C.
- Plate 300 µL of bacterial RNAi culture onto a 6 cm NGM agar plate supplemented with 100 µg/mL ampicillin, 12.5 µg/mL tetracycline and 1 mM IPTG. Let the plates dry on the bench for 2 days at room temperature, covered with aluminum foil to protect from light. Once dry, the RNAi plates can be stored in a box at 4 °C for several weeks.
- Synchronization of C. elegans and treatment with RNAi bacteria
- To synchronize worm strains, pick 15 gravid adults onto RNAi plates and allow to lay eggs for 1 h. Then remove the adults from the plate.
- Critical step: Synchronization by bleaching is avoided in this case, because it can induce the hsp-70p::RFP reporter, as it is a stressful condition for C. elegans.
- Pick synchronized L4 stage larvae and transfer to a fresh RNAi plate.
- Allow nematodes to grow on the relevant RNAi for two generations to ensure efficient uptake of dsRNA, making sure the temperature is kept at 20 °C.
- For imaging and hsp-70p::RFP fluorescence quantification, use Day 1 adults.
- Preparation of microscope slides
- Prepare the microscope slides by placing ~250 µL of a 2% agarose solution (in M9 buffer) onto a glass microscope slide and a second slide place on top to create a flat disc.
- Place 5 µL of 5 mM Levamisole solution (in M9 buffer) on the set agarose pad and transfer 5 Day 1 adult worms into the Levamisole drop. Leave the nematodes to paralyze for 5 min.
- Once C. elegans are paralyzed, carefully align with a platinum wire pick and remove excess levamisole with a laboratory wipe before addition of a coverslip.
- Critical step: Ensure to take images of the worms within 30 minutes after preparation of the microscope slides. Paralyzed nematodes on the microscope slide can dry out and burst, which can compromise the fluorescence measurements.
- Microscope settings and image analysis
NOTE: Images are obtained using a confocal microscope equipped with an EM-CCD camera and a microscopy image automation & image analysis software.- Take images at 10x magnifications using a 561 nm laser for RFP fluorescence excitation. Ensure all images are taken using the same settings for laser power, pinhole size and fluorescence gain to enable comparisons.
- Save all images as TIFF files.
- Perform image analysis using ImageJ. Measure fluorescence intensity in each image as pixels per unit area, with background fluorescence subtracted. Normalize fluorescence intensity for each image to the image area as well as the length of the worms.
- Measure the mean intensity using Analyze | Measure in ImageJ. Normalize the resulting intensity value to the image area by dividing the intensity by area.
- To normalize the intensity to worm length, measure the worm by drawing a line along the length of the worm in ImageJ and using Analyze | Measure. The reason for normalizing fluorescence intensity to worm length, is that worms can vary in size, dependent on the gene that is knocked down by RNAi, and this could affect the mean intensity.
- Normalize the measured fluorescence intensities to untreated controls (i.e., transgenic C. elegans grown on control (EV) RNAi plates). Pool the normalized values to compare mean fluorescence intensities for each RNAi condition. Aim to image 20 worms per biological replicate and collect at least 3 biological replicate images.
- Calculate P-values of the mean fluorescence intensity values using student’s t test and perform a correction for multiple testing using the Benjamini-Hochberg method, using a false discovery rate of 0.05.
Results
Tissue-specific RNAi in two ways: Expression of hairpin constructs or tissue-specific SID-1 complementation
Expression of tissue-specific hairpin RNAi constructs allows for constitutive knockdown of a gene throughout development. However this can sometimes be impractical when the surveyed gene is required for organogenesis of that particular tissue, such as elt-2 which is required for development of the intestine26. Tissue-specific SID-1 expression in the RNAi-resistant sid-1 mutants has the particular advantage that tissue-specific gene knockdown can be timed at later stages of development. In both cases (for the expression of a hairpin construct or tissue-specific SID-1 complementation), the efficiency of the tissue-specific RNAi needs to be validated to confirm that only the targeted tissue is affected by RNAi. This is accomplished by co-expressing a fluorescently tagged protein such as HSP-90 fused to RFP (HSP-90::RFP) in different tissues.
We genetically crossed sid-1(pk3321) mutants alone or sid-1 mutants expressing SID-1 in either neurons, intestine or bodywall muscle into C. elegans expressing HSP-90::RFP in the neurons (Figure 2A), intestine (Figure 2B) or the muscle (Figure 2C). The resulting strains were treated with hsp-90 RNAi at L4 stage for 24 hours and HSP-90::RFP expression in specific tissues was examined by fluorescence microscopy.
HSP-90::RFPneuro animals expressing SID-1 in the neurons (unc-119p::SID-1) exhibit reduced expression of HSP-90::RFP in neurons of the magnified tail region (Figure 2A). Likewise, HSP-90::RFPint animals expressing SID-1 in the intestine (vha-6p::SID-1) show reduced HSP-90::RFP expression in the intestine as expected (Figure 2B), whereas sid-1(pk3321) mutants expressing HSP-90::RFP in the intestine are unaffected by feeding hsp-90 RNAi. Intestinal HSP-90::RFP expression also remains unaffected in animals expressing SID-1 in the neurons or the bodywall muscle, indicating that dsRNA is not spreading from the muscle or the neurons to the intestine (Figure 2B). Conversely, HSP-90::RFPmuscle animals expressing SID-1 in the muscle (myo-3p::SID-1) exhibit reduced HSP-90::RFP expression in the muscle during hsp-90 RNAi, while HSP-90::RFP levels are unaffected in worms expressing SID-1 in the neurons or intestine (Figure 2C).
Using a stress reporter for a tissue-specific candidate RNAi screen
Reducing the function or expression of the major molecular chaperone HSP-90 induces the heat shock response and HSP-70 chaperone expression27. Tissue-specific hsp-90 RNAi in the C. elegans intestine results in a strong upregulation of hsp-70 in the muscle, as well as other tissues, as indicated by the stress-inducible hsp-70 reporter (hsp-70p::RFP) (Figure 3A)10. hsp-70 is a heat-inducible chaperone, and thus no expression can be observed in animals grown at permissive temperature (20 °C) (Figure 3A)10,28. Exposure to heat stress (35 °C) induces expression of hsp-70, as indicated by RFP expression of the reporter in the pharynx, spermatheca, intestine and bodywall muscle (Figure 3A). This can be quantified, by measuring RFP fluorescence intensity using Image J software (Figure 3B), as described in step 3.4 of the protocol section.
Constitutive knockdown of hsp-90 in the intestine by hsp-90 hairpin RNAi activates TCS10 and results in a 20-fold upregulation of the hsp-70p::RFP reporter in primarily the bodywall muscle cells (but not detectably in other tissues) at permissive temperature (Figure 3A,3B).
To identify components that trigger the TCS-mediated induction of hsp-70 expression from the intestine to the muscle, we performed a tissue-specific candidate RNAi screen of 58 candidate genes (see Figure 4A for an experimental flow chart). The candidate genes were identified in a preceding forward genetic screen and transcriptome analysis as potential modifiers of TCS in the hsp-90int hp-RNAi strain (Figure 4); and consisted of components involved in cellular signaling processes, such as kinases, transcription factors and membrane proteins. We next wanted to determine in which tissue the candidate genes were acting as enhancers or suppressors of TCS-induced hsp-70 expression in the muscle. This is achieved by measuring reduced (enhancer) or increased (suppressor) hsp-70p::RFP fluorescence intensity of the reporter.
To perform the tissue-specific RNAi screen we first genetically crossed the hsp-90int hp-RNAi strain into C. elegans expressing SID-1 in either intestine or muscle. Intestinal SID-1 expression allows to screen for potential TCS signaling components acting in the intestine to mediate TCS, which is the tissue that perceives stress as reduced levels of hsp-90. Likewise, muscle specific SID-1 expression allows for screening TCS components required in the responding muscle tissue. The 58 candidate genes used for the tissue-specific RNAi screen were termed txt (tcs-(x)cross-tissue).
Animals were grown on RNAi plates for two generations until Day 1 of adulthood and hsp-70p::RFP fluorescence intensity in the muscle was measured by ImageJ software. As shown in Figure 4, RNAi-mediated knockdown of 58 candidate txt genes in the intestine (Figure 4B) or the muscle (Figure 4C) resulted in a range of modifiers that either suppress or enhance hsp-70 induction in the muscle. RNAi of candidates that result in a significant increase of hsp-70p::RFP fluorescence intensity indicate that the gene acts as a cell nonautonomous suppressor of TCS, whereas a reduction of RFP fluorescence intensity indicates that the candidate gene functions as an enhancer. The scored hits (enhancers/suppressors) can then be confirmed by measuring their effect on endogenous hsp-70 mRNA levels by qRT-PCR and using proteostasis sensors.
Use of proteostasis sensors to monitor tissue-specific PN capacity.
TCS-mediated induction of hsp-70 expression protects against protein misfolding and aggregation in a cell nonautonomous manner5,10. Proteostasis sensors can be used to survey the folding capacity in different tissues during stress conditions. These include endogenous, metastable proteins such as for example a conditional (temperature-sensitive; ts) mutant of myosin expressed exclusively in the bodywall muscle (unc-54(ts))29 or proteins containing expanded stretches of glutamine (PolyQ)30,31,32 (See Table 3 for a list of strains). Proteins within a length of 35-40 glutamines are particularly useful for this purpose, as they aggregate in an age- and stress-dependent manner and are thus highly suitable to report on the folding environment in specific tissues. These include strains expressing Q40::YFP in the neurons or Q35::YFP in the muscle and Q44::YFP in the intestine30,31,32. In addition to using PolyQ aggregation as a read-out, strains expressing Q40::YFP or Q35::YFP also exhibit an age-dependent motility defect30, allowing quantification of motility by measuring thrashing rates in an automated manner (see 33 for a detailed example).
Here, we co-expressed intestinal Q44::YFP32 in strains allowing for tissue-specific RNAi via SID-1 complementation. RNAi-mediated knockdown of hsp-90 at L4 stage in the neurons, intestine or bodywall muscle, which induces TCS10, resulted in a reduced accumulation of intestinal Q44 aggregates in Day 2 adults compared to control animals (Figure 5). Thus, this indicates that the TCS-mediated cell nonautonomous upregulation of hsp-70 expression protects against age-associated protein misfolding in multiple tissues of C. elegans.
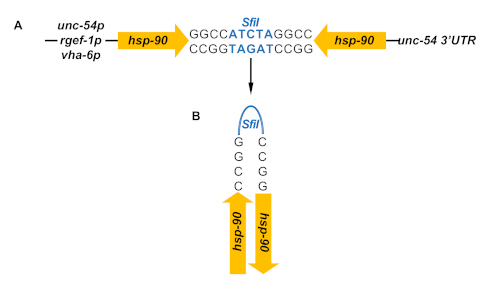
Figure 1. Hairpin RNAi for constitutive gene knockdown in specific tissues. (A) The inverted repeats of hsp-90 are generated by head-head ligation through a SfiI site (blue) introduced at one end of each repeat. The inverted repeats are under control of a tissue-specific promoter for either muscle- (unc-54p), neuron- (rgef-1p) or intestine- (vha-6p) specific expression. (B) The tissue-specific expression of the inverted hsp-90 repeats will produce hairpin-loop RNA that induces tissue-specific RNAi in a strain with a sid-1(pk3321) mutant genetic background. Please click here to view a larger version of this figure.
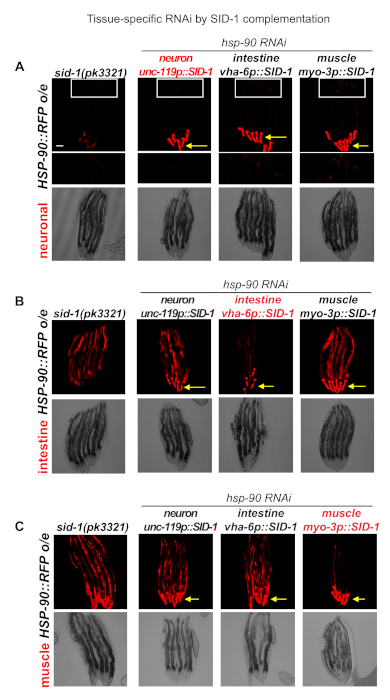
Figure 2. Tissue-specific expression of SID-1 to enhance tissue-selective RNAi-mediated knockdown. (A) Overexpression of HSP-90::RFP in the neurons of RNAi-resistant sid-1(pk3321) mutants. Expression of SID-1 in the neurons (unc-119p::SID-1) (strain PVH16); in the intestine (vha-6p::SID-1) (strain PVH17); and muscle (myo-3p::SID-1) (strainPVH18) enhances RNAi sensitivity in these specific tissues. Animals were exposed to hsp-90 RNAi bacteria after L4 stage for 24 hours, leading to visibly reduced neuronal-specific HSP-90::RFP fluorescence intensity in the unc-119p::SID-1 expressing animals only. Neurons in the tail region of the nematodes are magnified. (B) Overexpression of HSP-90::RFP in the intestine of RNAi-resistant sid-1(pk3321) mutants. Expression of SID-1 in the neurons (unc-119p::SID-1) (strain PVH19); in the intestine (vha-6p::SID-1) (strain PVH20); and muscle (myo-3p::SID-1) (strain PVH21) enhances RNAi sensitivity in these specific tissues. Animals were exposed to hsp-90 RNAi bacteria after L4 stage for 24 hours, leading to visibly reduced intestine-specific HSP-90::RFP fluorescence intensity in the intestine of vha-6p::SID-1 expressing animals only. (C) Overexpression of HSP-90::RFP in the bodywall muscle of RNAi-resistant sid-1(pk3321) mutants. Expression of SID-1 in the neurons (unc-119p::SID-1) (strain PVH22); in the intestine (vha-6p::SID-1) (strain PVH23); and muscle (myo-3p::SID-1) (strain PVH24) enhances RNAi sensitivity in these specific tissues. This is indicated by a visibly reduced HSP-90::RFP fluorescence intensity in the muscle of myo-3p::SID-1 expressing animals, but not in unc-119p::SID-1 or vha-6p::SID-1 expressing animals or control animals (sid-1(pk3321)) that are resistant to RNAi in all tissues. Yellow arrows indicate the red fluorescent pharyngeal co-injection marker (myo-2p::RFP). Scale bar = 50 mm. Please click here to view a larger version of this figure.

Figure 3. Expression of intestine-specific hsp-90 hairpin RNAi induces the heat-inducible hsp-70p::RFP reporter at permissive temperature in the muscle. (A) Fluorescent microscope images of animals expressing the hsp-70 promoter fused to red fluorescent protein (RFP) and in the background of sid-1(pk3321) mutants (control) (strain AM994). Animals were either grown at 20°C (no HS) or treated with 1-hour heat shock at 35°C (HS) and allowed to recover for 6 hours post-HS. hsp-90intestine hp-RNAi animals (strain PVH2) express an hsp-90 hairpin RNAi construct under control of the intestine-specific promoter (vha-6p) in the genetic background of hsp-70p::RFP;sid-1(pk3321). Scale bar = 100 μm (B) Quantification of RFP fluorescence intensity of control animals grown at 20 °C (no HS), treated with a 1h HS at 35°C (HS) or expressing intestine-specific hsp-90 hairpin RNAi at permissive temperature (20°C). Bar graphs represent the average of 3 biological replicates; error bars represent S.E.M. P-values were calculated using student’s t test. *P < 0.05. Please click here to view a larger version of this figure.
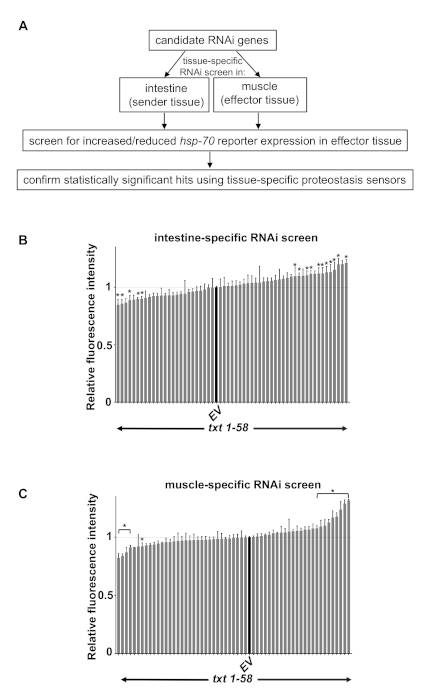
Figure 4. Tissue-specific RNAi screen to identify modifiers of transcellular chaperone signalling. (A) Flow chart demonstrating the tissue-specific RNAi screening protocol using stress reporters and tissue-specific proteostasis sensors. (B) Intestine-specific RNAi screen by feeding dsRNA bacteria to hsp-90intestine hp-RNAi animals expressing vha-6p::SID-1 (strain PVH172; see Table 1 for genotype). Shown are candidate genes that act as potential modifiers of TCS (txt for tcs-(x)cross-tissue) by either suppressing or enhancing the hsp-70p::RFP fluorescence intensity in the bodywall muscle when knocked down in the intestine. (C) Muscle-specific RNAi screen by treating hsp-90intestine hp-RNAi animals expressing myo-3p::SID-1 (strain PVH171; see Table 1) with txt candidate gene RNAi. (B and C) Fluorescence intensity of candidate genes are indicated as gray bars and are normalized to control (EV) RNAi which is indicated as a black bar. Error bars are S.E.M. of 5 biological replicates. The statistical significance of decreased or increased RFP fluorescence intensity between txt gene RNAi compared to empty vector (EV) control RNAi was calculated using student’s t test, and correction for multiple testing was performed using the Benjamini-Hochberg method with a false discovery rate of 0.05. * P < 0.05. Please click here to view a larger version of this figure.
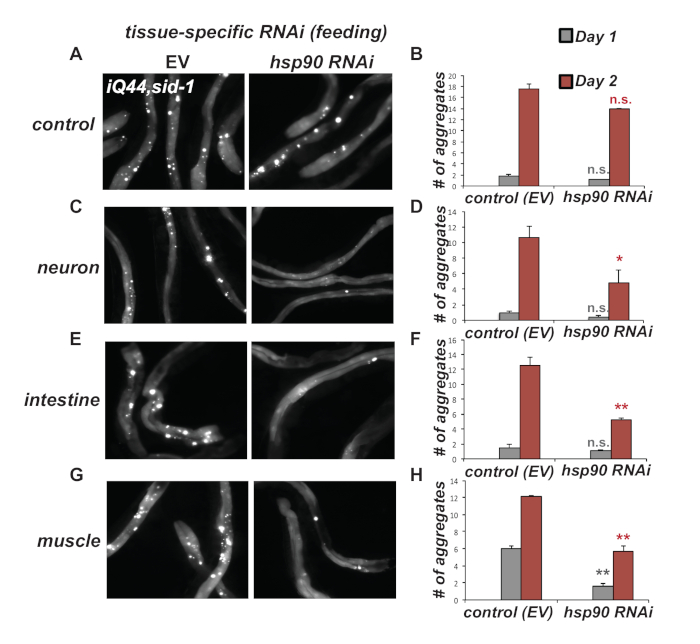
Figure 5. Tissue-specific hsp-90 RNAi reduces intestinal Q44::YFP (iQ44) aggregation. (A & B) Expression of intestinal Q44::YFP in the background of RNAi-resistant sid-1(pk3321) mutant allele (strain PVH228) leads to accumulation of Q44 foci by Day 2 of adulthood. RNAi-mediated knockdown by feeding E. coli expressing hsp-90 dsRNA from L4 stage onwards is ineffective compared to control RNAi (EV). (C & D) Neuron-specific (strain PVH229), (E & F) intestine-specific (strain PVH230) or (G & H) muscle-specific hsp-90 RNAi (strain 231) leads to reduced accumulation of iQ44 foci at Day 2 of adulthood. (B, D, F, H) Quantification of the number of Q44 foci in worms exhibiting age-dependent Q44 aggregation at Day 1 and Day 2 of adulthood. Error bars are S.E.M of 3 biological replicates. Statistical significance between hsp-90 and empty vector (EV) RNAi at Day 1 or Day 2 of adulthood was calculated using a student’s t test. n.s. not significant; *P < 0.05; **P < 0.01. Please click here to view a larger version of this figure.
| Strain name | Genotype | Source |
| N2 | wild type | CGC |
| AM986 | rmIs346[vha-6p::HSP-90::RFP] | PVO lab |
| AM987 | rmIs347[rgef-1p::HSP-90::RFP] | PVO lab |
| AM988 | rmIs347[unc-54p::HSP-90::RFP] | PVO lab |
| TU3401 | uIs69 [pCFJ90 (myo-2p::mCherry) + unc-119p::sid-1]; sid-1(pk3321) | CGC |
| PVH2 | pccIs002[vha-6p::hsp-90 RNAi::unc-54 3’UTR]; rmIs288[hsp-70p::mCherry; myo-2p::CFP]; sid-1 (pk3321) | PVO lab |
| PVH5 | pccIs005[myo-3p::SID-1::unc-54 3’UTR +myo-2p::RFP]; sid-1 (pk3321) | PVO lab |
| PVH65 | pccIs004[vha-6p::SID-1::unc-54 3’UTR + myo-2p::RFP]; sid-1(pk3321) | PVO lab |
| NL3321 | sid-1 (pk3321) | CGC |
| AM722 | rmIs288[hsp-70p::mCherry; myo-2p::CFP] | Morimoto lab |
| AM799 | hsp-90p::GFP | Morimoto lab |
| OG412 | vha-6p::Q44::YFP | CGC |
| PVH228 | vha-6p::Q44::YFP; sid-1(pk3321) | PVO lab |
| PVH171 | sid-1 (pk3321); rmIs288 (myo-2p::CFP; C12C8.1p::mCherry); pccIs002 (vha-6p::hsp-90 RNAi::unc-54 3'-UTR); pccIs005 (myo-3p::SID-1::unc-54 3’UTR; myo-2p::RFP) | PVO lab |
| PVH172 | sid-1 (pk3321); rmIs288 (myo-2p::CFP; C12C8.1p::mCherry); pccIs002 (vha-6p::hsp-90 RNAi::unc-54 3'-UTR); pccIs004 (vha-6p::SID-1::unc-54 3’UTR; myo-2p::RFP) | PVO lab |
| PVH26 | rmIs345[F25B3.3p::HSP-90::RFP]; rmIs317[hsp-90pr::GFP; pCeh361]; sid-1(pk3321) | PVO lab |
| PVH16 | rmIs345[F25B3.3p::HSP-90::RFP]; rmIs317[hsp-90pr::GFP; pCeh361]; sid-1(pk3321); uIs69 [pCFJ90 (myo-2p::mCherry) + unc-119p::sid-1] | PVO lab |
| PVH17 | rmIs345[F25B3.3p::HSP-90::RFP]; rmIs317[hsp-90pr::GFP; pCeh361]; sid-1(pk3321); pccIs004[vha-6p::SID-1::unc-54 3’UTR + myo-2p::RFP] | PVO lab |
| PVH18 | rmIs345[F25B3.3p::HSP-90::RFP]; rmIs317[hsp-90pr::GFP; pCeh361]; sid-1(pk3321); pccIs005[myo-3p::SID-1::unc-54 3’UTR +myo-2p::RFP; | PVO lab |
| PVH14 | rmIs346[vha-6p::HSP-90::RFP]; rmIs317[hsp-90pr::GFP; pCeh361]; sid-1(pk3321) | PVO lab |
| PVH19 | rmIs346[vha-6p::HSP-90::RFP]; rmIs317[hsp-90pr::GFP; pCeh361]; sid-1(pk3321); uIs69 [pCFJ90 (myo-2p::mCherry) + unc-119p::sid-1] | PVO lab |
| PVH20 | rmIs346[vha-6p::HSP-90::RFP]; rmIs317[hsp-90pr::GFP; pCeh361]; sid-1(pk3321); pccIs004[vha-6p::SID-1::unc-54 3’UTR + myo-2p::RFP | PVO lab |
| PVH21 | rmIs346[vha-6p::HSP-90::RFP]; rmIs317[hsp-90pr::GFP; pCeh361]; sid-1(pk3321); pccIs005[myo-3p::SID-1::unc-54 3’UTR +myo-2p::RFP | PVO lab |
| PVH15 | rmIs347[unc-54p::HSP-90::RFP]; rmIs317[hsp-90pr::GFP; pCeh361]; sid-1(pk3321) | PVO lab |
| PVH22 | mIs347[unc-54p::HSP-90::RFP]; rmIs317[hsp-90pr::GFP; pCeh361]; sid-1(pk3321) uIs69 [pCFJ90 (myo-2p::mCherry) + unc-119p::sid-1] | PVO lab |
| PVH23 | rmIs347[unc-54p::HSP-90::RFP]; rmIs317[hsp-90pr::GFP; pCeh361]; sid-1(pk3321); pccIs004[vha-6p::SID-1::unc-54 3’UTR + myo-2p::RFP | PVO lab |
| PVH24 | rmIs347[unc-54p::HSP-90::RFP]; rmIs317[hsp-90pr::GFP; pCeh361]; sid-1(pk3321); pccIs005[myo-3p::SID-1::unc-54 3’UTR +myo-2p::RFP | PVO lab |
| AM994 | rmIs288[hsp-70p::mCherry; myo-2p::CFP]; sid-1 (pk3321) | PVO lab |
| PVH229 | vha-6p::Q44::YFP; sid-1(pk3321);uIs69 [pCFJ90 (myo-2p::mCherry) + unc-119p::sid-1] | PVO lab |
| PVH230 | vha-6p::Q44::YFP; sid-1(pk3321);pccIs004[vha-6p::SID-1::unc-54 3’UTR + myo-2p::RFP | PVO lab |
| PVH231 | vha-6p::Q44::YFP; sid-1(pk3321);pccIs005[myo-3p::SID-1::unc-54 3’UTR +myo-2p::RFP | PVO lab |
Table 1. List of strains used in this work.
| Solution | Reagent | Final Concentration |
| Worm Lysis buffer | 1 M Tris pH 8.9 | 10 mM |
| 2 M KCl | 50 mM | |
| 50 mM MgCl2 | 1 mM | |
| Tween 20 | 0.5% | |
| 2% Gelatin | 0.25% | |
| Proteinase K | 0.1 mg/mL |
Table 2. Worm Lysis Buffer.
| Strain name | Genotype | Source | Use |
| Stress reporters | |||
| AM722 | hsp-70p::mCherry; myo-2p::CFP | Morimoto lab | HSR |
| AM446 | hsp-70p::GFP; rol-6 | Morimoto lab | HSR |
| AM799 | hsp-90p::GFP | Morimoto lab | HSR |
| TJ375 | hsp-16.2p::GFP | CGC | HSR |
| TJ3001 | hsp-16.2p::GFP;Cbr-unc-119p(+) | CGC | HSR |
| CF1553 | sod-3p::GFP;rol-6 | CGC | oxidative stress |
| CL2166 | gst-4p::GFP::NLS | CGC | oxidative stress |
| LD1 | skn-1p::SKN-1::GFP;rol-6 | CGC | oxidative stress |
| SJ4005 | hsp-4p::GFP | CGC | UPRER |
| SJ4100 | hsp-6p::GFP | CGC | UPRmito |
| SJ4058 | hsp-60p::GFP | CGC | UPRmito |
| Proteostasis reporters | |||
| Folding sensor (transgene) | |||
| AM140 | unc-54p::Q35::YFP | Morimoto lab | muscle-specific polyQ expression |
| AM141 | unc-54p::Q40::YFP | Morimoto lab | muscle-specific polyQ expression |
| OG412 | vha-6p::Q44::YFP | CGC | intestine-specific polyQ expression |
| FUH55 | unc-54p::FLUC::EGFP;rol-6 | Hartl lab | muscle-specific of wt luciferase |
| FUH134 | unc-54p::FLUCSM::EGFP;rol-6 | Hartl lab | muscle-specific expression of R188Q mutant luciferase |
| FUH135 | unc-54p::FLUCDM::EGFP;rol-6 | Hartl lab | muscle-specific expression of R188Q,R261Q double mutant luciferase |
| FUH48 | rgef-1::FLUC::EGFP;rol-6 | Hartl lab | neuron-specific expression of wt luciferase |
| FUH136 | rgef-1::FLUCSM::EGFP;rol-6 | Hartl lab | neuron-specific expression of R188Q mutant luciferase |
| FUH137 | rgef-1::FLUCDM::EGFP;rol-6 | Hartl lab | neuron-specific expression of R188Q,R261Q double mutant luciferase |
| (endogenous) conditional folding sensors | |||
| CB1301 | unc-54(e1301) I | CGC | myosin(ts), temperature sensitive mutant (muscle) |
| CB1157 | unc-54(e1157) I | CGC | myosin(ts), temperature sensitive mutant (muscle) |
| CB1402 | unc-15(e1402) | CGC | paramyosin(ts), temperature sensitive mutant (muscle) |
| HE250 | unc-52(e669su250) II | CGC | perlecan(ts), temperature sensitive mutant (muscle) |
| SD551 | let-60(ga89) | CGC | Ras(ts), temperature sensitive mutant (multiple tissues) |
| CX51 | dyn-1(ky51) | CGC | Dynamin(ts), temperature sensitive mutant (multiple tissues) |
| CW152 | gas-1(fc21) | CGC | Gas-1(ts), temperature sensitive, EtOH sensitive |
| Autophagy reporter | |||
| MAH215 | lgg-1p::mCherry::GFP::lgg-1;rol-6 | CGC | tandem tagged autophagy reporter |
| DA2123 | lgg-1p::LGG-1::GFP; rol-6 | CGC | ubiquitious autophagy reporter |
| DLM10 | myo-3p::CERULEAN-VENUS::lgg-1 + unc-119(+) | CGC | muscle-specific autophagy reporter |
| DLM12 | rab-3p::CERULEAN-VENUS::lgg-1 + unc-119(+) | CGC | neuron-specific autophagy reporter |
| DLM4 | vha-6p::CERULEAN-VENUS::lgg-1 + unc-119(+) | CGC | intestine-specific autophagy reporter |
| DLM2 | eft-3p::CERULEAN-VENUS::lgg-1 + unc-119(+) | CGC | ubiquitous autophagy reporter |
| Ubiquitin Proteasome System (UPS) reporter | |||
| rgef-1p::UbG76V::Dendra2 | Holmberg lab (Ref. 38) | neuron-specific UPS reporter | |
| AGD1033 | unc-54p::UbG76::Dendra2 | CGC | muscle-specific UPS reporter |
| dat-1p::UbG76::Dendra2 | Holmberg lab (Ref. 38) | dopaminergic-neuron specific UPS reporter |
Table 3. List of proteostasis sensor- and stress reporter strains.
Discussion
The methods described here demonstrate the use of tools that allow for the tissue-specific knockdown of PN components in a constitutive and temporal manner. We have previously identified TCS, a cell nonautonomous stress response mechanism that is induced by tissue-specific alteration of Hsp90 expression levels10. Tissue-specific knockdown of hsp-90 by expression of hairpin RNAi leads to cell nonautonomous upregulation of protective hsp-70 chaperone expression in distal tissues, that increases organismal stress resistance10. We however do not know which signaling components in the stress-perceiving or responding tissue are activated to initiate this protective response. To identify signaling components mediating this process, tissue-specific reverse genetic screens are one of the important methods of choice.
Although tissue-specific knockdown by expression of a hairpin construct can be effective, this has disadvantages when a larger number of genes needs to be surveyed. Using RNAi-resistant sid-1 mutants complemented by expression of SID-1 in intestine, neurons or muscle allows for tissue-specific gene knockdown by feeding RNAi and is thus an amenable tool for tissue-specific genetic screens. While we here described a small-scale RNAi screen of 58 candidate genes, the tissue-specific SID-1 system can be adapted for larger scale or genome-wide RNAi screens. For this, C. elegans growth in a 96-well plate format and automated scoring of fluorescence intensity by a plate reader will be required.
While the sid-1 system can be effective for tissue-specific RNAi, an alternative method takes advantage of rde-1, an Argonaute protein that functions cell-nonautonomously to mediate systemic RNAi capacity13. Tissue-specific promoters driving rde-1 rescue constructs also allow for RNAi to be effective in specific tissues, similar to the sid-1 system 34. However, rde-1 mutations used in the rde-1 system rely on a RDE-1 E411K missense mutation that may not completely abrogate RDE-1 function and so could lead to leakiness of RNAi activity in other tissues34,35 . This issue however seems to be eliminated by the use of a newly generated rde-1(mkc36) indel mutation35. A particular current advantage of the rde-1 system compared to the sid-1 system is the recent adaptation of the rde-1 system for specific and effective RNAi in the germline35. This is important, as other currently existing germline-specific RNAi strains can also exhibit RNAi efficiency in the soma. Thus, the rde-1 system allowing for germline RNAi could be a useful tool for researchers investigating the importance of the germline in various biological processes, such as for example aging research.
This method is based on multicopy expression of integrated tissue-specific SID-1 arrays. To achieve more physiological expression levels of SID-1 in the specific tissues, a CRISPR-Cas9 mediated single-copy knock-in method at defined genomic loci could be adapted for future use of the sid-1 system and to express SID-1 under control of tissue-specific promoters36.
To investigate stress pathway activation, one has the choice of a large selection of transcriptional chaperone reporters fused to green or red fluorescent proteins (Table 3). Tissue-specific (intracellular) stress as opposed to environmental stress, may also lead to a differential tissue expression profile of chaperone reporters, as shown by the results in Figure 3. For example, while heat stress leads to induction of the hsp-70p::RFP reporter in multiple tissues (muscle, spermatheca, pharynx, intestine), hsp-90 hairpin RNAi in the intestine results in strong upregulation of hsp-70 in the muscle (Figure 3A). This may indicate that muscle cells are more sensitive to changes in cell nonautonomous hsp-90 levels, however it cannot be excluded that hsp-70 is also induced in other tissues, albeit this is not visibly detectable with the transcriptional reporter fused to a red fluorescent protein.
Therefore, proteostasis sensors are an important alternative, as they report on the actual folding environment or capacity of the PN in a specific tissue. The folding environment is not only dependent on chaperone expression, but also on PN components that regulate clearance of misfolded protein such as autophagy or UPS. For example, if enhanced folding capacity is indicated by one of the well-established folding sensors, but this does not overlap with increased chaperone expression, then this may suggest that other components of the PN are activated that increase proteostasis in a specific tissue. For example hsp-4 is primarily induced in the intestine when the cell nonautonomous UPR is activated in the neurons, yet the accumulation of misfolded proteins expressed in muscle cells is also suppressed, possibly via lysosome activating signals from the intestine3. Likewise, the data shows that hsp-90 RNAi in the intestine delays iQ44 aggregation in the intestine (Figure 5), even though expression of the hsp-70 reporter was not detected in the same tissue (Figure 3). Thus in addition to folding sensors that report on the folding environment in a given tissue, reporters for autophagic flux such as Cherry::GFP::LGG-137 or reporters that indicate the activity of the UPS such as UbG76V::Dendra238 expressed in different tissues are just as crucial.
Taken together, we have described a tissue-specific RNAi system that allows for the examination of the PN capacity in different tissues in response to a cell nonautonomously activated stress response mechanism.
Disclosures
The authors have nothing to disclose.
Acknowledgements
We thank Dr. Richard I. Morimoto for providing strain AM722. Some C. elegans strains used in this research were provided by the Caenorhabditis Genetics Center, which is funded by the NIH Office of Research Infrastructure Programs (P40 OD010440). P.v.O.-H. was funded by grants from the NC3Rs (NC/P001203/1) and by a Wellcome Trust Seed Award (200698/Z/16/Z). J.M. was supported by a MRC DiMeN doctoral training partnership (MR/N013840/1).
Materials
| Name | Company | Catalog Number | Comments |
|---|---|---|---|
| Ampicillin | Merck | A0166-5G | Protocol Section 3.1. |
| DNA Clean & Concentrator-500 | Zymo Research | D4031 | Protocol Section 2.2. |
| IPTG Isopropyl-β-D-thiogalactoside | Merck | 367-93-1 | Protocol Section 3.1. |
| Multisite Gateway Cloning Kit | Thermo Fisher | 12537100 | Protocol Section 1.2. |
| SigmaCote | Merck | SL2-25mL | Protocol Section 2.3. |
| Tetracycline | Merck | T7660-5G | Protocol Section 3.1. |
| Zero Blunt TOPO PCR Cloning Kit | Thermo Fisher | K280002 | Protocol Section 1.1. |
References
- Morimoto, R. I. The heat shock response: systems biology of proteotoxic stress in aging and disease. Cold Spring Harbor Symposia on Quantitative Biology. 76, 91-99 (2011).
- Hipp, M. S., Kasturi, P., Hartl, F. U. The proteostasis network and its decline in ageing. Nature Reviews Molecular Cell Biology. 20, 421-435 (2019).
- Imanikia, S., Özbey, N. P., Krueger, C., Casanueva, M. O., Taylor, R. C. Neuronal XBP-1 Activates Intestinal Lysosomes to Improve Proteostasis in C. elegans. Current Biology. 29, 2322-2338 (2019).
- Berendzen, K. M., et al. Neuroendocrine Coordination of Mitochondrial Stress Signaling and Proteostasis. Cell. 166, 1553-1563 (2016).
- O'Brien, D., et al. A PQM-1-Mediated Response Triggers Transcellular Chaperone Signaling and Regulates Organismal Proteostasis. Cell Reports. 23, 3905-3919 (2018).
- Tatum, M. C., et al. Neuronal Serotonin Release Triggers the Heat Shock Response in C. elegans in the Absence of Temperature Increase. Current Biology. 25, 163-174 (2015).
- Miles, J., Scherz-Shouval, R., van Oosten-Hawle, P. Expanding the Organismal Proteostasis Network: Linking Systemic Stress Signaling with the Innate Immune Response. Trends in Biochemical Sciences. 44, 927-942 (2019).
- Taylor, R. C., Dillin, A. XBP-1 Is a Cell-Nonautonomous Regulator of Stress Resistance and Longevity. Cell. 153, 1435-1447 (2013).
- Prahlad, V., Cornelius, T., Morimoto, R. I. Regulation of the Cellular Heat Shock Response in Caenorhabditis elegans by Thermosensory Neurons. Science. 320, 811-814 (2008).
- van Oosten-Hawle, P., Porter, R. S., Morimoto, R. I. Regulation of Organismal Proteostasis by Transcellular Chaperone Signaling. Cell. 153, 1366-1378 (2013).
- Frakes, A. E., et al. Four glial cells regulate ER stress resistance and longevity via neuropeptide signaling in C. elegans. Science. 367, 436-440 (2020).
- Timmons, L., Fire, A. Specific interference by ingested dsRNA. Nature. 395, 854(1998).
- Tabara, H., Grishok, A., Mello, C. C. RNAi in C. elegans: soaking in the genome sequence. Science. 282, 430-431 (1998).
- Hinas, A., Wright, A. J., Hunter, C. P. SID-5 is an endosome-associated protein required for efficient systemic RNAi in C. elegans. Current Biology. 22, 1938-1943 (2012).
- Winston, W. M., Molodowitch, C., Hunter, C. P. Systemic RNAi in C. elegans Requires the Putative Transmembrane Protein SID-1. Science. 295, 2456-2459 (2002).
- McEwan, D. L., Weisman, A. S., Hunter, C. P. Uptake of extracellular double-stranded RNA by SID-2. Molecular Cell. 47, 746-754 (2012).
- Whangbo, J. S., Weisman, A. S., Chae, J., Hunter, C. P. SID-1 Domains Important for dsRNA Import in Caenorhabditis elegans. G3 GenesGenomesGenetics. 7, 3887-3899 (2017).
- Feinberg, E. H., Hunter, C. P. Transport of dsRNA into cells by the transmembrane protein SID-1. Science. 301, 1545-1547 (2003).
- Calixto, A., Chelur, D., Topalidou, I., Chen, X., Chalfie, M. Enhanced neuronal RNAi in C. elegans using SID-1. Nature Methods. 7, 554-559 (2010).
- Kamath, R. S., et al. Systematic functional analysis of the Caenorhabditis elegans genome using RNAi. Nature. 421, 231-237 (2003).
- Lee, Y. S., Carthew, R. W. Making a better RNAi vector for Drosophila: use of intron spacers. Methods (San Diego CA). 30, 322-329 (2003).
- Evans, T. Transformation and microinjection. WormBook. , (2006).
- Fay, D. Genetic mapping and manipulation: Chapter 1-Introduction and basics. WormBook. , (2006).
- Lim, M. A., et al. Reduced Activity of AMP-Activated Protein Kinase Protects against Genetic Models of Motor Neuron Disease. Journal of Neuroscience. 32, 1123-1141 (2012).
- Stiernagle, T. Maintenance of C. elegans. WormBook. , (2006).
- Hawkins, M. G., McGhee, J. D. elt-2, a second GATA factor from the nematode Caenorhabditis elegans. Journal of Biological Chemistry. 270, 14666-14671 (1995).
- Bharadwaj, S., Ali, A., Ovsenek, N. Multiple components of the HSP90 chaperone complex function in regulation of heat shock factor 1 In vivo. Molecular and Cellular Biology. 19, 8033-8041 (1999).
- Guisbert, E., Czyz, D. M., Richter, K., McMullen, P. D., Morimoto, R. I. Identification of a tissue-selective heat shock response regulatory network. PLoS Genetics. 9, 1003466(2013).
- Ben-Zvi, A., Miller, E. A., Morimoto, R. I. Collapse of proteostasis represents an early molecular event in Caenorhabditis elegans aging. Proceedings of the National Academy of Sciences of the United States of America. 106, 14914-14919 (2009).
- Morley, J. F., Brignull, H. R., Weyers, J. J., Morimoto, R. I. The threshold for polyglutamine-expansion protein aggregation and cellular toxicity is dynamic and influenced by aging in Caenorhabditis elegans. Proceedings of the National Academy of Sciences of the United States of America. 99, 10417-10422 (2002).
- Brignull, H. R., Moore, F. E., Tang, S. J., Morimoto, R. I. Polyglutamine Proteins at the Pathogenic Threshold Display Neuron-Specific Aggregation in a Pan-Neuronal Caenorhabditis elegans Model. Journal of Neuroscience. 26, 7597-7606 (2006).
- Mohri-Shiomi, A., Garsin, D. A. Insulin Signaling and the Heat Shock Response Modulate Protein Homeostasis in the Caenorhabditis elegans Intestine during Infection. Journal of Biological Chemistry. 283, 194-201 (2008).
- Nussbaum-Krammer, C. I., Neto, M. F., Brielmann, R. M., Pedersen, J. S., Morimoto, R. I. Investigating the spreading and toxicity of prion-like proteins using the metazoan model organism C. elegans. Journal of Visualized Experiments. , e52321(2015).
- Qadota, H., et al. Establishment of a tissue-specific RNAi system in C. elegans. Gene. 400, 166-173 (2007).
- Zou, L., et al. Construction of a germline-specific RNAi tool in C. elegans. Scientific Reports. 9, 1-10 (2019).
- Silva-García, C. G., et al. Single-Copy Knock-In Loci for Defined Gene Expression in Caenorhabditis elegans. G3 Bethesda Md. 9, 2195-2198 (2019).
- Chang, J. T., Kumsta, C., Hellman, A. B., Adams, L. M., Hansen, M. Spatiotemporal regulation of autophagy during Caenorhabditis elegans aging. eLife. 6, 18459(2017).
- Hamer, G., Matilainen, O., Holmberg, C. I. A photoconvertible reporter of the ubiquitin-proteasome system in vivo. Nature Methods. 7, 473-478 (2010).
Reprints and Permissions
This article has been published
Video Coming Soon