Here, we demonstrate the use of fluorescence lifetime imaging microscopy (FLIM) to sequentially image cellular metabolism and plasma membrane viscosity in live cancer cell culture. Metabolic assessments are performed by detecting endogenous fluorescence. Viscosity is measured using a fluorescent molecular rotor.
A subscription to JoVE is required to view this content. Sign in or start your free trial.
Method Article
Probing Metabolism and Viscosity of Cancer Cells using Fluorescence Lifetime Imaging Microscopy
In This Article
Summary
Abstract
Viscosity is an important physical property of a biological membrane, as it is one of the key parameters for the regulation of morphological and physiological state of living cells. Plasma membranes of tumor cells are known to have significant alterations in their composition, structure, and functional characteristics. Along with dysregulated metabolism of glucose and lipids, these specific membrane properties help tumor cells to adapt to the hostile microenvironment and develop resistance to drug therapies. Here, we demonstrate the use of fluorescence lifetime imaging microscopy (FLIM) to sequentially image cellular metabolism and plasma membrane viscosity in live cancer cell culture. Metabolic assessments are performed by detecting fluorescence of endogenous metabolic cofactors, such as reduced nicotinamide adenine dinucleotide NAD(P)H and oxidized flavins. Viscosity is measured using a fluorescent molecular rotor, a synthetic viscosity-sensitive dye, with a strong fluorescence lifetime dependence on the viscosity of the immediate environment. In combination, these techniques enable us to better understand the links between membrane state and metabolic profile of cancer cells and to visualize the changes induced by chemotherapy.
Introduction
Malignant transformation of cells is accompanied by multiple alterations in their morphological and physiological state. Rapid and uncontrolled growth of cancer cells requires fundamental re-organization of biochemical pathways responsible for energy production and biosynthesis. The characteristic hallmarks of cancer metabolism are enhanced rate of glycolysis, even under the normal oxygen concentrations (the Warburg effect), the use of amino acids, fatty acids, and lactate as alternative fuels, high ROS production in the presence of high antioxidant levels, and increased biosynthesis of fatty acids1,2. It is now appreciated that cancer cell metabolism is highly flexible, which allows them to adapt to the unfavorable and heterogeneous environment and provides an additional survival advantage3.
Altered metabolism supports the specific organization and composition of membranes of tumor cells. The lipid profile of the plasma membrane in cancer cells quantitatively differs from the non-cancerous cells. The main changes in the lipidome are the increased level of phospholipids including phosphatidylinositol, phosphatidylserine, phosphatidylethanolamine and phosphatidylcholine, the decreased level of sphingomyelin, increased amount of cholesterol, and a lower degree of unsaturation of fatty acids, to name a few4,5,6. Therefore, physical properties of the membrane, such as membrane viscosity, the inverse of fluidity, inevitably change. Since viscosity determines the permeability of biological membranes and controls the activity of membrane-associated proteins (enzymes, transporters, receptors), its homeostatic regulation is vital for cell functioning. At the same time, the modification of viscosity through the adjustment of membrane lipid profile is important for cell migration/invasion and survival upon conditional changes.
Fluorescence lifetime imaging microscopy (FLIM) has emerged as a powerful approach for the non-invasive assessment of multiple parameters in living cells, using endogenous fluorescence or exogenous probes7. FLIM is commonly realized on a multiphoton laser scanning microscope, which provides (sub)cellular resolution. Being equipped with the time-correlated single-photon counting (TCSPC) module, it enables time-resolved measurements of fluorescence with high accuracy8.
Probing of cellular metabolism by FLIM is based on the fluorescence measurement of endogenous cofactors of dehydrogenases, the reduced nicotinamide adenine dinucleotide (phosphate) NAD(P)H and oxidized flavins - flavin adenine dinucleotide FAD and flavin mononucleotide FMN, that act as electron carriers in a number of biochemical reactions7,9,10. The detected fluorescence of NAD(P)H is from NADH and its phosphorylated form, NADPH, as they are spectrally almost identical. Typically, fluorescence decays of NAD(P)H and flavins fit to a bi-exponential function. In the case of NAD(P)H, the first component (~0.3-0.5 ns, ~70%-80%) is attributed to its free state, associated with glycolysis, and the second component (~1.2-2.5 ns, ~20%-30%) to its protein-bound state, associated with mitochondrial respiration. In the case of flavins, the short component (~0.3-0.4 ns, ~75%-85%) can be assigned to the quenched state of FAD and the long component (~2.5-2.8 ns, ~15%-25%) to unquenched FAD, FMN, and riboflavin. Alterations in the relative levels of glycolysis, glutaminolysis, oxidative phosphorylation, and fatty acid synthesis result in the changes in the short- and long lifetime fractions of the cofactors. Additionally, the fluorescence intensity ratio of these fluorophores (the redox ratio) reflects the cellular redox status and is also used as a metabolic indicator. Although the redox ratio presents a simpler metric, compared with fluorescence lifetime, in terms of data acquisition, FLIM is advantageous to estimate NAD(P)H and FAD, because fluorescence lifetime is an intrinsic characteristic of the fluorophore and almost not influenced by such factors as excitation power, photobleaching, focusing, light scattering and absorption, especially in tissues, unlike the emission intensity.
One of the convenient ways to map viscosity in living cells and tissues at the microscopic level is based on the use of fluorescent molecular rotors, small synthetic viscosity-sensitive dyes, in which fluorescence parameters strongly depend on the local viscosity11,12. In a viscous medium, the fluorescence lifetime of the rotor increases due to the slowing down of the intramolecular twisting or rotation. Among molecular rotors, the derivatives of boron dipyrromethene (BODIPY) are well suited for sensing viscosity in biological systems as they have a good dynamic range of fluorescence lifetimes in physiological range of viscosities, temperature independence, monoexponential fluorescence decays that allow straightforward data interpretation, sufficient water-solubility and low cytotoxicity13,14. Quantitative assessments of microviscosity using BODIPY-based rotors and FLIM has been previously demonstrated on cancer cell in vitro, multicellular tumor spheroids and mouse tumor in vivo15,16.
Here, we present a detailed description of sequential probing methodologies for studying cellular metabolism and plasma membrane viscosity in cancer cells in vitro by FLIM. To avoid contamination of the relatively weak endogenous fluorescence with the fluorescence of the BODIPY-based rotor, imaging of the same layer of cells is performed sequentially with the fluorescence of NAD(P)H and FAD imaged first. Fluorescence lifetimes of the cofactors are measured in the cytoplasm, and the fluorescence lifetime of the rotor is measured in the plasma membranes of cells by the manual selection of corresponding zones as regions of interest. The protocol was applied to correlate metabolic state and viscosity for different cancer cell lines and to assess the changes after chemotherapy.
The protocol for FLIM sample preparation does not differ from that for confocal fluorescence microscopy. Once data has been acquired, the main task is to extract the fluorescence lifetime from the raw data. The performance of the protocol is demonstrated using HCT116 (human colorectal carcinoma), CT26 (murine colon carcinoma), HeLa (human cervical carcinoma), and huFB (human skin fibroblasts) cells.
Access restricted. Please log in or start a trial to view this content.
Protocol
1. Description of the minimal setup to perform FLIM
- To perform this experiment, ensure the required setup is available: an inverted confocal microscope, a pulsed laser, typically a ps or fs, with the synchronization signal, a fast photon counting detector (time response 150 ps) and photon counting electronics, available output and input ports for the detector and the laser, respectively, on the microscope, the scan clock pulses from the microscope scan controller, the scan head of the microscope with the laser beam combiners and the main dichroic beam splitters suitable for the wavelength of the laser used for FLIM.
- If two-photon excitation is used for FLIM, ensure the microscope contains the NDD port.
- For mammalian cell studies, especially for long-term experiments, ensure having a CO2 incubator maintained at the desired temperature.
NOTE: For the system used in this experiment, see Table of Materials.
2. Preparation of cells for microscopy
- Grow the cells routinely in an incubator at 37 °C with 5% CO2 and a humid atmosphere.
- For microscopy, prepare the cell suspension in a complete culture medium at the concentration of 1 x 10⁶ cells/mL.
NOTE: The cell concentrations and media conditions are cell dependent. The number of cells used for seeding and the incubation time should be adapted to obtain 70%-80% confluence in the microscopic dish. - Seed the cells on glass-bottom 35 mm cell culture dishes (1 x 10⁵ cells in 100 µL per dish) using a 200 µL automatic pipette.
NOTE: Use gridded glass-bottom dishes for the cells seeding to monitor cells in the same microscopic fields of view in dynamics.- During the manual seeding, ensure that the pipette tip does not scratch the bottom or the sides of the dish to avoid damaging the bottom.
- Place the dish in the CO2 incubator (37 °C, 5% CO2, humid atmosphere) and incubate the cells for 24 h.
- After 24 h, remove the dish from the incubator and check the cells' morphology and confluence under the light microscope. If the cells did not reach about 80% confluency, incubate for an additional 24 h.
- Gently remove the old medium from the dish using a 1,000 µL automatic pipette and add 2 mL of DMEM medium without phenol red (e.g., DMEM Life or FluoroBrite).
NOTE: Different culture media can be used for imaging. Avoid phenol red in the medium when using cells for microscopy. - Place the dish in the incubator for 60-120 min to allow for the adaptation of cells.
3. FLIM of metabolic cofactors
- Place the glass-bottom dish with the cells (from step 2.7) on the microscope stage.
- Click on the Locate tab in the laser scanning microscope software (e.g., ZEN - ZEISS Efficient Navigation), and then click on Transmission Light (TL) to switch the light on.
- Find the focal plane of the sample by viewing through the eyepiece on the central slice level of the cells, where a square is maximally occupied by cells (at magnification 40x).
- Click on the OFF button to switch the light off.
- Open the Acquisition tab. To obtain transmission and autofluorescence intensity images of endogenous NAD(P)H, enter the following settings: Excitation wavelength: two-photon mode 750 nm, Registration range: 450-490 nm, Laser power: 5% (~6 mW), Image size: 1024 x 1024 pixels.
NOTE: The choice of the excitation wavelength and registration range is based on the spectral characteristics (maximum excitation and maximum emission) of NAD(P)H17.- Use an oil immersion objective lens С Plan-Apochromat 40x/1.3 NA for the image acquisition.
- Press the Snap button and save the image in ZEN format.
- To obtain the transmission and autofluorescence intensity images of FAD, change the Excitation Wavelength to 900 nm. Set the Registration Range: 500-550 nm, Laser power: 9% (~6 mW), and Image Size: 1024 x 1024 pixels.
NOTE: The choice of the excitation wavelength and registration range is based on the spectral characteristics (maximum excitation and maximum emission) of FAD18.- Use an oil immersion objective lens С Plan-Apochromat 40x/1.3 NA for image acquisition.
- Press the Snap button and save the image in ZEN format.
- For NAD(P)H, set the parameters as described in step 3.5 in the laser scanning microscope software. Change the Image Size to 256 x 256 pixels.
- Enter the following parameters in the menu of SPCM (Single Photon Counting Modules) Operating software of FLIM module: Collection Time: 60 s; TAC Range: 5.00E-8; CFD Limit Low: -29.41; ADC Resolution: 256, Image Size: 256 x 256 pixels.
- Scan the sample for 60 s, stop scanning and save the obtained FLIM image of NAD(P)H.
- Check the obtained FLIM data. For this, Open the raw data in the image software, select a pixel in the cell's cytoplasm by placing the cursor over it and analyze the fluorescence decay in this pixel. Pixel intensities should be ≥3,000 photons per decay curve at binning 1.
NOTE: If the number of photons is below 3,000, increase the laser power or image collection time, while controlling the morphology of cells and photon-counting rate.Typically, if the drop in the count rate exceeds 10% of the initial value, photobleaching takes place. - For FAD, set the parameters as described in step 3.7 in the laser scanning microscope's software. Change the image size to 256 x 256 pixels.
- Enter the following parameters in the menu of SPCM (Single Photon Counting Modules) Operating software of FLIM module: Collection time: 60 s; TAC Range: 5.00E-8; CFD Limit Low: -29.41; ADC Resolution: 256, Image Size: 256 x 256 pixels.
- Scan the sample for 60 s. Stop scanning and save the obtained FLIM image of FAD.
NOTE: The parameters indicated in steps 3.10 and 3.15 are specific for the electronics and the detector used. - Check the obtained data as described in step 3.12.
- Repeat steps 3.5-3.16 to record FLIM images from different fields of view.
4. Staining of cells with the fluorescent molecular rotor
NOTE: The cells are imaged in the fluorescent molecular rotor solution without washing at room temperature (~20 °C) to slow down the internalization of the rotor. Membrane viscosity is temperature dependent, as demonstrated in our previous works19,20. The temperature-controlled stage of the microscope should be switched off in advance, i.e., before the rotor is added to the cells. For our setup, cooling of the stage takes about 10 min.
- Prepare a general stock solution of the fluorescent molecular rotor BODIPY 2 (Stock 1, 25.7 mM).
- Open BODIPY 2 in a sterile environment and weigh approximately 2 mg, using an accurate balance. Carefully place it in a microcentrifuge tube.
- Use an automatic 20 µL pipette to add a 3 µL of a suitable solvent (e.g., DMSO).
- Once the sample dissolves completely in DMSO, add 297 µL of sterile PBS and mix thoroughly using an automatic 200 µL pipette.
NOTE: Store the stock solution in the refrigerator at +4 °C in dark packaging. Once resuspended, it can be stored in the refrigerator for several months.
- Prepare a Stock 2 (8.9 mM) by adding 25 µL of the general stock solution (Stock 1) to a microcentrifuge tube, followed by 48 µL of sterile PBS. Mix gently using an automatic 200 µL pipette.
NOTE: Use stock 2 to prepare the final staining stock, which is applied for cell staining since micromolar concentration is required. - Gently replace the culture media in the dish (from step 3.1) with ice-cold Hank's solution without Ca2+/Mg2+ and incubate cells at +4 °C for 3 min.
NOTE: The use of ice-cold solution and incubation at +4 °C slows down the internalization of the molecular rotor, and local staining of the membrane persists for 20-30 min. - Prepare the final staining solution containing 4.5 µM of BODIPY 2 by adding 1 µL of the Stock 2 to 999 µL ice-cold Hank's solution or PBS.
NOTE: The concentration of BODIPY 2 in the final staining solution can be increased to ~10 µM without any toxic effects on cells, which result in a more efficient staining and greater number of collected photons. At higher concentrations, overloading of FLIM detector may occur. - Aspirate out the Hank's solution from the cell culture dish and replace with ice-cold 4.5 µM solution of BODIPY 2. The cells are imaged in BODIPY 2 solution without washing.
5. FLIM of the fluorescent molecular rotor in cells
NOTE: Always perform FLIM of the fluorescent molecular rotor after FLIM of metabolic cofactors because fluorescence spectrum of BODIPY 2 is overlapped with the emission of endogenous cofactors NAD(Р)H and FAD12,17,18.
- Transfer the dish with the stained cells to the microscope stage (~20 °C) for imaging.
- Set the following parameters for one-photon mode in the laser scanning microscope's software: Excitation at the wavelength of 488 nm with an argon ion laser, Laser power 1%-2%, Registration Range 500-550 nm wavelength.
- Use an oil immersion objective lens С Plan-Apochromat 40x/1.3 NA for image acquisition.
- Press the Live button. Start scanning and using the XY and Z positioning by an integrated motorized stage, adjust the focus and obtain a transmission and fluorescence intensity images of cells in a preview window. Save the obtained images, if required.
- Check on the overlapped transmission and fluorescence image to see whether the fluorescence of the rotor is coming from the expected location (plasma membrane of cell).
- Enter the following parameters in the menu of SPCM software of FLIM module: Collection time: 60 s; TAC Range: 5.00E-8; CFD Limit Low: -29.41; ADC Resolution: 256, Image Size: 256 x 256 pixels.
NOTE: Depending on the system configuration and detectors used for FLIM, the parameters of image acquisition may vary. - Adjust the Ti:Sapphire laser of the microscope to a wavelength of 850 nm and the Laser Power to 1%-2% for two-photon FLIM.
- Select the Continuous tab in the laser scanning microscope software, and then press Start in the SPCM software. Scan the sample for 60 s, stop scanning, and save the obtained FLIM image.
- Check the obtained FLIM data. For this, load the raw data in the FLIM data analysis SPCImage software, select a pixel in the cell's membrane by placing the cursor over it and analyze the fluorescence decay in this pixel. Pixel intensities should be ≥5,000 per decay (possibly including binning) at a reasonable collection time (60-120 s).
- Repeat steps 5.4-5.8 to record FLIM images of cells from different fields of view.
NOTE: FLIM measurements of live cells stained with BODIPY 2 should be limited to ~30 min after adding BODIPY 2.
6. Data analysis
- Fluorescence intensity analysis: redox ratio
- Open images of fluorescence intensity of NAD(P)H and FAD using ImageJ.
- Highlight a cell-free area in the NAD(P)H image using a circle or a square option. Click on Measure, and then click on Subtract (select Process on the main panel, and then Math and Subtract) to subtract the obtained value of the background signal.
- Repeat step 6.1.2 for FAD image.
- Obtain the image of the redox ratio by dividing the FAD fluorescence intensity by NAD(P)H fluorescence intensity. Do this by selecting Process on the main panel, and then select Image Calculator and Divide; check the box Create new window, and then press OK.
- Save the image in TIFF format.
- To calculate the redox ratio, select the region of the cytoplasm in the specific cell on the TIFF image and press the M key. Repeat for all cells of interest.
- Import the measurement to a spreadsheet document.
NOTE: Alternatively, fluorescence intensities of NAD(P)H and FAD in cells can be measured using standard software of the microscope and the redox ratio can be obtained by dividing these values in the spreadsheet software.
- FLIM data analysis: metabolism
- Import FLIM image of NAD(P)H into SPCImage software.
- Apply a bi-exponential decay fit to the image by putting 2 in the Components section.
- Fix the Offset parameter by checking the corresponding box in the SPCImage software.
- Go to Options and select Model. Use Incomplete Multiexponential fitting model and Fit Method MLE.
- Adjust binning to achieve pixel intensities of ≥5000 photons per decay curve.
- Check χ2 value. The χ2≤ 1.20 indicates that the model used provides a reasonable fit.
- Calculate the histogram of fluorescent lifetime in each image by clicking on the top menu Calculate, and then on Decay Matrix.
- Select the area in the cytoplasm of the specific cell as a region of interest.
- Analyze the short and long lifetime components (τ1 and τ2, respectively) and the relative amplitudes of the lifetime components (a1 and a2, where a1 + a2 = 100%) by using the Color option.
- Export the measurements to a spreadsheet software.
- Repeat steps 6.2.8-6.2.10 for each cell of interest.
- Repeat steps 6.2.1-6.2.11 for FAD image.
- FLIM data analysis: viscosity
- Import FLIM image into FLIM data analysis SPCImage software.
- Remove the mark in the Scatter box.
- Put 1 in the Components section, since the rotor fluorescence decay should fit to a monoexponential model.
- Adjust binning to achieve a pixel intensity of ≥5000 photons per decay curve.
- Check the χ2 value in the plasma membrane. A value of χ2≤ 1.20 indicates that the model used provides a reasonable fit. In the case of χ2≥ 1.20, monoexponential approximation is not applicable, such data can indicate the dye aggregation and should be discarded. Aggregation makes it impossible to use the calibration curves and leads in incorrect viscosity estimates.
NOTE: Bi-exponential decays may be indicative of aggregation. On a microscope with FLIM module with variable filters, this can be detected by testing monomer and aggregate-specific emission wavelength ranges, 500-550 nm and 580-650 nm, as described in reference21. - Generate the histogram of the fluorescence lifetime τ for each image by clicking on the top menu Calculate, and then on Decay Matrix.
- Select the region of plasma membrane of individual cell with monoexponential decay, χ2≤ 1.20, using ROI option.
- Export the value of fluorescence lifetime to a spreadsheet software.
- Repeat steps 6.3.7-6.3.8 for each cell of interest.
- Convert experimentally measured lifetimes of BODIPY 2 (in ns) to viscosity values (in cP) using the following equation (previously obtained on the basis of the calibration plot of BODIPY in methanol/glycerol mixtures):
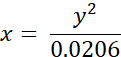
where x - viscosity (in cP), y - fluorescence lifetime τ (in ns).
NOTE: IRF (Instrument Response Function) is an important part of FLIM fitting. In SPCImage IRF is automatically calculated from the rising edge of the fluorescence decay curves. Meanwhile, IRF can be recorded using non-fluorescent sample, e.g., ceramics, or a sample that produces SHG (Second Harmonic Generation) signal, e.g., collagen, urea crystals, or sugar. The use of the recorded IRFs is not recommended if there is an option to calculate it in the software.
Access restricted. Please log in or start a trial to view this content.
Results
Using the protocol described here, we have visualized the metabolic cofactors and microscopic membrane viscosity in live cultured cells using FLIM. The measurements have been done in different cancer cell lines - human colorectal carcinoma HCT116, murine colon carcinoma CT26, human cervical cancer HeLa Kyoto, and human skin fibroblasts huFB.
Fluorescence intensity-based redox ratio FAD/NAD(P)H and fluorescence lifetimes of NAD(P...
Access restricted. Please log in or start a trial to view this content.
Discussion
This protocol illustrates the possibilities of FLIM for multiparametric, functional, and biophysical analysis of cancer cells. The combination of the optical metabolic imaging based on endogenous fluorescence and the measurements of plasma membrane viscosity using exogenous labeling with fluorescent molecular rotor enables us to characterize the interconnections between these two parameters in live cancer cells in a cell culture and follow the changes in response to chemotherapy.
Two-photon ex...
Access restricted. Please log in or start a trial to view this content.
Disclosures
The authors have nothing to disclose.
Acknowledgements
The development of protocol of metabolic imaging was supported by the Ministry of Health of the Russian Federation (Government Assignment, registration No. АААА-А20-120022590098-0). The study of viscosity was supported by the Russian Science Foundation (Project No. 20-14-00111). The authors are thankful to Anton Plekhanov (PRMU) for his help with video production.
Access restricted. Please log in or start a trial to view this content.
Materials
| Name | Company | Catalog Number | Comments |
|---|---|---|---|
| Item/Device | |||
| Cell culture incubator | Sanyo | 37°C, 5% CO2, humidified atmosphere | |
| Centrifuge 5702 R | Eppendorf | 5703000010 | |
| imageJ 1.53c | Wayne Rasband (NIH) | ||
| FLIM module Simple Tau 152 TCSPC (in LSM 880) | Becker & Hickl GmbH | ||
| Laminar flow hood | ThermoFisher Scientific | ||
| Leica microscope DFC290 | Leica Microsystems | ||
| LSM 880 confocal microscope | Carl Zeiss | ||
| Ti:Sapphire femtosecond laser Mai Tai | Spectra Physics | ||
| Microscope incubator XLmulti S DARK LS | PeCon GmbH | 273-800 050 | |
| Mechanical pipettor | Sartorius mLINE | volume 0.5-10 μL; 20-200 μL; 100-1000 μL | |
| Oil-immersion objective C-Apochromat 40×/1.2 NA W Korr (in LSM 880) | Carl Zeiss | 421767-9971-790 | |
| Power-Tau 152 module with the detector HPM-100-40 | Becker&Hickl GmbH | ||
| SPCImage software | Becker & Hickl GmbH | SPC 9.8; SPCImage 8.3 | |
| ZEN software | Carl Zeiss | ZEN 2.1 SP3 (black), Version 14.0.0.201 | |
| Reagent/Material | |||
| 5-fluorouracil | Medac GmbH | 3728044 | |
| DMEM | Gibco, Life Technologies | 31885023 | |
| DMSO | PanEco | F135 | |
| FBS | Hyclone | A3160801 | |
| FluoroBright DMEM | Gibco, Life Technologies | A1896701 | |
| Hank’s solution without Ca2+/Mg2+ | Gibco, Life Technologies | 14175 | |
| l-Glutamine | PanEco | F032 | |
| Mammalian cells | HCT116, CT26, HeLa Kyoto, huFB | ||
| Molecular rotor BODIPY 2 | Synthesized and Supplied by Marina Kuimova Group, Imperial College London | ||
| Penicillin/streptomycin | PanEco | A065 | |
| Tissue culture dish with cover glass-bottom FluoroDishes | World Precision Instruments, Inc | ||
| Trypsin- EDTA 0.25% | PanEco | P034 | |
| Versen buffer | PanEco | R080p |
References
- Vazquez, A., et al. Cancer metabolism at a glance. Journal of Cell Science. 129 (18), 3367-3373 (2016).
- Li, Z., Zhang, H. Reprogramming of glucose, fatty acid, and amino acid metabolism for cancer progression. Cellular and Molecular Life Sciences. 73 (2), 377-392 (2015).
- Strickaert, A., et al. Cancer heterogeneity is not compatible with one unique cancer cell metabolic map. Oncogene. 36 (19), 2637-2642 (2016).
- Szlasa, W., Zendran, I., Zalesińska, A., Tarek, M., Kulbacka, J. Lipid composition of the cancer cell membrane. Journal of Bioenergetics and Biomembranes. 52, 321-342 (2020).
- Preta, G. New insights into targeting membrane lipids for cancer therapy. Frontiers in Cell and Developmental Biology. 8, 571237(2020).
- Kojima, K. Molecular aspects of the plasma membrane in tumor cells. Nagoya Journal of Medical Science. 56, 1-18 (1993).
- Datta, R., Heaster, T. M., Sharick, J. T., Gillette, A. A., Skala, M. C. Fluorescence lifetime imaging microscopy: fundamentals and advances in instrumentation, analysis, and applications. Journal of Biomedical Optics. 25 (7), 071203(2020).
- Becker, W. Advanced time-correlated single photon counting applications. Springer Series in Chemical Physics. , Springer. (2015).
- Shirmanova, M. V., Shcheslavskiy, V. I., Lukina, M. M., Becker, W., Zagaynova, E. V. Exploring tumor metabolism with time-resolved fluorescence methods: From single cells to a whole tumor. Multimodal Optical Diagnostics of Cancer. 3, 133-155 (2020).
- Kalinina, S., Rück, A. FLIM and PLIM in biomedical research. An innovative way to combine autofluorescence and oxygen measurements. Photonics & Lasers in Medicine. 5 (4), 257-266 (2016).
- Kuimova, M. K. Molecular rotors image intracellular viscosity. Chimia. 66 (4), 159-165 (2012).
- Kuimova, M. K. Mapping viscosity in cells using molecular rotors. Physical Chemistry Chemical Physics. 14 (37), 12671(2012).
- Haidekker, M. A., Theodorakis, E. A. Molecular rotors-fluorescent biosensors for viscosity and flow. Organic & Biomolecular Chemistry. 5, 1669-1678 (2007).
- Liu, X., et al. Molecular mechanism of viscosity sensitivity in BODIPY rotors and application to motion-based fluorescent sensors. ACS Sensors. 5 (3), 731-739 (2020).
- Shirmanova, M. V., Shimolina, L. E., Lukina, M. M., Zagaynova, E. V., Kuimova, M. K. Live cell imaging of viscosity in 3D tumour cell models. Multi-Parametric Live Cell Microscopy of 3D Tissue Models. Advances in Experimental Medicine and Biology. Dmitriev, R. 1035, 143-153 (2017).
- Shimolina, L. E., et al. Imaging tumor microscopic viscosity in vivo using molecular rotors. Scientific Reports. 7, 41097(2017).
- Scott, T. G., Spencer, R. D., Leonard, N. J., Weber, G. Synthetic spectroscopic models related to coenzymes and base pairs. V. Emission properties of NADH. Studies of fluorescence lifetimes and quantum efficiencies of NADH, AcPyADH, [reduced acetylpyridineadenine dinucleotide] and simplified synthetic models. Journal of the American Chemical Society. 92 (3), 687-695 (1970).
- Harvey, R. A., Damle, S. A fluorescent modification of flavin adenine dinucleotide. FEBS Letters. 26 (1-2), 341-343 (1972).
- Kubánková, M., Summers, P., López-Duarte, I., Kiryushko, D., Kuimova, M. K. Microscopic viscosity of neuronal plasma membranes measured using fluorescent molecular rotors: Effects of oxidative stress and neuroprotection. ACS Applied Materials and Interfaces. 11, 36307-36315 (2019).
- Kubánková, M., López-Duarte, I., Kiryushko, D., Kuimova, M. K. Molecular rotors report on changes in live cell plasma membrane microviscosity upon interaction with beta-amyloid aggregates. Soft Matter. 14, 9466-9474 (2018).
- Wu, Y., et al. Molecular rheometry: Direct determination of viscosity in Lo and Ld lipid phases via fluorescence lifetime imaging. Physical Chemistry Chemical Physics. 15 (36), 14986(2013).
- Shimolina, L. E., et al. Mapping cisplatin-induced viscosity alterations in cancer cells using molecular rotor and fluorescence lifetime imaging microscopy. Journal of Biomedical Optics. 25 (12), 126004(2020).
- Berezin, M. Y., Achilefu, S. Fluorescence lifetime measurements and biological imaging. Chemical Reviews. 110 (5), 2641-2684 (2010).
- Skala, M. C., et al. In vivo multiphoton fluorescence lifetime imaging of protein-bound and free nicotinamide adenine dinucleotide in normal and precancerous epithelia. Journal of Biomedical Optics. 12 (2), 024014(2007).
- Rück, A., Hauser, C., Mosch, S., Kalinina, S. Spectrally resolved fluorescence lifetime imaging to investigate cell metabolism in malignant and nonmalignant oral mucosa cells. Journal of Biomedical Optics. 19 (9), 096005(2014).
- Lee, D. -H., Li, X., Ma, N., Digman, M. A., Lee, A. P. Rapid and label-free identification of single leukemia cells from blood in a high-density microfluidic trapping array by fluorescence lifetime imaging microscopy. Lab on a Chip. 18 (9), 1349-1358 (2018).
- Lukina, M. M., et al. Interrogation of tumor metabolism in tissue samples ex vivo using fluorescence lifetime imaging of NAD(P)H. Methods and Applications in Fluorescence. 8 (1), 014002(2019).
- Alam, S. R., et al. Investigation of mitochondrial metabolic response to doxorubicin in prostate cancer cells: An NADH, FAD and Tryptophan FLIM assay. Scientific Reports. 7 (1), 10451(2017).
- Walsh, A. J., et al. Quantitative optical imaging of primary tumor organoid metabolism predicts drug response in breast cancer. Cancer Research. 74 (18), 5184-5194 (2014).
- Lukina, M. M., et al. In vivo metabolic and SHG imaging for monitoring of tumor response to chemotherapy. Cytometry Part A. 95 (1), 47-55 (2019).
- Shah, A. T., et al. Optical metabolic imaging of treatment response in human head and neck squamous cell carcinoma. PLoS One. 9 (3), 90746(2014).
- Sergeeva, T. F., et al. Relationship between intracellular pH, metabolic co-factors, and caspase-3 activation in cancer cells during apoptosis. Biochimica et Biophysica Acta (BBA) - Molecular Cell Research. 1864 (3), 604-611 (2017).
- Shirmanova, M. V., et al. Chemotherapy with cisplatin: insights into intracellular pH and metabolic landscape of cancer cells in vitro and in vivo. Scientific Reports. 7, 8911(2017).
- Lukina, M. M., et al. Metabolic cofactors NAD(P)H and FAD as potential indicators of cancer cell response to chemotherapy with paclitaxel. Biochimica et Biophysica Acta (BBA) - General Subjects. 1862 (8), 1693-1700 (2018).
- Druzhkova, I. N., et al. The metabolic interaction of cancer cells and fibroblasts - coupling between NAD(P)H and FAD, intracellular pH and hydrogen peroxide. Cell Cycle. 15 (9), 1257-1266 (2016).
- Lakowicz, J., Szmacinski, H., Nowaczyk, K., Johnson, M. Fluorescence lifetime imaging of free and protein bound NADH. Proceedings of the National Academy of Sciences of the United States of America. 89 (4), 1271-1275 (1992).
- Vanden Berg, P. A. W., Feenstra, K. A., Mark, A. E., Berendsen, H. J. C., Visser, A. J. W. G. Dynamic conformations of flavin adenine dinucleotide: Simulated molecular dynamics of the flavin cofactor related to the time-resolved fluorescence characteristics. The Journal of Physical Chemistry B. 106 (34), 8858-8869 (2002).
- Liu, Z., et al. Mapping metabolic changes by noninvasive, multiparametric, high-resolution imaging using endogenous contrast. Science Advances. 4 (3), (2018).
- Blacker, T. S., et al. Separating NADH and NADPH fluorescence in live cells and tissues using FLIM. Nature Communications. 5, 3936(2014).
- Lu, W., Wang, L., Chen, L., Hui, S., Rabinowitz, J. D. Extraction and quantitation of nicotinamide adenine dinucleotide redox cofactors. Antioxidants and Redox Signaling. 28 (3), 167-179 (2018).
- Ranjit, S., Malacrida, L., Jameson, D. M., Gratton, E. Fit-free analysis of fluorescence lifetime imaging data using the phasor approach. Nature Protocols. 13 (9), 1979-2004 (2018).
- Stringari, C., et al. Phasor approach to fluorescence lifetime microscopy distinguishes different metabolic states of germ cells in a live tissue. Proceedings of the National Academy of Sciences of the United States of America. 108 (33), 13582-13587 (2011).
- Smith, J. T., et al. Fast fit-free analysis of fluorescence lifetime imaging via deep learning. Proceedings of the National Academy of Sciences of the United States of America. 116 (48), 24019-24030 (2019).
- Wang, S., Chacko, J. V., Sagar, A. K., Eliceiri, K. W., Yuan, M. Nonparametric empirical Bayesian framework for fluorescence-lifetime imaging microscopy. Biomedical Optics Express. 10 (11), 5497-5517 (2019).
- Quinn, K. P., et al. Quantitative metabolic imaging using endogenous fluorescence to detect stem cell differentiation. Scientific Reports. 3 (1), 3432(2013).
- Hou, J., et al. Correlating two-photon excited fluorescence imaging of breast cancer cellular redox state with seahorse flux analysis of normalized cellular oxygen consumption. Journal of Biomedical Optics. 21 (6), 060503(2016).
- Wang, H., et al. Red-emitting fluorescence probe for sensing viscosity in living cells. Chemical Papers. 74, 1071-1078 (2020).
- Chen, B., et al. Sensing and imaging of mitochondrial viscosity in living cells by a red photoluminescent probe with long lifetime. Chemical Communications. 55, 7410(2019).
- Shen, B., Wang, L. F., Zhi, X., Qian, Y. Construction of a red emission BODIPY-based probe for tracing lysosomal viscosity changes in culture cells. Sensors and Actuators B: Chemical. 304, 127271(2019).
- Chen, T., Chen, Z., Liu, R., Zheng, S. NIR fluorescent probe for detection of viscosity and lysosome imaging in live cells. Organic and Biomolecular Chemistry. 17, 6398(2019).
- Angelucci, C., et al. Epithelial-stromal interactions in human breast cancer: effects on adhesion, plasma membrane fluidity and migration speed and directness. PLoS One. 7 (12), 50804(2012).
Access restricted. Please log in or start a trial to view this content.
Reprints and Permissions
This article has been published
Video Coming Soon