This protocol quantifies callose in plant tissues using the callose-specific method, immunofluorescence spectrophotometry/ELISA, which is based on the binding of callose in the plant samples to callose-specific antibodies followed by quantification of bound callose through enzyme-labeled detection antibodies by measuring the resulting enzymatic activity.
Method Article
Quantification of Callose in Plant Tissues by Enzyme-Linked Immunosorbent Assay/ Immunofluorescence Spectrophotometry
In This Article
Summary
Abstract
The existing methods of callose quantification from plant tissues include epifluorescence microscopy, fluorescence spectrophotometry, immunofluorescence microscopy, and indirect assessment of both callose synthase and β-(1,3)-glucanase activities. However, some of these methods have significant limitations, which include being time-consuming, non-specific to callose, labor-intensive, subjective, high autofluorescence, low sensitivity, being more qualitative rather than quantitative, and requiring the acquisition of software resources and technical skills. Therefore, there is a pressing need to explore alternative methods for callose quantification in plant tissues. It was hypothesized that immunofluorescence spectrophotometry or enzyme-linked immunosorbent assay (ELISA) that uses callose-specific antibodies could overcome some of the limitations of the current callose quantification methods. Biotic stress was administered by inoculating tissue culture-derived banana plantlets with Xanthomonas vasicola pv. musacearum (Xvm) bacteria which induced callose production. Banana corm tissue samples were collected at 14 days post-inoculation (dpi) for callose quantification using the new immunofluorescence spectrophotometry method. Callose production in the corms of Xvm-inoculated and control groups varied significantly in both the banana genotypes (independent sample t-test, p < 0.05). The immunofluorescence spectrophotometry method described here could be applied for the quantification of callose in different plant tissues with high specificity to callose, sensitivity, reliability, and reproducibility. Additionally, the use of a 96-well plate makes this method suitable for high throughput callose quantification studies with minimal sampling and analysis biases.
Introduction
Callose is a polysaccharide of β-1,3-glucan which is a naturally occurring compound found in the cell walls of a variety of higher plants. Callose is synthesized by callose synthases (CalS) and degraded by β-(1,3)-glucanases1,2,3. It is involved in several biological processes, including growth and development and response to abiotic and biotic stresses4,5,6. During pathogen infection, the increase in callose deposition in the papillae helps to prevent further microbial colonization, acting as a permeability barrier between the neighboring plant cells2,4,7,8,9,10,11,12. By slowing down pathogen invasion in the attacked tissue, callose deposition allows time for the induction of additional defense responses13. Accurate spatiotemporal quantification of callose in the plant tissues is essential for understanding its role in the various physiological processes. However, the current methods of callose quantification from plant tissues, which include epifluorescence microscopy, immunofluorescence microscopy, and fluorescence spectrophotometry, possess significant limitations and quantification challenges. Therefore, there is a pressing need to explore alternative methods for callose quantification to overcome these drawbacks. It was hypothesized that immunofluorescence spectrophotometry or enzyme-linked immunosorbent assay (ELISA) could offer a more efficient method of callose quantification in plant samples, which includes high specificity, sensitivity, reliability, reproducibility and offers a high-throughput method.
The gold standard method for callose quantification involves imaging of aniline blue-stained callose particles by epifluorescence microscopy14,15,16,17. The aniline blue-stained callose when exposed to blue or UV light excitation appears as yellow fluorescent particles, which can either be manually counted for the number of fluorescing callose particles14,15 or counted by automated callose counting software. Manual counting of callose particles is laborious, time-consuming, and subjective to the researcher18, whereas automated counting requires acquiring software resources and a considerable technical skills. Some of the software used for automated callose counting include ImageJ19,20,21,22, photoshop23, CalloseMeasurer24, Icy18,25 and Ilastik26. The aniline blue-stained callose may also be quantified using fluorescence spectrophotometry17,19,27,28,29. However, the high background/autofluorescence associated with epifluorescence microscopy and fluorescence spectrophotometry make these methods difficult and unreliable due to low signal to noise ratio26. Moreover, aniline blue can stain other β-1,3-glucans besides callose30, making both epifluorescence microscopy and fluorescence spectrophotometry methods of callose detection and quantification partially non-specific and unreliable. A method of immunofluorescence microscopy for callose quantification which is based on callose-specific antibodies has also been used in several studies31,32,33. Although this method shares a few disadvantages with epifluorescence microscopy of aniline blue-stained callose, it has the advantage of being callose-specific due to the antibodies used here. Callose quantification has also been performed using enzyme activity-based methods. Enzyme activity-based methods for callose quantification include assessment of callose synthase (CalS)20,33 and β-(1,3)-glucanase activities34,35. The enzyme activity-based methods have several disadvantages as compared to epifluorescence microscopy, immunofluorescence microscopy and fluorescence spectrophotometry. These include indirect estimation of callose, the difficulty of enzyme extraction and enzyme activity assays, and lack of even distribution of callose in the plant tissues.
Due to the disadvantages of the current methods of callose quantification which include epifluorescence microscopy, immunofluorescence microscopy, fluorescence spectrophotometry, CalS and β-(1,3)-glucanase assays, there was need to come up with a new method of callose quantification that would offer a number of advantages which include, 1) high specificity, sensitivity, reliability and reproducibility, and 2) easier callose quantification with high-throughput ability. The use of immunofluorescence spectrophotometry for callose quantification has not been explored. Here, a new method of callose quantification based on immunofluorescence spectrophotometry, more specifically, Enzyme-Linked Immunosorbent Assay (ELISA), is reported. The method can be optimized for the quantification of callose in different plants or their tissues with a good degree of specificity to callose, precision, reproducibility, and a high-throughput experimental capability. This method can also be modified to quantify any plant-based analyte if the antibody against that analyte is available. To ensure accurate, efficient, and reliable spatiotemporal distribution of callose in plant tissues, it is recommended that different methods of callose quantification are used simultaneously which include the microscopy, spectrophotometry and enzyme activity-based methods. Consequently, this will accurately and efficiently allow the understanding of the role of callose in various physiological and stress responses.
Protocol
1. Inoculation of experimental plants
- Isolate, prepare and confirm the Xvm inoculum using standard procedures36,37. Randomly select 10, 2-month-old tissue-culture-derived Musa balbisiana and Mbwazirume plants and inoculate the dorsal side of the youngest, fully open leaf petiole with 200 µL (1 x 10⁸ cells) of the PCR-confirmed Xvm inoculum (Figure 1)38.
- Similarly, randomly select 10 Musa balbisiana and Mbwazirume banana plantlets and inoculate them with 200 µL of sterile distilled water (SDW).
- Maintain the Xvm-inoculated and control banana plants under similar conditions in the screenhouse with a 12 h light/12 h dark photoperiod at 25 °C, watering them every 3 days.
NOTE: Refer to Table of Materials and Table 1 for the list of materials and equipment and recipe for buffers, respectively.
2. Sampling of corm tissues and sample preparation
- Perform destructive sampling to obtain corm samples from the experimental plants (Figure 1).
- Quickly excise approximately 2 g of the corm samples using sterile surgical blades at 14 days post-inoculation (dpi) and place them individually into labeled 50 mL tubes. Do this for all the 10 samples each collected from the Xvm-inoculated plants and the control plants.
- Immediately immerse the 50 mL tubes containing the samples into liquid nitrogen.
- Transport the samples to the laboratory and store them at -80 °C until ready to proceed. Store samples at −80 °C for up to 1 year or longer with minimal freeze-thaw cycles.
- Freeze-dry the samples for 72 h using a freeze-drier (Figure 1).
- Place exactly 30 mg of the freeze-dried samples into 2 mL tubes containing 2 steel bicycle beads and pulverize them into fine powder, with the speed set at 5 for 1 min (Figure 1).
- Store the pulverized samples in a cool dry environment at room temperature, well-sealed until ready to proceed. Store the pulverized samples at room temperature for up to 4 months or at −80 °C for up to 1 year with minimal freeze-thaw cycles39,40.
3. Extraction of callose and preparation of laminarin standards and blank
- To extract callose from the 30 mg of the pulverized corm sample, add 800 µL of 1 M NaOH and incubate for 30 min at 80 °C in a water bath, with occasional vortexing after every 10 min27,41 (Figure 1, Step 6).
- Allow the samples to cool to room temperature (approximately 5 min) and then centrifuge at 15,294 x g for 5 min.
- Transfer the supernatant (callose extract) to a sterile 2 mL tube and dilute with the blocking buffer (Table 1) at a ratio of 1:2.
NOTE: Choose the dilution factor based on preliminary experimentation and optimization. Dilution of the callose extract may or may not be necessary. When needed, dilution should be performed in the blocking buffer and the dilution ratio optimized for different sample types to fall within the range of the standard curve. - Store the callose extracts at -20 °C until you are ready to proceed. Store the callose extract for up to 6 months with minimal freeze-thaw cycles.
- Prepare a concentrated stock of laminarin standard at 100 mg/mL in 1 M NaOH6,42,43,44,45.
NOTE: Laminarin is a 1-3-β-glucan polymer and can be used as standard for callose equivalents in immunofluorescence spectrophotometry. - Incubate the resulting suspension of the standard at 80 °C in a water bath, gently shaking it at intervals, until all the laminarin is completely dissolved (approximately 20-40 min).
- Cool the dissolved standard to room temperature (approximately 10 min).
- Prepare laminarin standards at concentrations of 80 mg/mL, 60 mg/mL, 40 mg/mL, 20 mg/mL, 10 mg/mL, 1 mg/mL, 0.5 mg/mL, 0.1 mg/mL, and 0.01 mg/mL using the blocking buffer, starting from the concentrated stock of 100 mg/mL.
- Prepare the blanks by mixing 1 M NaOH and the blocking buffer at a ratio of 1:2. If dilution is required, use the same dilution ratio used to prepare the callose extract.
- Store the laminarin standards and the blanks at −20 °C. Store standards and blanks for up to 6 months with minimal freeze-thaw cycles.
4. Callose quantification by the immunofluorescence spectrophotometry
- Add 100 µL of the primary antibody (1-3-β-glucan-directed mouse IgG) prepared using the coating buffer (Table 1) to each of the 96 wells of the polystyrene ELISA plates (Figure 2).
- Seal the plate tightly with paraffin film and incubate it overnight at 4 °C in a refrigerator.
- The next day, place the plate on the bench and allow it to reach room temperature (approximately 10 min).
- Wash the plate using standard blotting and washing procedures46. Briefly, add 200 µL of the wash buffer (Table 1) to the wells, vortex it at 500 rpm for 30 s using a digital shaker and blot on tissue paper. Repeat this washing process 2x (Figure 2). Ensure the wells do not dry completely and use a sterile micropipette tip to remove any bubbles in the wells without touching the base and walls of the wells.
- Add 200 µL of the blocking buffer to each of the wells (Figure 2) and seal the plate tightly with paraffin film. Incubate it for 4 h at 37 °C. Wash the plate as mentioned above (Figure 2).
- Add 100 µL of the callose extract from the 10 Xvm-inoculated and 10 control plants to the designated wells. Add 100 µL of the laminarin standards to other wells. Add 100 µL of the blank to other wells (Figure 2).
- Seal the plate tightly with paraffin film and incubate overnight at 4 °C in a refrigerator. Wash the plate again as mentioned above (Figure 2).
- Add 100 µL of the primary antibody (1-3-β-glucan-directed mouse IgG) prepared using the blocking buffer to each of the wells (Figure 2).
- Seal the plate tightly with paraffin film and incubate for 4 h at 37 °C, then wash the plate as indicated above (Figure 2).
- Add 100 µL of anti-Mouse IgG-Alkaline phosphatase secondary antibody to each well46,47 (Figure 2).
- Seal the plate tightly with paraffin film and incubated overnight at 4 °C in a refrigerator. Then, wash the plate as indicated above (Figure 2).
- Add 100 µL of freshly prepared para-nitrophenyl phosphate (pNPP) solution at a concentration of 1 mg/mL (Table 1) to the wells (Figure 2)
- Incubate the plate on the bench at room temperature for 30 min48.
NOTE: The incubation time may vary depending on the plant samples and standard used. In this study, laminarin had the best reading at 30 min. - Terminate the reaction by adding 100 µL of freshly prepared stop solution (0.5 M NaOH) to each of the wells48 (Figure 2).
- Transfer the plate to a microplate reader (equilibrated to 37 °C), shake it at medium speed for 1 min, and read the absorbances at 405 nm48 (Figure 1, Figure 2).
5. Data analysis
- Perform a simple linear regression of laminarin absorbance at 405 nm against laminarin concentration (µg/mL) to obtain the standard curve. The equation of the standard curve is
Y = β1X + β0
where Y represents laminarin absorbance at 405 nm, β1 is the slope of the regression line (Pearson correlation coefficient), X is Log10 (laminarin concentration in µg/mL) and β0 is the y-intercept. - Calculate callose concentrations in the corm samples by subtracting the absorbance of the blank from the absorbance of the samples. Then use the standard curve to estimate the callose concentration in µg/mL as laminarin equivalent (LE).
- Examine all data for normality of distribution using the Shapiro-Wilk test and check for homoscedasticity of variances using the Levene's test (α > 0.05).
- Utilize the independent sample t-test to compare the callose production between the Xvm-inoculated and control groups (p≤ 0.05).
Results
The known concentrations of the laminarin standards were analyzed through spectrophotometry and their corresponding absorbance values were recorded. Using this data, a Beer-Lambert plot was constructed by plotting the concentrations of the laminarin standards on the x-axis and the absorbance on the y-axis. The equation of the regression line was y = 0.5079x − 0.04534 (Figure 3)49. The Beer-Lambert plot gave a high correlation coefficient (r) of 0.9988 and coefficient of determination (r2) of 0.9975 indicating a strong linear relationship between concentration and absorbance and up to 0.9975 of the variance in the dependent variable (absorbance) was explained by the independent variable (concentration; Figure 3; p<0.0001). Therefore, this model was a good fit, accurate and reliable for predicting the concentration of laminarin and callose. The concentration of callose in the banana corm samples were determined by measuring absorbance of the corm samples through spectrophotometry and using the absorbance values to calculate the callose concentrations using the equation.
The immunofluorescence spectrophotometry assay showed significant increase in induced callose in Xvm-inoculated plants as compared to the control group in both the banana genotypes (independent sample t-test, p < 0.05; Figure 4). Callose production in the control plants at 14 dpi was 1474.34 mg/mL and 1037.11 mg/mL for Mbwazirume and M. balbisiana, respectively (Figure 4). Inoculation of the plants with Xvm resulted in 4190.78 mg/mL and 1996.07 mg/mL of callose in the corms of Xvm-inoculated Mbwazirume and M. balbisiana plantlets at 14 dpi, respectively (Figure 4). Xvm inoculation caused a 1.9-fold to 2.8-fold higher callose production as compared to the control plants (independent sample t-test, p < 0.001; Figure 4).
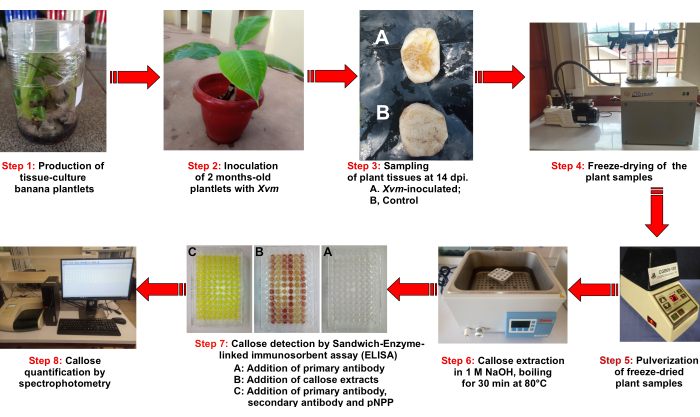
Figure 1: Schematic illustration of the major steps involved in callose quantification by the new immunofluorescence spectrophotometry method. This figure demonstrates the major steps involved in callose quantification from banana tissues which include raising of the tissue culture derived plantlets, inoculation with Xvm, destructive sampling of the corm tissues, freeze-drying of the samples, extraction of callose and quantification of callose by the new immunofluorescence spectrophotometry method. This figure has been reprinted50. Please click here to view a larger version of this figure.
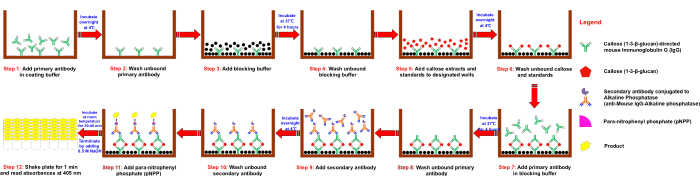
Figure 2: Detailed schematic illustration of immunofluorescence spectrophotometry method for callose quantification. This figure gives a detailed demonstration of the immunofluorescence spectrophotometry method for callose quantification showing how the ELISA plate is loaded with the various components and how callose is finally quantified by spectrophotometry. This figure has been reprinted50. Please click here to view a larger version of this figure.
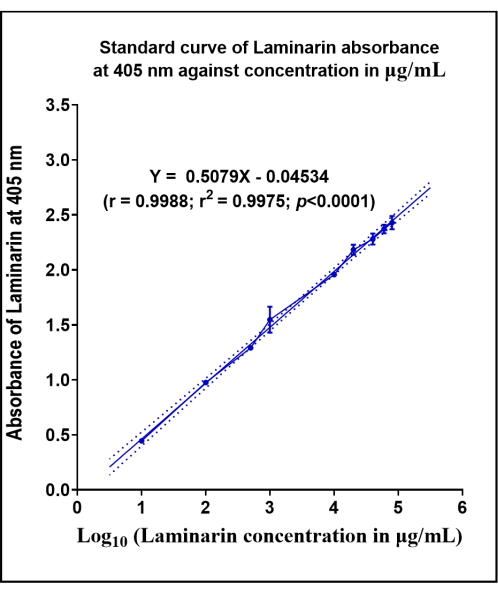
Figure 3: Protein quantification. The Beer-Lambert plot based on laminarin standards of known concentrations and absorbance readings (at 405 nm) used for calculation of callose concentrations (as laminarin equivalents, LE) from absorbance readings of the corm samples. This figure has been reprinted49. Please click here to view a larger version of this figure.
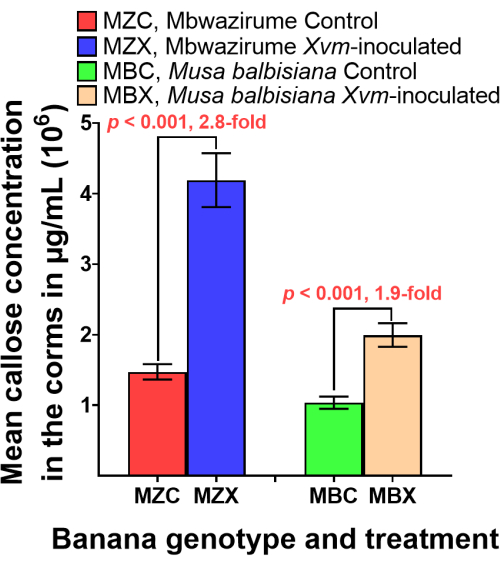
Figure 4: Comparison of callose concentration. Comparison of mean callose concentrations (mean ± SEM, n = 9) in the corms of M. balbisiana and Mbwazirume banana plantlets inoculated with Xvm as determined by the new immunofluorescence spectrophotometry method (independent sample t-test, α ≤ 0.05) Please click here to view a larger version of this figure.
| Buffer | Composition | Storage | ||
| Blocking buffer | 10 g of bovine serum albumin (BSA; 1% w/v), dissolved in 1 L of PBS. | -20 °C for up to 6 months | ||
| Coating buffer | 1.59 g of sodium carbonate (Na2CO3), 2.93 g of sodium bicarbonate (NaHCO3), 0.2 g of sodium azide (NaN3), dissolve in 1 L of deionised H2O, pH 9.6. | -20 °C for up to 12 months | ||
| Conjugate buffer | 2 g of PVP (2% w/v), dissolved in 1 L of blocking buffer. | -20 °C for up to 6 months | ||
| Para-nitrophenyl phosphate (pNPP) solution | Dissolve para-nitrophenyl phosphate (pNPP) in substrate buffer to a working concentration of 1 mg/mL | -20 °C for up to 12 months | ||
| Phosphate-buffered saline (PBS) | 8.0 g of sodium chloride (NaCl), 0.2 g of monobasic potassium phosphate (KH2PO4), 1.15 g of dibasic sodium phosphate (Na2HPO4), 0.2 g of potassium chloride (KCl), 0.2 g of sodium azide (NaN3), dissolved in 1 L of deionised H2O, pH 7.4. | -20 °C for up to 12 months | ||
| Primary antibody in blocking buffer | Reconstitute the lyophilized primary antibody according to manufacturer’s instruction to obtain the concentrated stock. Dilute the obtained reconstituted primary antibody stock in blocking buffer to a working concentration of 2 μg/mL. | -20 °C for up to 6 months | ||
| Primary antibody in coating buffer | Reconstitute the lyophilized primary antibody according to manufacturer’s instruction to obtain the concentrated stock. Dilute the obtained reconstituted primary antibody stock in coating buffer to a working concentration of 2 μg/mL. | -20 °C for up to 6 months | ||
| Secondary antibody | 1:1000 of secondary antibody concentrate: conjugate buffer | -20 °C for up to 6 months | ||
| Substrate buffer | 97 mL of diethanolamine, 0.2 g of sodium azide (NaN3), dissolve in 1 L of deionised H2O, pH 9.8 | -20 °C for up to 12 months | ||
| Wash buffer | 0.5 mL of Tween 20 (0.05% v/v), dissolved in 1 L of PBS, pH 7.5 | -20 °C for up to 12 months | ||
Table 1: Recipe for buffers.
Discussion
The immunofluorescence spectrophotometry method was applied for the first time in quantification of callose in banana corms. It is based on enzyme immunoassay (EIA), used to quantify callose in the crude 1 M NaOH extract of banana using callose-specific antibodies47,51,52. In brief, this new immunofluorescence spectrophotometry-based, callose-specific quantification assay involved coating of the microplate with callose-specific antibody which then binds to callose in the plant extract, followed by a secondary antibody also specific to callose. The detection of an antibody that is linked to an enzyme (alkaline phosphatase) is then added and forms a complex with the secondary antibody. A substrate, para-nitrophenyl phosphate (pNPP), is then added. The quantification of callose in the sample relies on the ability of alkaline phosphatase to cleave the phosphate groups from pNPP molecules, resulting in the formation of a yellow-colored compound (p-nitrophenol). The detection of the intensity of the yellow color was done using a spectrophotometer at 405 nm and the absorbance was then correlated to alkaline phosphatase activity, which was directly proportional to callose concentration present in the sample. The reaction was stopped by increasing the pH through addition of 0.5 M NaOH, which prevented further alkaline phosphatase activity.
In contrast, the standard-gold method for callose localization and quantification is the epifluorescence microscopy method, a well-established method based on staining callose with aniline blue fluorochrome53. In brief, this method is based on the specific binding of aniline blue dye to beta-1,3-glucans (callose) forming a complex. The aniline blue in this complex is then excited using the ultraviolet light (wavelength of 365-375 nm). When the aniline blue dye is excited, it emits blue fluorescence that is captured to allow specific visualization of callose in plant tissues53. Quantification of aniline blue-stained callose follows a series of imaging techniques that quantify the amount of fluorescence coming from the plant tissues. The fluorescence is proportional to the amount of callose available in the plant tissues. Epifluorescence microscopy has been used in visualization and quantification of callose in biotic stress54.
In a separate study, callose deposition was determined using both epifluorescence microscopy and immunofluorescence spectrophotometry49. While a few differences were observed in the data, statistical analysis largely showed congruence of epifluorescence microscopy and immunofluorescence spectrophotometry data, indicating consistency in the two methods of callose detection49. Whereas results from the two methods were largely congruent, it is advisable that both epifluorescence microscopy and immunofluorescence spectrophotometry should complement each other for more reliable assessment. Even though the ELISA-based method is callose-specific, sensitive, and reliable, it is initially time-consuming during optimization of the protocol and getting a best-fit standard curve that fits all the concentrations and absorbances.
Some of the methods for callose quantification are laborious17,32,55, time consuming26,56, not callose-specific since aniline blue can stain other β-1,3-glucans besides callose30, require expensive and sophisticated callose counting software23,24,26, require considerate amount of technical skills and the high background/autofluorescence associated with fluorescence spectrophotometry makes callose quantification difficult and unreliable26. Callose quantification methods based on automated image analysis workflow such as ImageJ software requires appropriate training of the image analysis plug-in such as the Trainable Weka Segmentation (TWS) for ImageJ and this is very cumbersome57.
Immunofluorescence spectrophotometry-based assays are highly preferred due to their specificity, sensitivity, ease of use, and reproducibility. However, it is important to note that the detection system and its sensitivity may vary depending on the specific assay protocol and the equipment used.
Here, a new method of callose quantification based on immunofluorescence spectrophotometry is described. The method described here could be applied for the quantification of callose in different plant tissues and species with satisfactory level of specificity to callose, high precision and reproducibility. This method is an addition to the various callose quantification methods and can be used to monitor changes in callose levels during growth and development in plants and in response to various stimuli or treatments. Moreover, use of 96-well plate reduces subjective sampling and analysis making the method suitable for high throughput callose quantification. It is noteworthy that although callose may be easily extracted from freshly harvested plant tissues17,27,55, the sample preparation step involving freeze-drying included as per this new protocol provides a leverage of keeping the samples for a very long time (up to 1 year) and allows storage and shipping of perishable biological samples between distant laboratories at ambient temperatures. This allows repeating callose extractions without the need for repeatedly setting up the entire experiment for fresh sample collection.
Immunofluorescence spectrophotometry is recommended for high throughput callose quantification experiments while epifluorescence microscopy and immunofluorescence microcopy can be used for both quantification of callose and histolocalization of callose in plant tissues. To ensure accurate, efficient, and reliable spatiotemporal distribution of callose in plant tissues, it is recommended that different methods of callose quantification are used simultaneously which include the microscopy, spectrophotometry and enzyme activity-based methods. Consequently, this will accurately and efficiently allow the understanding of the role of callose in various physiological and stress responses. Future research could comprehensively and simultaneously assess several methods for callose quantification which include epifluorescence microscopy, immunofluorescence microscopy, fluorescence spectrophotometry, immunofluorescence spectrophotometry and the enzymatic activity-based methods.
Disclosures
The authors declare no conflict of interest.
Acknowledgements
This research was funded by The Bill & Melinda Gates Foundation, grant number INV 009894/OPP1134098. The funders had no role in the design of the study; in the collection, analyses, or interpretation of data; in the writing of the manuscript; or in the decision to publish the results.
Materials
| Name | Company | Catalog Number | Comments |
|---|---|---|---|
| Aluminium foil | Kim-Fay EA Limited, Nairobi, Kenya | ||
| Analytical balance | Mettler-Toledo AG, Greifensee, Switzerland | ML204/01 | |
| Beadbeater 96 | BioSpec Products Inc., Bartlesville, OK, USA | 1001EUR | |
| Blotting paper | Kim-Fay EA Limited, Nairobi, Kenya | ||
| Bovine Serum Albumin (BSA) | Thermo Fisher Scientific, Massachusetts, USA | B14 | |
| Centrifuge, 5425R | Eppendorf, Hamburg, Germany | 5406000240 | |
| Combined refrigerator- freezer (4 °C and −20 °C) | Haier Medical and laboratory Co. Ltd., Qingda, China | HYCD-282 | |
| Diethanolamine | PanReac AppliChem ITW Reagents, Química SLU, Barcelona, Spain | 191287 | |
| Digital Shaker, MixMate | Eppendorf, Hamburg, Germany | 5353000529 | |
| Di-sodium hydrogen phosphate (Na2HPO4) | PanReac AppliChem ITW Reagents, Química SLU, Barcelona, Spain | 141679 | |
| ELISA plates, 96-well, flat base, transparent, polystyrene, high binding | Sarstedt AG & Co. KG, Nümbrecht, Germany | 82.1581.200 | |
| Filter for the iMark microplate reader, iMark 680, 405 nm | Lasec International Pty. Ltd., Cape Town, South Africa | BRD1681011 | |
| Freeze-drier, VirTis—BenchTop “K” series; Model: 4KBTXL | LabWrench, Canada, USA | 448053 | |
| Hydrochloric acid (HCl) | PanReac AppliChem ITW Reagents, Química SLU, Barcelona, Spain | 141020 | |
| Isotherm Forced Convection Incubator, IFA-54-8 | Esco Lifesciences Group, Singapore | 2100002 | |
| Laminarin | Alfa Aesar, Massachusetts, USA | J66193 | |
| Microcentrifuge tubes 1.5 mL | Eppendorf, Hamburg, Germany | 022363204 | |
| Microcentrifuge tubes 2 mL | Genesee Scientific Corp., California, USA | 24–283 | |
| Micropipette (30–300 μL), 12-channel, 2100 series | Eppendorf, Hamburg, Germany | EP-12-300R | |
| Micropipette tips epT.I.P.S. Singles | Eppendorf, Hamburg, Germany | 022363204 | |
| Micropipettes (0.5–1000 μL), Research plus | Eppendorf, Hamburg, Germany | 3123000900 | |
| Microplate absorbance reader, iMark | Bio-Rad Laboratories, Inc., California, USA | 1681135EDU | |
| Microplate Manager 6 Version 6 software | Bio-Rad Laboratories, Inc., California, USA | 1689520 | |
| Parafilm | Paul Marienfeld GmbH & Co. KG, Lauda-Königshofen, Germany | 740751 | |
| Para-nitrophenyl phosphate (pNPP) | Merck KGaA, Darmstadt, Germany | 20-106 | |
| pH meter, HI9126 | Hanna Instruments, Woonsocket, RI, USA | 02310048991 | |
| Polyvinylpyrrolidone (PVP) | PanReac AppliChem ITW Reagents, Química SLU, Barcelona, Spain | A2260 | |
| Potassium chloride (KCl) | PanReac AppliChem ITW Reagents, Química SLU, Barcelona, Spain | A2939 | |
| Potassium di-hydrogen phosphate (KH2PO4) | PanReac AppliChem ITW Reagents, Química SLU, Barcelona, Spain | 141509 | |
| Precision water bath, GP10 | Thermo Fisher Scientific Inc., Newinton, CT, USA | TSGP10 | |
| Primary antibody (1-3-β-glucan-directed mouse IgG) | Bio supplies Australia Pty Ltd., Melbourne, Australia | 400-2 | |
| Reagent reservoirs | Thermo Fisher Scientific Inc., Massachusetts, USA | 15075 | |
| Secondary antibody conjugated to Alkaline Phosphatase (anti-Mouse IgG-Alkaline phosphatase) | Sigma Life Sciences, New Jersey, USA | A5153 | |
| Sodium azide (NaN3) | PanReac AppliChem ITW Reagents, Química SLU, Barcelona, Spain | A1430 | |
| Sodium carbonate (Na2CO3) | PanReac AppliChem ITW Reagents, Química SLU, Barcelona, Spain | 141648 | |
| Sodium chloride (NaCl) | PanReac AppliChem ITW Reagents, Química SLU, Barcelona, Spain | A2942 | |
| Sodium hydrogen carbonate (NaHCO3) | PanReac AppliChem ITW Reagents, Química SLU, Barcelona, Spain | 141638 | |
| Sodium hydroxide (NaOH) | PanReac AppliChem ITW Reagents, Química SLU, Barcelona, Spain | 141687.1210 | |
| Tween-20 | Biomatik Corporation, Ontario, Canada | A4031 | |
| Ultrapure distilled water | Thermo Fisher Scientific, Massachusetts, USA | 10-977-015 |
References
- Kelly, R., Register, E., Hsu, M. J., Kurtz, M., Nielsen, J. Isolation of a gene involved in 1,3-beta-glucan synthesis in Aspergillus nidulans and purification of the corresponding protein. J Bacteriol. 178 (15), 4381-4391 (1996).
- Ellinger, D., Voigt, C. A. Callose biosynthesis in arabidopsis with a focus on pathogen response: What we have learned within the last decade. Ann Bot. 114 (6), 1349-1358 (2014).
- Jacobs, A. K., et al. An Arabidopsis callose synthase, GSL5, is required for wound and papillary callose formation. Plant Cell. 15 (11), 2503-2513 (2003).
- Piršelová, B., Matušíková, I. Callose: the plant cell wall polysaccharide with multiple biological functions. Acta Physiol Plant. 35 (3), 635-644 (2013).
- Nedukha, O. M. Callose: Localization, functions, and synthesis in plant cells. Cytol Genet. 49 (1), 49-57 (2015).
- Chen, X. Y., Kim, J. Y. Callose synthesis in higher plants. Plant Signal Behav. 4 (6), 489-492 (2009).
- Beckman, C. H., Mueller, W. C., Tessier, B. J., Harrison, N. A. Recognition and callose deposition in response to vascular infection in Fusarium wilt-resistant or susceptible tomato plants. Physiol Plant Pathol. 20 (1), 1-10 (1982).
- Cheval, C., Faulkner, C. Plasmodesmal regulation during plant-pathogen interactions. New Phytol. 217 (1), 62-67 (2018).
- Cohen, Y., Eyal, H., Hanania, J. Ultrastructure, autofluorescence, callose deposition and lignification in susceptible and resistant muskmelon leaves infected with the powdery mildew fungus Sphaerotheca fuliginea. Physiol Mol Plant Pathol. 36 (3), 191-204 (1990).
- Kashyap, A., Planas-Marques, M., Capellades, M., Valls, M., Coll, N. S. Blocking intruders: inducible physico-chemical barriers against plant vascular wilt pathogens. J Exp Bot. 72 (2), 184-198 (2021).
- Nishimura, M. T., et al. Loss of a callose synthase results in salicylic acid-dependent disease resistance. Science. 301 (5635), 969-972 (2003).
- Underwood, W. The plant cell wall: A dynamic barrier against pathogen invasion. Front Plant Sci. 3, 85(2012).
- Wang, Y., Li, X., Fan, B., Zhu, C., Chen, Z. Regulation and function of defense-related callose deposition in plants. Int J Mol Sci. 22 (5), 2393(2021).
- Ali, M. A., Abbas, A., Kreil, D. P., Bohlmann, H. Overexpression of the transcription factor RAP2.6 leads to enhanced callose deposition in syncytia and enhanced resistance against the beet cyst nematode Heterodera schachtii in Arabidopsis roots. BMC Plant Biol. 13 (1), 47(2013).
- Böhlenius, H., Morch, S. M., Godfrey, D., Nielsen, M. E., Thordal-Christensen, H. The multivesicular body-localized GTPase ARFA1b/1c is important for callose deposition and ROR2 syntaxin-dependent preinvasive basal defense in barley. Plant Cell. 22 (11), 3831-3844 (2010).
- Currier, H. B., Strugger, S. Aniline blue and fluorescence microscopy of callose in bulb scales of Allium cepa L. Protoplasma. 45 (4), 552-559 (1956).
- Voigt, C. A., Schäfer, W., Salomon, S. A comprehensive view on organ-specific callose synthesis in wheat (Triticum aestivum L.): glucan synthase-like gene expression, callose synthase activity, callose quantification and deposition. Plant Physiol Biochem. 44 (4), 242-247 (2006).
- Kohari, M., Yashima, K., Desaki, Y., Shibuya, N. Quantification of stimulus-induced callose spots on plant materials. Plant Biotechnol. 33 (1), 11-17 (2016).
- Mason, K. N., Ekanayake, G., Heese, A. Staining and automated image quantification of callose in Arabidopsis cotyledons and leaves. Methods Cell Biol. 160, 181-199 (2020).
- Ellinger, D., et al. Elevated early callose deposition results in complete penetration resistance to powdery mildew in Arabidopsis. Plant Physiol. 161 (3), 1433-1444 (2013).
- Schindelin, J., et al. Fiji: an open-source platform for biological-image analysis. Nat Methods. 9 (7), 676-682 (2012).
- Zavaliev, R., Epel, B. L. Imaging callose at plasmodesmata using aniline blue: quantitative confocal microscopy. Methods Mol Biol. 1217, 105-119 (2015).
- Luna, E., et al. Callose deposition: A multifaceted plant defense response. Mol Plant Microbe. 24 (2), 183-193 (2011).
- Zhou, J., Spallek, T., Faulkner, C., Robatzek, S. CalloseMeasurer: a novel software solution to measure callose deposition and recognise spreading callose patterns. Plant Methods. 8 (1), 49(2012).
- Kimori, Y., Baba, N., Morone, N. Extended morphological processing: a practical method for automatic spot detection of biological markers from microscopic images. BMC Bioinformatics. 11, 373(2010).
- Welker, S., Levy, A. Comparing machine learning and binary thresholding methods for quantification of callose deposits in the citrus phloem. Plants (Basel). 11 (5), 624(2022).
- Kohler, A., Schwindling, S., Conrath, U. Extraction and quantitative determination of callose from Arabidopsis leaves. Biotechniques. 28 (6), 1084-1086 (2000).
- Tahara, K., Norisada, M., Hogetsu, T., Kojima, K. Aluminum tolerance and aluminum-induced deposition of callose and lignin in the root tips of Melaleuca and Eucalyptus species. J For Res. 10 (4), 325-333 (2005).
- De Ascensao, A. R., Dubery, I. A. Panama disease: Cell wall reinforcement in banana roots in response to elicitors from Fusarium oxysporum f. sp. cubense Race Four. Phytopathology. 90 (10), 1173-1180 (2000).
- Smith, M. M., McCully, M. E. A critical evaluation of the specificity of aniline blue induced fluorescence. Protoplasma. 95 (3), 229-254 (1978).
- Herburger, K., Holzinger, A. Aniline blue and Calcofluor white staining of callose and cellulose in the streptophyte green algae Zygnema and Klebsormidium. Bio Protoc. 6 (20), 1969(2016).
- Meikle, P. J., Boing, I., Hoogenraad, N. J., Clarke, A. E., Stone, B. A. The location of (1→3)-β-glucans in the walls of pollen tubes of Nicotiana alata using a (1→3)-β-glucan-specific monoclonal antibody. Planta. 185 (1), 1-8 (1991).
- Shedletzky, E., Unger, C., Delmer, D. P. A microtiter-based fluorescence assay for (1,3)-β-glucan synthases. Anal Biochem. 249 (1), 88-93 (1997).
- Piršelová, B., Mistrikova, V., Libantova, J., Moravcikova, J., Matusikova, I. Study on metal-triggered callose deposition in roots of maize and soybean. Biologia. 67 (4), 698-705 (2012).
- Siefert, F., Grossmann, K. Induction of chitinase and β-1,3-glucanase activity in sunflower suspension cells in response to an elicitor from Phytophthora megasperma f. sp. glycinea (Pmg). Evidence for regulation by ethylene and 1-aminocyclopropane-1-carboxylic acid (ACC). J Exp Botany. 48 (12), 2023-2029 (1997).
- Tripathi, L., Tripathi, J. N., Tushemereirwe, W. K., Bandyopadhyay, R. Development of a semi-selective medium for isolation of Xanthomonas campestris pv. musacearum from banana plants. Eur J Plant Pathol. 117 (2), 177-186 (2007).
- Adriko, J., et al. Molecular diagnostic tools targeting different taxonomic levels of Xanthomonads aid in disease management. Uganda J Agri Sci. 13 (2), 1-19 (2015).
- Ssekiwoko, F., Tushemereirwe, W. K., Batte, M., Ragama, P. E., Kumakech, A. Reaction of banana germplasm to inoculum with Xanthomonas campestris pv. musacearum. African Crop Sci J. 14 (2), 151-156 (2006).
- de Castro, M. D., Izquierdo, A. Lyophilization: a useful approach to the automation of analytical processes. J Automat Chem. 12 (6), 267-279 (1990).
- Pearson, G., Lago-Leston, A., Valente, M., Serrao, E. Simple and rapid RNA extraction from freeze-dried tissue of brown algae and seagrasses. Eur Journal Phycol. 41 (1), 97-104 (2006).
- Khaledi, N., Taheri, P., Falahati-Rastegar, M. Evaluation of resistance and the role of some defense responses in wheat cultivars to Fusarium head blight. J Plant Protection Res. 57 (4), 398-408 (2017).
- Zhang, H., et al. Transgenic Arabidopsis thaliana plants expressing a β-1,3-glucanase from sweet sorghum (Sorghum bicolor L.) show reduced callose deposition and increased tolerance to aluminium toxicity. Plant Cell Environ. 38 (6), 1178-1188 (2015).
- Nelson, T. E., Lewis, B. A. Separation and characterization of the soluble and insoluble components of insoluble laminaran. Carbohydr Res. 33 (1), 63-74 (1974).
- Zvyagintseva, T. N., et al. A new procedure for the separation of water-soluble polysaccharides from brown seaweeds. Carbohydr Res. 322 (1), 32-39 (1999).
- Rioux, L. E., Turgeon, S. L., Beaulieu, M. Characterization of polysaccharides extracted from brown seaweeds. Carbohydr Polymers. 69 (3), 530-537 (2007).
- Hosseini, S., Vazquez-Villegas, P., Rito-Palomares, M., Martinex-Chapa, S. O. Enzyme-Linked Immunosorbent Assay (ELISA) From A to Z. , Springer Nature. Singapore. (2017).
- Engvall, E., Perlmann, P. Enzyme-linked immunosorbent assay (ELISA). Quantitative assay of immunoglobulin G. Immunochemistry. 8 (9), 871-874 (1971).
- Reen, D. J. Enzyme-Linked Immunosorbent Assay (ELISA). Methods Mol Biol. 32, 461-466 (1994).
- Mustafa, A. S., et al. Xanthomonas campestris pv. musacearum bacterial infection induces organ-specific callose and hydrogen peroxide production in banana. PhytoFrontiers. 2 (3), 202-217 (2022).
- Mustafa, A. S., et al. Sandwich Enzyme-Linked Immunosorbent Assay for quantification of callose. Methods Protoc. 5 (4), 54(2022).
- Van Weemen, B. K., Schuurs, A. H. Immunoassay using antigen-enzyme conjugates. FEBS Lett. 15 (3), 232-236 (1971).
- Anderson, G. L., McNellis, L. A. Enzyme-linked antibodies: A laboratory introduction to the ELISA assay. J Chemical Edu. 75 (10), 1275(1998).
- Stone, B. A., Evans, N. A., Boing, I., Clarke, A. E. The application of Sirofluor, a chemically defined fluorochrome from aniline blue for the histochemical detection of callose. Protoplasma. 122 (3), 191-195 (1984).
- Chowdhury, J., et al. Down-regulation of the glucan synthase-like 6 gene (HvGsl6) in barley leads to decreased callose accumulation and increased cell wall penetration by Blumeria graminis f. sp. hordei. New Phytol. 212 (2), 434-443 (2016).
- Dahiya, P., Brewin, N. J. Immunogold localization of callose and other cell wall components in pea nodule transfer cells. Protoplasma. 214 (3), 210-218 (2000).
- Herburger, K., Holzinger, A. Localization and quantification of callose in the streptophyte green algae Zygnema and Klebsormidium: Correlation with desiccation tolerance. Plant Cell Physiol. 56 (11), 2259-2270 (2015).
- Leslie, M. E., Rogers, S. W., Heese, A. Increased callose deposition in plants lacking DYNAMIN-RELATED PROTEIN 2B is dependent upon POWDERY MILDEW RESISTANT 4. Plant Signal Behav. 11 (11), 1244594(2016).
Reprints and Permissions
This article has been published
Video Coming Soon