We describe a protocol to establish an air-liquid interface (ALI) culture model utilizing neonatal tracheal airway epithelial cells (nTAEC) and perform physiologically relevant hyperoxia exposure to study the effect of atmospheric-induced oxidative stress on cells derived from the developing neonatal airway surface epithelium.
Method Article
Translational 3D-Cell Culture Model to Assess Hyperoxia Effects on Human Neonatal Airway Epithelial Cells
Opens in a new tab
In This Article
Summary
Loading...
$$\rightleftharpoonup{xx}$$
$$\longleftharp{xx}$$,
$$\longrightharp{xx}$$,
Abstract
Loading...
$$\rightleftharpoonup{xx}$$
$$\longleftharp{xx}$$,
$$\longrightharp{xx}$$,
The preterm neonatal airway epithelium is constantly exposed to environmental stressors. One of these stressors in neonates with lung disease includes oxygen (O2) tension higher than the ambient atmosphere - termed hyperoxia (>21% O2). The effect of hyperoxia on the airway depends on various factors, including the developmental stage of the airway, the degree of hyperoxia, and the duration of exposure, with variable exposures potentially leading to unique phenotypes. While there has been extensive research on the effect of hyperoxia on neonatal lung alveolarization and airway hyperreactivity, little is known about the short and long-term underlying effect of hyperoxia on human neonatal airway epithelial cells. A major reason for this is the scarcity of an effective in vitro model to study human neonatal airway epithelial development and function. Here, we describe a method for isolating and expanding human neonatal tracheal airway epithelial cells (nTAECs) utilizing human neonatal tracheal aspirates and culturing these cells in air-liquid interface (ALI) culture. We demonstrate that nTAECs form a mature polarized cell-monolayer in ALI culture and undergo mucociliary differentiation. We also present a method for moderate hyperoxia exposure of the cell monolayer in ALI culture using a specialized incubator. Additionally, we describe an assay to measure cellular oxidative stress following hyperoxia exposure in ALI culture using fluorescent quantification, which confirms that moderate hyperoxia exposure induces cellular oxidative stress but does not cause significant cell membrane damage or apoptosis. This model can potentially be used to simulate clinically relevant hyperoxia exposure encountered by neonatal airways in the Neonatal Intensive Care Unit (NICU) and used to study the short and long-lasting effects of O2 on neonatal airway epithelial programming. Studies using this model could be utilized to explore ways to mitigate early-life oxidative injury to developing airways, which is implicated in the development of long-term airway diseases in former premature infants.
Introduction
Loading...
$$\rightleftharpoonup{xx}$$
$$\longleftharp{xx}$$,
$$\longrightharp{xx}$$,
Therapeutic oxygen (O2) is one of the most used therapies in the neonatal intensive care unit (NICU)1. Consequently, hyperoxia exposure (>21% O2) is a common atmospheric stressor encountered by neonates with and without significant lung disease. Lung responses to hyperoxia can vary depending on the intensity and/or duration of exposure and the anatomical location, cell type, and stage of lung development2,3,4,5,6. The bulk of the research in neonatal hyperoxia lung injury has been focused on the effect of hyperoxia exposure in the context of postnatal alveolarization to model bronchopulmonary dysplasia (BPD) - the most common chronic lung disease affecting preterm infants6,7,8,9,10,11. BPD severity is classified by the amount of respiratory support, and O2 needed at 36 weeks post-menstrual age9. Most babies with BPD improve clinically over time as the lungs continue to grow, with the majority weaning off respiratory support before their first birthday12,13. Regardless of the severity of BPD after birth, significant morbidities that affect former preterm babies include a 5-fold increased risk of preschool wheezing, asthma, recurrent respiratory infections throughout childhood, and early onset chronic obstructive pulmonary disease12,14,15,16,17,18,19. The effect of hyperoxia on long-term airway disease and pulmonary infections in preterm infants has been investigated using in vitro and in vivo animal models20,21,22,23,24. However, most of these models focused on the role of mesenchymal tissue, alveolar epithelium, and airway smooth muscle25,26,27,28.
The airway surface epithelium lines the entire path of the respiratory system, extending from the trachea down to the terminal bronchiole, ending just before the level of the alveoli29. Airway basal cells are the primary stem cells in the airway epithelium, with the capacity to differentiate into the entire repertoire of mature airway epithelial lineages, which include ciliated and secretory cells (club cells: non-mucus producing, and goblet cells: mucus-producing)29,30,31,32. Cell culture studies in the context of neonatal hyperoxic lung injury have mostly used adult human or mouse cancer cell lines33,34. Additionally, most in vitro experiments have used submerged culture systems, which do not permit differentiation of the cells into a mucociliary airway epithelium resembling the in vivo airway epithelium in humans35. Consequently, there is a gap in knowledge regarding the effects of hyperoxia-induced lung injury in developing airway epithelial cells of human neonates. One reason is the scarcity of translational models to study the effects of atmospheric exposure on human neonatal airway epithelium. Hyperoxic lung injury early in life can lead to long-term airway disease and increased risk of infection, resulting in life-altering consequences in former preterm infants14,36,37. In non-surviving infants with severe BPD, airway surface epithelium has distinct abnormalities, including goblet cell hyperplasia and disordered ciliary development, denoting abnormal mucociliary clearance and increased epithelial height compromising airway caliber38. In the last decade, there has been increased interest in culturing primary airway epithelial cells at the air-liquid interface (ALI) to study postnatal airway epithelial development39,40,41,42. However, ALI models of neonatal airway epithelial cells have not been used in the context of atmospheric redox perturbation models such as hyperoxia exposure.
Using a previously published method39, we have utilized neonatal tracheal aspirate samples obtained from intubated neonates in the NICU and successfully isolated and expanded primary neonatal tracheal airway epithelial cells (nTAECs). We have utilized inhibitors of Rho, Smad, Glycogen synthase kinase (GSK3), and mammalian target of rapamycin (mTOR) signaling to increase the expansion capacity and delay senescence in these cells, as described previously39,42, which allows for efficient and later passaging of nTAECs. The protocol describes methods for establishing 3D ALI cultures using nTAECs and performing hyperoxia exposure on the nTAEC monolayers. Rho and Smad inhibition is used for the first 7 days of ALI culture (ALI days 0 to 7), after which these inhibitors are removed from the differentiation media for the rest of the ALI culture duration. The apical surface of the ALI-cultured airway epithelial cell monolayer stays exposed to the environment43, which enables atmospheric perturbation studies and closely resembles the pathobiology of a developing neonatal airway exposed to hyperoxia in vivo. The concentration of O2 used in previous cell culture studies (regardless of immortalized or primary cells) of neonatal hyperoxic lung injury varies significantly (ranging from 40% to 95%), as does the duration of exposure (ranging from 15 min to 10 days)36,44,45,46,47. For this study, the ALI cell monolayer was exposed to 60% O2 for 7 days from ALI day 7 to 14 (after removal of Rho/Smad inhibitors from the differentiation media). Hyperoxia exposure was performed during the early-mid phase of mucociliary differentiation (ALI day 7 to 14) as opposed to the fully differentiated mature epithelium and thus simulates the in vivo developing airway epithelium in preterm infants. This exposure strategy minimizes the risk of acute O2 toxicity (which is expected with higher concentrations of O2) while still exerting oxidative stress within a physiologically relevant range and resembles the critical window of transition from the relatively hypoxic intrauterine environment to a hyperoxic external environment in preterm human neonates.
Protocol
Loading...
$$\rightleftharpoonup{xx}$$
$$\longleftharp{xx}$$,
$$\longrightharp{xx}$$,
Neonatal tracheal aspirate samples were collected only after informed consent from parents, and the protocol used for collection, transport, and storage has been approved by the Institutional Review Board (IRB) of the University of Oklahoma Health Sciences Center (IRB 14377).
1. Preparation for isolation, passaging, and ALI culture of nTAEC
- Media preparation
- Bronchial epithelial airway medium (BLEAM) with inhibitors (BLEAM-I): Prepare 500 mL (1 bottle, stored at 4 °C) of BLEAM by adding 1.25 mL of HLL supplement (500 µg/mL human serum albumin, 0.6 µM Linoleic acid, 0.6 µg/mL Lecithin), 15 mL of L-Glutamine (6 mM), 2 mL of Extract P (0.4%, bovine pituitary extract), 5 mL of TM1 (1 µM Epinephrine, 5 µg/mL Transferrin, 10 nM Triiodothyronine, 0.1 µg/mL Hydrocortisone, 5 ng/mL epidermal growth factor (EGF), 5 ng/mL insulin), 1 mL of antibiotic solution (Normocin, 0.1 mg/mL). To prevent senescence of the primary cells and improve efficiency of expansion, add the following growth factor inhibitors as previously described39: Y-27632 (Rho-associated protein kinase or ROCK inhibitor) with a final concentration of 5 µM, A83-01 (inhibits Smad signaling) with a final concentration of 1 µM, CHIR 99021 (Glycogen synthase kinase-3 or GSK3 inhibitor) with a final concentration of 0.4 µM and Rapamycin (inhibitor of molecular target of rapamycin or mTOR) with a final concentration of 5 nM. Filter the media through a 0.22 µm pore-size filter. Refer to Table 1 for a list of media components.
- Human bronchial/tracheal epithelial cell (HBTEC) ALI medium: Make 500 mL of HBTEC media by thawing the bottle at 37 °C and adding 1 mL of antibiotic solution (Normocin, 0.1 mg/mL). Once added, filter the media through a 0.22 µm pore-size filter.
- HBTEC media with inhibitors (HBTEC-I): Prepare the HBTEC media as above. Before filtering, add the following inhibitors: Y-27632 with a final concentration of 5 µM and A83-01 with a final concentration of 0.5 µM. Filter the media through a 0.22 µm pore-size filter.
NOTE: Store BLEAM-I, HBTEC, and HBTEC-I media at 4 °C, dated and labeled, in the dark (wrapped in foil), and only warm up aliquots of what is needed (shelf life is 30 days). - HEPES/FBS: Add 500 mL of HEPES-buffered saline and 88 mL of FBS (final concentration is 15%). Once added, filter the solution through a 0.22 µm pore-size filter and store it at 4 °C, dated and labeled.
NOTE: Aliquot and warm BLEAM, HEPES-FBS, and Trypsin-EDTA to 37 °C (at least 30 min) prior to use.
- Coating culture flasks and ALI cell culture inserts with an 804G-conditioned medium
- Prepare 804G cell (rat bladder epithelial cell line) matrix-conditioned media as previously described39.
- Coat the cell culture flask and cell culture inserts with 804G-conditioned media for at least 4 h in the 37 °C incubator, 5% CO2. Refer to Table 2 for the amounts of media needed to coat different culture flasks and cell culture inserts.
2. Isolation and expansion of nTAECs and preparation for subsequent ALI culture
- Acquire fresh tracheal aspirate (approximately 1 mL) during routine suction of the endotracheal tube of intubated neonates and collect the aspirate in a mucus trap. If the aspirate volume is insufficient to reach the mucus trap, rinse the suction catheter with 1-3 mL of sterile saline.
- Label the sample and store it in a biohazard bag on ice.
NOTE: The samples can be stored on ice at 4 °C for a maximum of 24 h. However, the yield is higher with fresh samples. - Transport the sample from the NICU to the lab. Coat a T25 flask with 804G-conditioned media and prepare for inoculation of the sample at the time of transportation of tracheal aspirate to the lab.
- Remove the mucus trap from the biohazard bag and clean the outer surfaces thoroughly with 70% ethanol to avoid any contamination. Carefully open the cap on the mucus trap under a sterile cell-culture hood.
- Dilute the tracheal aspirate sample with sterile PBS to 5 mL (to dilute mucus) and transfer the whole content into a 50 mL conical tube.
- Centrifuge the tube at 250 x g, 20 °C-23 °C for 5 min, and discard the supernatant (including mucus).
NOTE: All centrifugations here are done at 250 x g, 20 °C-23 °C for 5 min unless specified otherwise. - Resuspend the pellet in 5 mL of BLEAM-I.
- Remove the T25 flask from the incubator and discard the 804G conditioned media before plating the sample.
- Plate the sample in the T25 flask and place in the incubator at 37 °C, 5% CO2 (this will be termed Passage 0 or P0).
- Change the media with BLEAM-I 24 h after plating to wash out unattached cells and subsequently every 48 h.
NOTE: After processing the tracheal aspirate sample and incubating it in BLEAM-I media, cuboidal-shaped cells appear 7-10 days post-plating. By around 3 weeks post-plating, the cells are densely packed and require trypsinization for subsequent passaging, expansion, and storage. Early passage (P1 - P2) cells are placed in cryotubes (2.5 x 10⁶ cells per 500 µL of freezing media per cryotube) and stored in liquid nitrogen for long-term storage. - Rapidly thaw frozen cells from liquid nitrogen in a 37 °C water bath and transfer the cell suspension to an appropriately sized sterile tube containing BLEAM-I.
- Count the cells to determine the total and live cell number utilizing a trypan blue stain and an automated or manual cell counter as described previously48. Dilute the cell suspension with an appropriate volume of BLEAM-I, so the final concentration is 2.1 x 10⁶ cells in 15 mL of cell suspension (for T75 flask).
NOTE: For a T25 flask, 0.7 x 10⁶ cells in 5 mL of cell suspension are generally used for seeding. - Transfer the 15 mL cell suspension into a T75 flask and incubate overnight at 37 °C, 5% CO2.
- On the following morning, exchange the media with new BLEAM-I. Then, exchange the media with a new BLEAM-I every 2 days. Once the cells are around 80%-90%, they are ready to be trypsinized for ALI culture.
- Apply 5 mL of trypsin-EDTA (T75) to cell monolayer.
NOTE: Remember to use fresh trypsin. Avoid using trypsin that has been heated multiple times. - Incubate the flask at 37 °C for 5 min in the incubator. Then, tap the side of the flask 8x-10x to dislodge the cells. Check under the microscope to confirm that the cells have been dislodged after trypsinization. If >50% of cells remain on the flask, wash with PBS 2x and repeat the trypsinization step with a reduced incubation time of 2-3 min.
- Stop the reaction with 15 mL of HEPES-FBS and pipette up and down 4x-5x. Transfer the cells to an appropriate size sterile tube and centrifuge at 250 x g for 5 min to pellet the cells.
- After centrifugation, carefully aspirate the supernatant. Dissolve the cell pellet in 1 mL of BLEAM-I by gently pipetting up and down 5x-10x.
- Count the cells to determine the total and live cell number. Dilute the cell suspension with an appropriate volume of BLEAM-I, so the final concentration is 1 x 10⁵ live cells per 100 µl of cell suspension.
3. ALI culture of nTAECs
NOTE: Cell culture inserts should be coated with 804G-conditioned media and incubated for at least 4 h at 37 °C, 5% CO2 before the next step (see step 1.2).
- Remove the 24-well cell culture plate(s) containing the cell culture inserts from the incubator and discard the 804G-conditioned media.
- Add 1 mL of BLEAM-I to the basolateral (lower) chamber of each ALI well. Add 100 µL of cell suspension (1 x 10⁵ cells) to the apical chamber of the ALI cell culture inserts and incubate the cells at 37 °C, 5% CO2. This stage is defined as ALI day -2.
- The following day, change the media in the basolateral (1 mL) and apical (100 µL) chambers with fresh BLEAM-I. When changing the media in the apical chamber, be careful not to disturb the cell monolayer. This stage is defined as ALI day -1.
- The following day, remove the media from both the basolateral and apical chambers.
NOTE: It takes 2 days for the cells on the cell culture membrane to become confluent under submerged conditions. At this stage, ALI can be established. - Add 1 mL of HBTEC-I media to the basolateral chamber but leave the apical chamber media free and exposed to air. This stage is defined as ALI day 0.
- Continue to exchange the HBTEC-I media (1 mL) in the basolateral chamber every 48 h from ALI day 0 to 6. Switch to regular HBTEC media (without inhibitors) on ALI day 7 until the desired time point of harvest.
NOTE: During the first 7 days of ALI culture, media from the basolateral chamber may leak into the apical chamber. This media needs to be aspirated carefully each day to maintain health of the cell-layer and allow them to differentiate. - Harvest cells, cell culture inserts, and basolateral media at different time points for molecular techniques, assays, and analysis.
- For this protocol, on ALI days 0, 7, and 28, harvest cells for qPCR gene expression analysis (standard manufacturer protocol) of epithelial differentiation markers. On ALI days 0, 7, 14, and 28, harvest cell culture inserts for testing barrier function (methods described below).
- On ALI days 0 and 28, use formalin-fixed cell culture inserts for immunofluorescent staining with epithelial differentiation markers (utilizing previously published protocol)49. On ALI day 14, harvest basolateral media for lactate dehydrogenase (LDH) release (standard manufacturer protocol), cell lysates for qPCR of oxidative stress markers, and immunoblot with caspase-3 and cleaved caspase-3 antibodies (standard manufacturer protocol), and cell culture inserts for oxidative stress assay (method described below).
4. Testing barrier function during ALI differentiation
- Measuring Trans-Epithelial Electrical Resistance (TEER)
NOTE: Measure TEER using Epithelial Volt/Ohm Meter (EVOM) during ALI differentiation to assess cell-layer integrity50.- Before measuring test filter resistance values, use an 804G-conditioned media-coated cell culture (devoid of any cells) to measure background resistance value in Ohms (Ω)
- Subtract the background resistance value from test filter resistance values and multiply the difference by the cell growth surface area to obtain TEER value for each test filter.
TEER = (ΩT - ΩB) X C
TEER = Trans Epithelial Electrical Resistance (Ω.cm2)
ΩT = Test filter resistance value (Ω)
ΩB = Background resistance value (Ω)
C = Cell growth surface area (cm2)
NOTE: Cell culture inserts used for TEER measurements are subsequently fixed with 10% buffered formalin and used immediately for immunofluorescent staining and fluorescent microscopy (method described below) or stored at 4 °C for staining later.
- Fluoresceine Isethionate Dextran (FITC-dextran) epithelial permeability assay
NOTE: Epithelial permeability assay was performed utilizing two different molecular weights of FITC-dextran (10 kD and 20 kD) during ALI differentiation.- Prepare FITC-dextran working solution (1 mg/mL): measure 5 mg of FITC and mix in 1 mL of DMSO (5 mg/mL). Resuspend 5 mg/mL stock in HBTEC media warmed to 37 °C to a concentration of 1 mg/mL. Protect the solution from light.
- Transfer test filters (containing cells) to a new 12-well plate and add 1 mL of HBTEC media in the basolateral compartment.
- Aspirate apical compartment media (if any) and replace with 250 µL of FITC-dextran working solution. Incubate at room temperature protected from light for 60 min.
- End the FITC-dextran assay by removing the test filters (containing FITC-dextran working solution) from the 12-well plate.
- Collect the basolateral media from the 12-well plate in 1.5 mL microcentrifuge tubes and vortex.
- Transfer 100 µL aliquots from each tube to a 96-well clear bottom black polystyrene microplate in triplicates. Transfer 100 µL of HBTEC media to additional wells in the 96-well plate as a negative control to measure background fluorescence.
- Measure fluorescence intensity using a spectrophotometer using 490 nm excitation and 520 nm emission maxima.
- Subtract the average background fluorescence value from the test filter fluorescence values to obtain corrected fluorescence and express the values as a percentage against the corrected fluorescence values on ALI day 0 for FITC 10 kD and 20 kD.
5. Hyperoxia exposure using TriGas incubator
- On ALI day 7, determine the number of cell culture inserts to be put in hyperoxia based on experimental and harvest needs.
- Set the O2 level in the TriGas incubator to 60% O2. It generally takes ~30-45 min for the O2 level to reach 60%.
- Once the O2 level stabilizes at 60%, place the 24-well cell culture plate with the cell culture inserts assigned to the hyperoxia group inside the incubator and close the incubator door.
NOTE: This step needs to be performed as efficiently as possible to prevent a significant drop in O2 level inside the incubator. - Change the media in the hyperoxia-exposed cell culture inserts following the same schedule as the control (21% O2 exposed) wells. Check the cell culture inserts every day for media leakage and gently aspirate any leakage into the cell culture chamber.
- Continue hyperoxia exposure for 7 days (ALI days 7 to 14). Once hyperoxia exposure is completed, harvest cells or perform assays utilizing cell culture inserts on ALI day 14.
6. Oxidative stress assay to assess the effects of hyperoxia
NOTE: We used the CM-H2DCFDA assay kit and measured fluorescence intensity on ALI day 14 as a marker of oxidative stress in cell culture inserts following O2 exposure. H2DCFDA is a chemically reduced and acetylated form of 2′,7′-dichlorofluorescein (DCF) which is a live cell-permeant indicator of reactive oxygen species (ROS). CM-H2DCFDA is the thiol-reactive chloromethyl derivative of H2DCFDA, which promotes further covalent binding to intracellular components, allowing longer retention of the dye within the cell. These molecules are nonfluorescent until the acetate groups are removed by the action of intracellular esterases, and oxidation occurs in the cell51. Following intracellular oxidation, the resultant increase in fluorescence can be measured with a fluorescent microscope as a surrogate measure of cellular oxidative stress52. The reagent is light and air-sensitive and thus needs to be protected from light and kept airtight as far as possible.
- Preparation of CM-H2DCFDA assay solution: Each vial contains 50 µg of reagent dye in powdered form. To make a 1 mM stock solution, add 80 µL of sterile DMSO to the vial, mix well with a pipette, and vortex gently. For 1 µM final concentration of the dye in cell culture inserts, add 0.1 µL of the 1 mM stock per 100 µL PBS (e.g., add 0.6 µL stock solution to 600 µL PBS for 6 cell culture inserts).
NOTE: The final concentration of the dye can vary between 1-5 µM. The dose needs to be optimized for each culture condition. - Add 100 µL of the 1 µM dye solution in each cell culture for both the hyperoxia-exposed or normoxia-exposed group. Use at least 1 cell culture as a negative control from each treatment group (100 µL of PBS without dye). Incubate at 37 °C for 30 min, protected from light. Wash 1x with PBS.
- Slide preparation: Drain any excess PBS. Carefully hold the cell culture inserts and use a blade to slowly cut out the cell culture membrane. Pour 1-2 drops of mountant liquid on the slide. With flat-tipped forceps, carefully hold the corner of the membrane, place it cell-side down on the mountant, and cover it with a cover slip. Remove excess mountant liquid and leave to air dry for 15 min at room temperature protected from light. The slides are now ready to be imaged.
NOTE: Preparation of the slide and fluorescent microscopy should be performed as fast as possible as the fluorescent intensity fades significantly over 2-3 h. - Fluorescent microscopy: Capture images using a fluorescent microscope utilizing the Cy2 (cyanine-2) channel. Capture images from three separate, non-overlapping areas per cell culture.
- Fluorescent detection of oxidative stress
NOTE: Use the images from fluorescent microscopy to measure corrected total cell fluorescence (CTCF) utilizing the ImageJ software (https://imagej.nih.gov/ij/) and the workflow described below. CTCF serves as a marker for oxidative stress in the cell culture inserts following hyperoxia exposure and is measured by eliminating the background fluorescence with the help of ImageJ software.- Open the microscopy image in ImageJ and select the area of interest using the rectangle tool. Save the selection area (α) by right clicking and select Add to ROI (region of interest) manager. Use this selection area across images.
- Select the parameters for measurement under Analyze > Set Measurements and select Area, Integrated Density and Mean Gray Value within the settings tab.
- For each image, use the same selection area from the ROI manager and select Analyze > Measure. The integrated density value represents the total fluorescence (Ft) of the selected area. Note down the measurement values from the pop-up window.
- To correct the background fluorescence (Fb) in each image, select a small area of non-fluorescent region with the rectangle tool. Select Analyze > Measure for this region. The mean intensity value represents Fb. Note down the measurement values from the pop-up window.
- Calculate CTCF by multiplying the mean fluorescence intensity of background readings with the total area of the ROI and subtracting this number from the integrated density value of the ROI. Repeat this workflow for all images for both treatment groups (Control and Hyperoxia).
CTCF = Ft - (Fb x α)
CTCF = Corrected total cell fluorescence (A.U.)
Ft = Total fluorescence
Fb = Background fluorescence
α = Selection area
Results
Loading...
$$\rightleftharpoonup{xx}$$
$$\longleftharp{xx}$$,
$$\longrightharp{xx}$$,
To isolate nTAECs, we collected tracheal aspirates from intubated neonates in the NICU and transported the aspirates on ice to the lab for further processing (Figure 1A). After seeding the tracheal aspirate samples in airway epithelial growth medium (BLEAM-I containing Rho/Smad, GSK3, and mTOR inhibitors), cuboidal cells appeared within 7-10 days. By 14 days, the cells were 50%-60% confluent, and around 21 days post-plating, the cells were densely packed and required trypsinization for subsequent passaging and expansion. Serial passages of these cells (up to P3) were cryopreserved in liquid nitrogen for long-term storage. The cells (≤ passage 3) were then thawed out for ALI culture.
nTAECs were cultured in ALI once they reached around 80%-90% confluency in a T75 plate in submerged conditions. We performed immunofluorescence staining of the nTAEC monolayer on ALI day 0 with the basal cell-specific markers - cytokeratin-5 (KRT5)53 and tumor protein p63 (TP63)54 (Figure 1B). On ALI day 0, nearly all the cells are KRT5 and TP63 positive, suggesting airway basal cell phenotype with minimal differentiation. After ALI was established, TEER was measured using EVOM (Figure 1C) and rapidly increased in the early phase of ALI culture (ALI day 0 to 7) as nTAECs started forming a mature polarized cell monolayer, with subsequent plateauing of TEER between ALI day 7 and day 28 (Figure 1D). Further, FITC-dextran of two molecular weights (10 kD and 20 kD) were used to assess paracellular permeability during ALI differentiation and showed an overall gradual decrease of fluorescence over time (Figure 1E). This correlates with the formation of a mature cell-monolayer during ALI differentiation with decreasing permeability to solutes.
During ALI culture, basal cells differentiate into mature epithelial lineages, which include ciliated cells, non-mucus-secreting club cells, and mucus-secreting goblet cells39. Gene expression analysis of mature epithelial cell-specific markers on ALI day 0 showed minimal to no expression of forkhead box protein J155 (FOXJ1, ciliated cell marker), uteroglobin56 (SCGB1A1, club cell marker) and mucin-5AC57 (MUC5AC, goblet cell marker; Figure 2A), with subsequent increase (ALI day 7 and 28) suggesting differentiation into these mature airway epithelial subtypes during ALI culture. Additionally, we performed immunofluorescent staining on ALI day 28 utilizing mature epithelial cell-specific markers and quantified epithelial differentiation consisting of acetylated-tubulin58 (TUBA4A) positive ciliated cells (~22%), SCGB1A1 positive club cells (~13%) and MUC5AC positive goblet cells (~3%) with the rest being KRT5 positive basal cells (~51%) and other rare cell types (Figure 2B).
Rho and Smad inhibitors were used during the first 7 days of ALI culture (ALI days 0 to 7) and then removed from the differentiation media for the rest of the ALI culture duration (Figure 3A). The apical surface of the cell monolayer during ALI culture is exposed to air, enabling atmospheric perturbation studies. Hyperoxia exposure of the cell monolayer was performed with 60% O2 continuously for 7 days from ALI day 7 to 14 utilizing the TriGas Incubator. The control group was maintained in a separate incubator with room air (21% O2) exposure. Given the future intent to study long-lasting consequences (1-2 weeks following completion of O2 exposure) of O2 exposure on airway epithelial development and regeneration, it was essential that the O2 exposure did not acutely result in severe cytotoxicity or membrane damage to the extent that it significantly disrupts the ALI cell monolayer. To assess cell membrane damage, we measured LDH release in the basolateral media on ALI day 14, which showed no significant difference between hyperoxia and room air-treated cultures (Figure 3B). To further assess if cytotoxic effects from O2 were significant enough to induce apoptosis in nTAECs, we performed immunoblot for total caspase-3 and cleaved caspase-359 on cell lysates harvested from hyperoxia and room air exposed groups on ALI day 14 (Figure 3C). Total caspase-3 expression was comparable between the two groups, and cleaved caspase-3 expression was not detected, suggesting that 7 days of 60% O2 exposure did not induce apoptosis in nTAECs on ALI day 14. Additionally, a positive control was designed with overnight incubation of nTAECs under submerged conditions with increasing concentrations of staurosporine (0.5 µM, 1 µM, and 2 µM), a cytotoxic agent, and an apoptosis inducer. Immunoblotting for total caspase-3 and cleaved caspase-3 expression confirmed successful induction of apoptosis. To measure oxidative stress induced by 60% O2 exposure, a cellular oxidative stress assay with fluorescent intensity measurement was performed on the nTAEC cell monolayers on ALI 14 (Figure 3D). Hyperoxia exposure caused a significant increase in fluorescent intensity (calculated by corrected total cell fluorescence or CTCF) compared to room air exposed cells, suggesting increased cellular oxidative stress. Gene expression analysis of antioxidant genes showed that 60% O2 caused upregulation of these antioxidant genes on ALI day 14, with catalase, SOD1, SOD2, and GPX3 being significantly upregulated (Figure 3E).
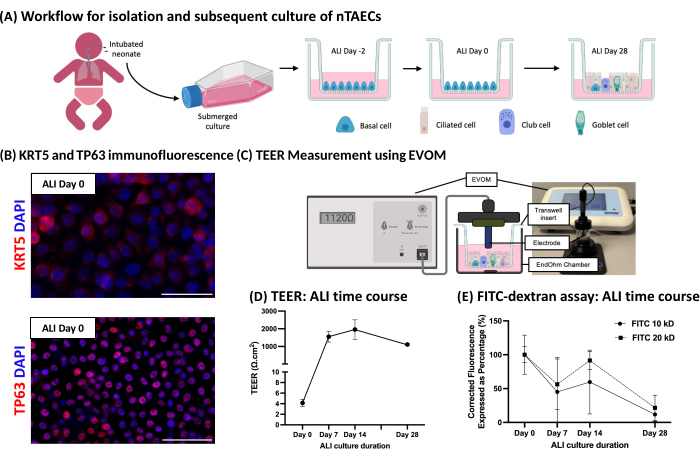
Figure 1: Neonatal tracheal airway epithelial cells (nTAECs) are successfully isolated from neonatal tracheal aspirates and cultured in air-liquid interface (ALI). (A) nTAECs isolated utilizing tracheal aspiration from intubated neonates were passaged in submerged condition with subsequent ALI culture. (B) Cells were harvested on ALI day 0 for immunofluorescent staining with airway basal cell markers - KRT5 (red) and TP63 (red). Nuclei are stained blue with DAPI. Scale bar = 50 µm. (C) Measurement of trans-epithelial electric resistance (TEER) in cell culture inserts using an Epithelial Volt/Ohm Meter (EVOM). (D) TEER was measured during ALI differentiation. Data presented as mean (n=2 donors, 5-10 wells per donor per timepoint). Error bars indicate SEM. (E) Fluorescein isothiocyanate-dextran (FITC-dextran) trans-epithelial permeability assay was performed during ALI differentiation utilizing two different molecular weights of FITC-dextran (10 kD and 20 kD). FITC-dextran solution (10 kD or 20 kD) was added to the apical chamber, and the cell culture inserts were incubated at room temperature for 60 min. Fluorescence in the basolateral chamber media was measured spectrophotometrically in 96-well plates. Background fluorescence (HBTEC media) was subtracted from the test measurements to obtain a corrected fluorescence value (expressed as a percentage compared to day 0 values). Data presented as mean (n=2 donors, three wells per donor per timepoint for each molecular weight of FITC-dextran). Error bars indicate SEM. Please click here to view a larger version of this figure.
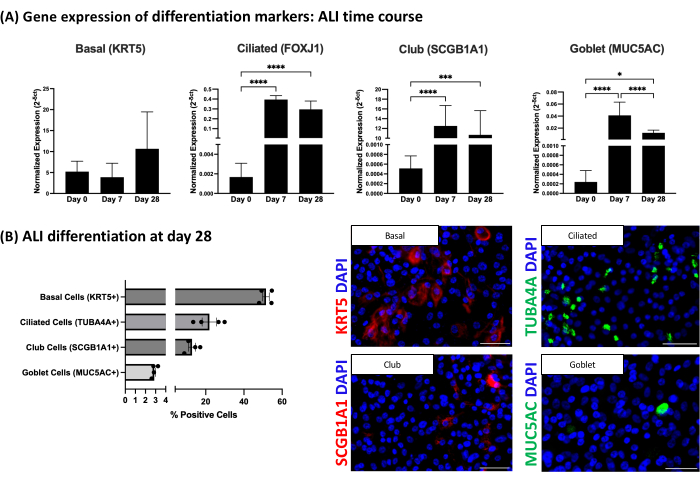
Figure 2: Neonatal tracheal airway epithelial cells (nTAECs) undergo mucociliary differentiation during air-liquid interface (ALI) culture. (A) Cells were harvested on ALI days 0, 7, and 28 for qPCR analysis of epithelial cell-specific markers: cytokeratine-5 (KRT5) for basal, forkhead box protein J1 (FOXJ1) for ciliated, uteroglobin (SCGB1A1) for club and mucin-5AC (MUC5AC) for goblet cells. Relative expression of each gene was determined using the δCt method with GAPDH as the endogenous control. Data presented as mean (from n = 3 donors, three wells per donor per timepoint). Error bars indicate SEM. Statistical analysis was performed utilizing two-way ANOVA with Tukey post-hoc analysis, *p=0.0114, ***p=0.0005, ***p<0.0001. (B) Immunofluorescent staining of basal (KRT5, red), ciliated (acetylated-tubulin or TUBA4A, green), club (SCGB1A1, red), and goblet (MUC5AC, green) cells were performed on ALI day 28 to quantify epithelial differentiation. Nuclei are stained blue with DAPI. Data for percentage (%) positive cells presented as mean (n=2 donors, two cell culture inserts per donor, 6-8 non-overlapping images per slide, minimum of 3000 cells counted per slide). Error bars indicate SEM. Scale bar = 50 µm. Please click here to view a larger version of this figure.
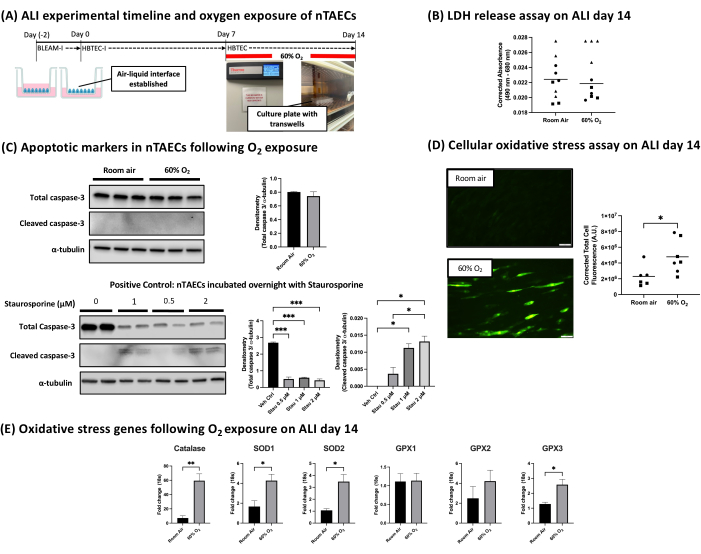
Figure 3: Hyperoxia induces cellular oxidative stress in neonatal tracheal airway epithelial cells (nTAECs) but does not cause significant cell membrane damage or apoptosis. (A) Experimental timeline for hyperoxia exposure of nTAECs using the Trigas incubator. Oxygen exposure was started after inhibitors were removed from the differentiation media on ALI day 7 and continued for 7 days (ALI day 7 to 14). (B) Basolateral media was harvested for LDH release assay to assess cell membrane damage between room air (control) and 60% O2 (hyperoxia) exposed group on ALI day 14. Data presented as individual data points (corrected absorbance) with lines denoting the grand mean for each group, n=3 donors denoted by black circles, squares, and triangles with four wells per donor, respectively. Statistical analysis was performed utilizing an unpaired t-test, p=0.6184. (C) Cells were harvested on ALI day 14, and immunoblotting for markers of apoptosis (caspase-3 and cleaved caspase-3) was performed to compare responses between room air and O2-exposed nTAECs. Positive control for the assay was designed by incubating nTAECs overnight with staurosporine (Stau 0.5 µM, 1 µM, and 2 µM) or vehicle control (Veh Ctrl) in a submerged culture condition. Cells were harvested for immunoblot with total caspase-3 and cleaved caspase-3 antibody. Densitometry was performed with α-tubulin as a housekeeping gene. Data presented as mean (from n=2-3 donors, one to two wells per donor). Error bars indicate SEM. An unpaired t-test was used to compare total caspase-3 expression between room air and the 60% O2 group, p=0.4. One-way ANOVA was used to compare total caspase-3 and cleaved caspase-3 expression between Veh Ctrl and Stau exposed groups, *p<0.05, ***p<0.0005. (D) CM-H2DCFDA assay for cellular oxidative stress was performed on ALI day 14 with cell culture inserts harvested from room air and O2-exposed nTAECs. Representative fluorescent microscopy images of room air (control) and 60% O2 (hyperoxia) exposed cell culture inserts are shown. Corrected total cell fluorescence (CTCF) was calculated to compare cellular oxidative stress between room air and 60% O2-exposed nTAECs. CTCF data presented as individual data points with line denoting the grand mean for each group, 6-7 images/group from 2 individual donors (black circles and squares) with two wells per donor. Statistical analysis was performed utilizing an unpaired t-test, *p<0.05. Scale bar = 50 µm. (E) Cells were harvested on ALI day 14 from room air, and hyperoxia-exposed wells for qPCR analysis of oxidative stress genes, including catalase, superoxide dismutase 1 & 2 (SOD1 & SOD2), glutathione peroxidase 1, 2, and 3 (GPX1, GPX2, and GPX3) was performed. Fold change data of each gene was determined using the δCt method with 18s rRNA as endogenous control. Data presented as mean (from n=3 donors, two wells per donor). Error bars indicate SEM. Statistical analysis was performed utilizing an unpaired t-test, *p<0.05, **p=0.006. Please click here to view a larger version of this figure.
| Media component | Amount | Final concentration | ||
| BLEAM-I | ||||
| BLEAM media | 500 mL | |||
| HLL supplement | 1.25 mL | 500 µg/mL human serum albumin 0.6 µM Linoleic acid; 0.6 µg/mL Lecithin | ||
| L-Glutamine | 15 mL | 6mM | ||
| Extract P | 2 mL | 0.4% bovine pituitary extract | ||
| TM1 | 5 mL | 1 µM Epinephrine; 5 µg/mL Transferrin 10 nM Triiodothyronine; 0.1 µg/mL Hydrocortisone 5ng/mL Epidermal growth factor (EGF) 5 ng/mL Insulin | ||
| Normocin | 1 mL | 0.1 mg/mL | ||
| Y-27632 | May vary based on lot number | 5 µM | ||
| A83-01 | May vary based on lot number | 1 µM | ||
| CHIR 99021 | May vary based on lot number | 0.4 µM | ||
| Rapamycin | May vary based on lot number | 5 nM | ||
| HBTEC | ||||
| HBTEC media | 500 mL | |||
| Normocin | 1 mL | 0.1 mg/mL | ||
| HBTEC-I | ||||
| HBTEC media | 500 mL | |||
| Normocin | 1 mL | 0.1 mg/mL | ||
| Y-27632 | May vary based on lot number | 5 µM | ||
| A83-01 | May vary based on lot number | 0.5 µM | ||
Table 1: Media components for Bronchial epithelial airway medium with inhibitors (BLEAM-I), Human bronchial/tracheal epithelial cell ALI media with inhibitors (HBTEC-I), and HBTEC.
| Cell culture flask/Cell culture inserts | 804G cell-conditioned media (mL) |
| T25 flask | 3 mL |
| T75 flask | 5 mL |
| 24-well cell culture insert (0.4 µm pore-size, 0.33 cm2 surface area) | 400 µL |
Table 2: Volumes of 804G cell-derived matrix-conditioned media required for culture flasks and cell culture inserts.
Discussion
Loading...
$$\rightleftharpoonup{xx}$$
$$\longleftharp{xx}$$,
$$\longrightharp{xx}$$,
The protocol described here details a method for the collection and processing of neonatal tracheal aspirate samples from intubated neonates in the NICU with subsequent isolation and expansion of live nTAECs from these samples using previously established methods39. Furthermore, we have described a method for culturing nTAECs on ALI and characterizing their differentiation into a polarized mucociliary airway epithelium as a function of time via measurement of TEER, FITC-dextran assay, immunofluorescent staining, and qPCR analysis of cell type (i.e., basal, ciliated, club and goblet) specific markers. The novel aspect of this protocol is the atmospheric redox perturbation performed through moderate hyperoxia (60% O2) exposure on developing nTAEC monolayers. We have shown that 60% O2 exposure for 7 days induces cellular oxidative stress in nTAECs. We further show that the O2 exposure strategy does not acutely induce significant cellular apoptosis or cell membrane damage, which allows maintenance of these nTAECs in ALI culture beyond the time of completion of O2 exposure. Thus, the model can potentially be used to study both short- and long-lasting effects of O2 exposure on neonatal airway epithelial programming.
Culturing nTAECs in ALI confers certain advantages over conventional submerged culture as it promotes the formation of a polarized airway epithelial monolayer with tight junction formation and mucociliary differentiation60,61. Previous studies with nTAECs have shown that in the early phase of ALI culture (ALI day 0 to 7), the cells undergo pseudo-stratification (appearing as multi-layered as opposed to single cell layer) and finally form a mature pseudostratified epithelium by the end of second week42,62. Tight junction formation follows a similar trajectory in the early phase of ALI culture accompanied by a rapid increase in TEER with later plateauing63, demonstrated in the model with nTAECs. Further, airway epithelial cells cultured in ALI enhance expression and apico-lateral localization of claudin-1 (a component of tight junction complex), which augments the sealing properties of tight junctions during ALI culture, promoting the formation of a mature cell monolayer63. This correlates with decreased paracellular permeability, which was tested in the model with FITC-dextran assay and demonstrated a generally decreasing trend in monolayer permeability. We have delineated the mucociliary differentiation pattern in nTAECs with immunostaining for ciliated (TUBA4A), club (SCGB1A1), and goblet (MUC5AC) cell-specific markers on ALI day 28. Additionally, we performed gene expression of ciliated (FOXJ1), club (SCGB1A1), and goblet (MUC5AC) cell-specific markers during the ALI time course. Other groups have shown that the transcription factor FOXJ1 is essential for motile ciliogenesis, while TUBA4A is present in both primary and motile cilia64,65. In this model, the gene expression pattern for FOXJ1 during ALI differentiation of nTAECs roughly correlates with the time of appearance of motile cilia in airway epithelial culture from previous studies64,66.
A recent study by Teape et al. assessed proteomic and metabolomic effects of hyperoxia exposure on ALI culture67. However, cells were derived from adult donors. Previous studies on respiratory syncytial virus (RSV)62,68,69,70 and the recent COVID-19 pandemic71 have highlighted the importance of age-related differences in airway epithelial response and function. Zhao et al. utilized similar workflows to isolate neonatal and adult airway epithelial cells and showed that after 21 days of ALI differentiation, there were no significant differences in the cellular composition between neonatal and adult airway epithelial cells62. However, there were distinct differences in their response to RSV infection, with neonatal cells showing more RSV-infected cells and epithelial damage compared to adults. In general, the culture conditions utilized by Zhao et al. produced a more robust differentiation in nTAECs compared to ours, with a higher number of ciliated (41% vs 22%) and goblet (10% vs 3%) cells. These differences could be attributed to the use of different growth media. The PneumaCult-ALI medium used by their group (as opposed to the HBTEC-ALI medium) has been shown to induce more robust differentiation with higher numbers of ciliated and goblet cells72. In this model, gene expression of cell-type specific markers for ciliated, club, and goblet cells showed an initial rapid increase (ALI day 0 to 7) with later decrement around ALI day 28. A possible reason could be the plateauing of differentiation after ALI day 14, which has been demonstrated in previous studies with nTAECs42.
We have described the use of moderate hyperoxia (60% O2) exposure for 7 days, which we think more closely simulates the real-life experiences of preterm neonates in the NICU compared to the use of very high O2 levels (> 80% O2)67 where the risk of acute O2 toxicity is increased1,5. Indeed, 95% O2 exposure of newborn lung tissue was shown to induce cellular apoptosis through caspase activation73. However, this exposure strategy is relevant in only a minor percentage of babies in the NICU who, as a consequence of the O2-induced acute lung injury, develop severe BPD with chronic bronchial pathologies (acute lung injury model)37. In the modern era of judicious use of O2 therapy, most premature babies do not get exposed to such high O2; however, they are still at risk of developing future airway disease (developmental perturbation model). In this latter group, the injury from early-life redox perturbation may be silent initially but manifest later during toddler age or beyond in the form of chronic airway disease37. Our data utilizing cellular oxidative stress assay showed that moderate hyperoxia exposure (60% O2) significantly increased oxidative stress within the nTAEC cell monolayer. Analysis of LDH release and cellular caspase-3 activation suggested that our hyperoxia exposure strategy did not cause significant cell death. The methods and the model system we describe can potentially be utilized to uncover O2-sensitive molecular mechanisms early in life as a link to the later development of pulmonary disease in former preterm infants.
During fetal life, airway epithelial cells are submerged in lung fluid and exist in the relatively hypoxic intrauterine environment26. Neonatal airway epithelial cells undergo rapid turnover and differentiation and form a critical barrier between the lung and the outside world. As newborns transition to postnatal life, airway epithelial cells are exposed to a relatively hyperoxic postnatal environment. This transition is rendered more abrupt in preterm and clinically ill newborns as they also routinely require therapeutic O2 as part of their care40,74, placing them at high risk of oxidative injury after birth1. While the effects of hyperoxia on postnatal lung alveolarization have been well characterized using animal models75, the effects of hyperoxia exposure on developing airway epithelial cells are relatively understudied38. The use of human neonatal-derived airway epithelial cells with physiologically relevant hyperoxia exposure during ALI adds translational relevance to our model. Additionally, the use of hyperoxia exposure during the early-mid phase of active differentiation and cell monolayer formation rather than fully differentiated mature airway epithelium67 potentially simulates the clinical scenario in extremely preterm newborns (< 28 weeks of gestation) who are born during the earlier stages (canalicular to saccular) of lung development rather than the alveolar stage7.
Our model has limitations that must be considered when applying it to human development and disease. We have used conditional reprogramming of primary neonatal airway epithelial cells previously published in an ALI model of nTAECs39. The use of growth factor inhibitors (Rho/Smad/GSK3/mTOR) enables faster and later passaging of these cells. We have attempted to culture nTAECs in both submerged and ALI conditions without inhibitors in the growth medium; however, expansion and passaging of these cells were significantly slower, and the cell monolayer in ALI became leaky by the end of the second week (data not shown). Another group utilizing the same inhibitors for culturing primary neonatal airway epithelial cells42 performed single-cell RNA-sequencing to show that the presence of these inhibitors did not cause significant differential expression of genes involved in oxidative stress, epithelial-mesenchymal transition, or cellular senescence. Nonetheless, we considered this limitation in our model and decided to perform hyperoxia exposure after Rho and Smad inhibitors were removed from the differentiation media. For this study, we have only tested moderate hyperoxia (60% O2) effects on nTAECs. However, future studies intend to utilize graded hyperoxia exposure (40%, 60%, and 95% O2) and compare the responses in nTAECs. While the model described here has translational appeal given the use of cells from human neonates admitted in the NICU, this is an in vitro cell culture model, and thus, significant findings utilizing this model would warrant confirmation with a complementary in vivo animal model.
In conclusion, we have described the step-by-step method for establishing an in vitro 3D ALI culture model utilizing neonatal airway epithelial cells isolated from tracheal aspirates of intubated neonates in the NICU. We have used this model to examine the effects of moderate hyperoxia exposure, a common environmental insult in premature neonates in the NICU. Hyperoxia exposure induced cellular oxidative stress in the cell monolayer without causing significant cell membrane damage or cell death, allowing the continuation of ALI culture to study the long-lasting effects of O2 exposure on neonatal airway epithelial development and function. Future applications utilizing these methods could potentially uncover early disease mechanisms involved in hyperoxia-induced long-term development of pulmonary diseases frequently seen in former preterm infants.
Disclosures
Loading...
$$\rightleftharpoonup{xx}$$
$$\longleftharp{xx}$$,
$$\longrightharp{xx}$$,
The authors have nothing to disclose and no conflicts of interest to report.
Acknowledgements
Loading...
$$\rightleftharpoonup{xx}$$
$$\longleftharp{xx}$$,
$$\longrightharp{xx}$$,
This work is supported by funding from Presbyterian Health Foundation (PHF) and Oklahoma Shared Clinical and Translational Resources (U54GM104938 with an Institutional Development Award (IDeA) from NIGMS) to AG. We would like to thank Dr. Paul LeRou and Dr. Xingbin Ai at Massachusetts General Hospital, Harvard Medical School, Boston, Massachusetts, for providing neonatal donor cells used in some of the experiments. Figures were created with Biorender. Statistical analysis was performed with GraphPad Prism.
Materials
| Name | Company | Catalog Number | Comments |
|---|---|---|---|
| 10% Buffered Formalin | Fisher Scientific | 23-426796 | |
| 1X PBS (Phosphate Buffered Saline) Solution, pH 7.4 | Gibco | 10010049 | |
| A 83-01 | Tocris | 29-391-0 | |
| ALI Transwell Inserts, 6.5mm | Corning | 3470 | |
| Anti-Acetylated Tubulin antibody, Mouse monoclonal | Sigma | T7451 | |
| Anti-alpha Tubulin antibody | Abcam | ab7291 | |
| Anti-Cytokeratin 5 antibody | Abcam | ab53121 | |
| BronchiaLife Epithelial Airway Medium (BLEAM) | LifeLine Cell Technology | LL-0023 | |
| CHIR 99021 | Tocris | 44-231-0 | |
| Cleaved caspase-3 antibody | Cell signaling | 9664T | |
| SCGB1A1 or Club Cell Protein (CC16) Human, Rabbit Polyclonal Antibody | BioVendor R&D | RD181022220-01 | |
| CM-H2DCFDA (General Oxidative Stress Indicator) | Thermo Scientific | C6827 | |
| Corning Cell Culture Treated T25 Flasks | Corning | 430639 | |
| Corning U-Shaped Cell Culture T75 Flasks | Corning | 430641U | |
| CyQUANT LDH Cytotoxicity Assay | Thermo Scientific | C20300 | |
| DAPI Solution (1 mg/mL) | Fisher Scientific | EN62248 | |
| Dimethyl sulfoxide [DMSO] Hybri-Max | Sigma | D2650 | |
| Distilled water | Gibco | 15230162 | |
| EVOM Manual for TEER Measurement | World Precision Instrument | EVM-MT-03-01 | |
| FBS (Fetal Bovine Serum) | Gibco | 10082147 | |
| Fluorescein Isothiocyanate Dextran (average mol wt 10,000) | Fisher Scientific | F0918100MG | |
| Fluorescein isothiocyanate–dextran (average mol wt 20,00) | Sigma | FD20-100MG | |
| Goat Anti-Mouse IgG(H+L), Human ads-HRP | Southern Biotech | 1031-05 | |
| Goat anti-Mouse IgG2b Cross-Adsorbed Secondary Antibody, Alexa Fluor 488 | Invitrogen | A-21141 | |
| Goat anti-Rabbit IgG (H+L) Highly Cross-Adsorbed Secondary Antibody, Alexa Fluor 546 | Invitrogen | A-11035 | |
| Goat Anti-Rabbit IgG(H+L), Mouse/Human ads-HRP | Southern Biotech | 4050-05 | |
| HBTEC Air-Liquid Interface (ALI) Differentiation Medium | LifeLine Cell Technology | LM-0050 | |
| HEPES | Lonza | CC-5024 | |
| Heracell VIOS 160i Tri-Gas CO2 Incubator, 165 L | Thermo Scientific | 51030411 | |
| High-Capacity cDNA Reverse Transcription Kit | Thermo Scientific | 4368814 | |
| HLL supplement | LifeLine Cell Technology | LS-1001 | |
| ImageJ | NIH | N/A | imagej.nih.gov/ij/ |
| Invivogen Normocin - Antimicrobial Reagent | Fisher Scientific | NC9273499 | |
| L-Glutamine | LifeLine Cell Technology | LS-1013 | |
| Normal Goat Serum | Gibco | PCN5000 | |
| Normocin | Invivogen | ant-nr-05 | |
| p63 antibody | Santa Cruz Biotechnology | sc-25268 | |
| ProLong Gold Antifade Mountant | Invitrogen | P36930 | |
| PureLink RNA Mini Kit | Thermo Scientific | 12183025 | |
| RAPAMYCIN | Thermo Scientific | AAJ62473MC | |
| TaqMan Fast Advanced Master Mix | Thermo Scientific | 4444964 | |
| Taqman Gene Exression Assays: 18S rRNA | Thermo Scientific | Hs99999901_s1 | |
| Taqman Gene Exression Assays: CAT | Thermo Scientific | Hs00156308_m1 | |
| Taqman Gene Exression Assays: FOXJ1 | Thermo Scientific | Hs00230964_m1 | |
| Taqman Gene Exression Assays: GAPDH | Thermo Scientific | Hs02786624_g1 | |
| Taqman Gene Exression Assays: GPX1 | Thermo Scientific | Hs00829989_gH | |
| Taqman Gene Exression Assays: GPX2 | Thermo Scientific | Hs01591589_m1 | |
| Taqman Gene Exression Assays: GPX3 | Thermo Scientific | Hs01078668_m1 | |
| Taqman Gene Exression Assays: KRT5 | Thermo Scientific | Hs00361185_m1 | |
| Taqman Gene Exression Assays: MUC5AC | Thermo Scientific | Hs01365616_m1 | |
| Taqman Gene Exression Assays: SCGB1A1 | Thermo Scientific | Hs00171092_m1 | |
| Taqman Gene Exression Assays: SOD1 | Thermo Scientific | Hs00533490_m1 | |
| Taqman Gene Exression Assays: SOD2 | Thermo Scientific | Hs00167309_m1 | |
| Thermo Scientific Nalgene Rapid-Flow Sterile Disposable Filter Units with PES Membrane (0.22 μm pores, 500 ml) | Thermo Scientific | 5660020 | |
| TM-1 Combined Supplement | LifeLine Cell Technology | LS-1055 | |
| Total caspase-3 antibody | Cell signaling | 14220S | |
| Triton X-100 | Sigma | 9036-19-5 | |
| Trypsin-EDTA (0.05%), Phenol red | Gibco | 25300062 | |
| Y-27632 2 HCl | Tocris | 12-541-0 |
References
Loading...
$$\rightleftharpoonup{xx}$$
$$\longleftharp{xx}$$,
$$\longrightharp{xx}$$,
- Torres-Cuevas, I., et al. Oxygen and oxidative stress in the perinatal period. Redox Biol. 12, 674-681 (2017).
- Hanidziar, D., Robson, S. C. Hyperoxia and modulation of pulmonary vascular and immune responses in COVID-19. Am J Physiol-Lung Cell Mol Physiol. 320 (1), L12-L16 (2021).
- Amarelle, L., Quintela, L., Hurtado, J., Malacrida, L. Hyperoxia and lungs: What we have learned from animal models. Front Med. 8, 606678(2021).
- Mach, W. J., Thimmesch, A. R., Pierce, J. T., Pierce, J. D. Consequences of hyperoxia and the toxicity of oxygen in the lung. Nursing Res Pract. 2011, 260482(2011).
- Kallet, R. H., Matthay, M. A. Hyperoxic acute lung injury. Respir Care. 58 (1), 123-141 (2013).
- Penkala, I. J., et al. Age-dependent alveolar epithelial plasticity orchestrates lung homeostasis and regeneration. Cell Stem Cell. 28 (10), 1775-1789 (2021).
- Thébaud, B., et al. Bronchopulmonary dysplasia. Nat Rev Dis Primers. 5 (1), 78(2019).
- Ibrahim, J., Bhandari, V. The definition of bronchopulmonary dysplasia: an evolving dilemma. Pediatr Res. 84 (5), 586-588 (2018).
- Higgins, R. D., et al. Bronchopulmonary Dysplasia: Executive summary of a workshop. J Pediatr. 197, 300-308 (2018).
- Collins, J. J. P., Tibboel, D., de Kleer, I. M., Reiss, I. K. M., Rottier, R. J. The future of bronchopulmonary Dysplasia: Emerging pathophysiological concepts and potential new avenues of treatment. Front Med (Lausanne). 4, 61(2017).
- Northway, W. H., Rosan, R. C., Porter, D. Y. Pulmonary disease following respirator therapy of hyaline-membrane disease. Bronchopulmonary dysplasia. N Engl J Med. 276 (7), 357-368 (1967).
- Collaco, J. M., McGrath-Morrow, S. A. Bronchopulmonary dysplasia as a determinant of respiratory outcomes in adult life. Pediatr Pulmonol. 56 (11), 3464-3471 (2021).
- Tepper, R. S., Morgan, W. J., Cota, K., Taussig, L. M. Expiratory flow limitation in infants with bronchopulmonary dysplasia. J Pediatr. 109 (6), 1040-1046 (1986).
- Davidson, L. M., Berkelhamer, S. K. Bronchopulmonary Dysplasia: Chronic lung disease of infancy and long-term pulmonary outcomes. J Clin Med. 6 (1), 4(2017).
- Filbrun, A. G., Popova, A. P., Linn, M. J., McIntosh, N. A., Hershenson, M. B. Longitudinal measures of lung function in infants with bronchopulmonary dysplasia. Pediatr Pulmonol. 46 (4), 369-375 (2011).
- Stoll, B. J., et al. Neonatal outcomes of extremely preterm infants from the NICHD Neonatal Research Network. Pediatrics. 126 (3), 443-456 (2010).
- Colin, A. A., McEvoy, C., Castile, R. G. Respiratory morbidity and lung function in preterm infants of 32 to 36 weeks gestational age. Pediatrics. 126 (1), 115-128 (2010).
- Doyle, L. W., Ranganathan, S., Cheong, J. Bronchopulmonary dysplasia and expiratory airflow at 8 years in children born extremely preterm in the post-surfactant era. Thorax. 78 (5), 484-488 (2022).
- Doyle, L. W., et al. Ventilation in extremely preterm infants and respiratory function at 8 Years. N Engl J Med. 377 (4), 329-337 (2017).
- Brozmanova, M., Hanacek, J., Tatar, M., Strapkova, A., Szepe, P. Effects of hyperoxia and allergic airway inflammation on cough reflex intensity in guinea pigs. Physiol Res. 51 (5), 529-536 (2002).
- Burghardt, J. S., Boros, V., Biggs, D. F., Olson, D. M. Lipid mediators in oxygen-induced airway remodeling and hyperresponsiveness in newborn rats. Am J Respir Crit Care Med. 154, 4 Pt 1 837-842 (1996).
- Mazurek, H., Haouzi, P., Belaguid, A., Marchal, F. Persistent increased lung response to methacholine after normobaric hyperoxia in rabbits. Respir Physiol. 99 (2), 199-204 (1995).
- Onugha, H., et al. Airway hyperreactivity is delayed after mild neonatal hyperoxic exposure. Neonatology. 108 (1), 65-72 (2015).
- Regal, J. F., Lawrence, B. P., Johnson, A. C., Lojovich, S. J., O'Reilly, M. A. Neonatal oxygen exposure alters airway hyper-responsiveness but not the response to allergen challenge in adult mice. Pediatr Allergy Immunol. 25 (2), 180-186 (2014).
- Mayer, C. A., et al. CPAP-induced airway hyper-reactivity in mice is modulated by hyaluronan synthase-3. Pediatr Res. 92 (3), 685-693 (2022).
- Ganguly, A., Martin, R. J. Vulnerability of the developing airway. Respir Physiol Neurobiol. 270, 103263(2019).
- Yee, M., Buczynski, B. W., O'Reilly, M. A. Neonatal hyperoxia stimulates the expansion of alveolar epithelial type II cells. Am J Respir Cell Mol Biol. 50 (4), 757-766 (2014).
- Balasubramaniam, V., Mervis, C. F., Maxey, A. M., Markham, N. E., Abman, S. H. Hyperoxia reduces bone marrow, circulating, and lung endothelial progenitor cells in the developing lung: implications for the pathogenesis of bronchopulmonary dysplasia. Am J Physiol Lung Cell Mol Physiol. 292 (5), L1073-L1084 (2007).
- Crystal, R. G., Randell, S. H., Engelhardt, J. F., Voynow, J., Sunday, M. E. Airway epithelial cells. Proc Am Thoracic Soc. 5 (7), 772-777 (2008).
- Whitsett, J. A. Airway epithelial differentiation and mucociliary clearance. Ann Am Thor Soc. 15, Supplement_3 S143-S148 (2018).
- Davis, J. D., Wypych, T. P. Cellular and functional heterogeneity of the airway epithelium. Mucosal Immunol. 14 (5), 978-990 (2021).
- Whitsett, J. A., Kalin, T. V., Xu, Y., Kalinichenko, V. V. Building and regenerating the lung cell by cell. Physiol Rev. 99 (1), 513-554 (2019).
- Maeda, H., et al. Involvement of miRNA-34a regulated Krüppel-like factor 4 expression in hyperoxia-induced senescence in lung epithelial cells. Respir Res. 23 (1), 340(2022).
- Zhu, Y., Mosko, J. J., Chidekel, A., Wolfson, M. R., Shaffer, T. H. Effects of xenon gas on human airway epithelial cells during hyperoxia and hypothermia. J Neonatal Perinatal Med. 13 (4), 469-476 (2020).
- Cao, X., et al. Invited review: human air-liquid-interface organotypic airway tissue models derived from primary tracheobronchial epithelial cells-overview and perspectives. In Vitro Cell Dev Biol - Animal. 57 (2), 104-132 (2021).
- Garcia, D., et al. Short exposure to hyperoxia causes cultured lung epithelial cell mitochondrial dysregulation and alveolar simplification in mice. Pediatr Res. 90 (1), 58-65 (2020).
- Crist, A. P., Hibbs, A. M. Prematurity-associated wheeze: current knowledge and opportunities for further investigation. Pediatr Res. 94 (1), 74-81 (2022).
- Lee, R. M., O'Brodovich, H. Airway epithelial damage in premature infants with respiratory failure. Am Rev Respir Dis. 137 (2), 450-457 (1988).
- Amonkar, G. M., et al. Primary culture of tracheal aspirate-derived human airway basal stem cells. STAR Protoc. 3 (2), 101390(2022).
- Shui, J. E., et al. Prematurity alters the progenitor cell program of the upper respiratory tract of neonates. Sci Rep. 11 (1), 10799(2021).
- Hillas, J., et al. Nasal airway epithelial repair after very preterm birth. ERJ Open Res. 7 (2), 00913-02020 (2021).
- Lu, J., et al. Rho/SMAD/mTOR triple inhibition enables long-term expansion of human neonatal tracheal aspirate-derived airway basal cell-like cells. Pediatr Res. 89 (3), 502-509 (2020).
- Jiang, D., Schaefer, N., Chu, H. W. Air-liquid interface culture of human and mouse airway epithelial cells. Meth Mol Biol. 1809, 91-109 (2018).
- You, K., et al. Moderate hyperoxia induces senescence in developing human lung fibroblasts. Am J Physiol Lung Cell Mol Physiol. 317 (5), L525-L536 (2019).
- Wang, H., et al. Severity of neonatal hyperoxia determines structural and functional changes in developing mouse airway. Am J Physiol Lung Cell Mol Physiol. 307 (4), L295-L301 (2014).
- Ravikumar, P., et al. α-Klotho protects against oxidative damage in pulmonary epithelia. Am J Physi-Lung Cell Mol Physiol. 307 (7), L566-L575 (2014).
- Hartman, W. R., et al. Oxygen dose responsiveness of human fetal airway smooth muscle cells. Am J Physiol Lung Cell Mol Physiol. 303 (8), L711-L719 (2012).
- Cadena-Herrera, D., et al. Validation of three viable-cell counting methods: Manual, semi-automated, and automated. Biotechnol Rep. 7, 9-16 (2015).
- Bodas, M., et al. Cigarette smoke activates NOTCH3 to promote goblet cell differentiation in human airway epithelial cells. Am J Respir Cell Mol Biol. 64 (4), 426-440 (2021).
- Srinivasan, B., et al. TEER measurement techniques for in vitro barrier model systems. J Lab Autom. 20 (2), 107-126 (2015).
- Jakubowski, W., Bartosz, G. 2,7-dichlorofluorescin oxidation and reactive oxygen species: what does it measure. Cell Biol Int. 24 (10), 757-760 (2000).
- Oksvold, M. P., Skarpen, E., Widerberg, J., Huitfeldt, H. S. Fluorescent histochemical techniques for analysis of intracellular signaling. J Histochem Cytochem. 50 (3), 289-303 (2002).
- Hewitt, R. J., et al. Lung extracellular matrix modulates KRT5(+) basal cell activity in pulmonary fibrosis. Nat Commun. 14 (1), 6039(2023).
- Hawkins, F. J., et al. Derivation of airway basal stem cells from human pluripotent stem cells. Cell Stem Cell. 28 (1), 79-95 (2021).
- Zou, X. L., et al. Down-expression of Foxj1 on airway epithelium with impaired cilia architecture in non-cystic fibrosis bronchiectasis implies disease severity. Clin Respir J. 17 (5), 405-413 (2023).
- Li, X., et al. Low CC16 mRNA expression levels in bronchial epithelial cells are associated with asthma severity. Am J Respir Crit Care Med. 207 (4), 438-451 (2023).
- Li, T., Wang, Y., Huang, S., Tang, H. The regulation mechanism of MUC5AC secretion in airway of obese asthma. Cell Mol Biol (Noisy-le-grand). 68 (7), 153-159 (2022).
- Nekooki-Machida, Y., Hagiwara, H. Role of tubulin acetylation in cellular functions and diseases). Med Mol Morphol. 53 (4), 191-197 (2020).
- Creagh, E. M., Conroy, H., Martin, S. J. Caspase-activation pathways in apoptosis and immunity. Immunol Rev. 193, 10-21 (2003).
- Abo, K. M., et al. Air-liquid interface culture promotes maturation and allows environmental exposure of pluripotent stem cell-derived alveolar epithelium. JCI Insight. 7 (6), e155589(2022).
- Guénette, J., Breznan, D., Thomson, E. M. Establishing an air-liquid interface exposure system for exposure of lung cells to gases. Inhal Toxicol. 34 (3-4), 80-89 (2022).
- Zhao, C., et al. Age-related STAT3 signaling regulates severity of respiratory syncytial viral infection in human bronchial epithelial cells. bioRxiv. , (2023).
- Lochbaum, R., et al. Retinoic acid signalling adjusts tight junction permeability in response to air-liquid interface conditions. Cellular Signalling. 65, 109421(2020).
- Jain, R., et al. Temporal relationship between primary and motile ciliogenesis in airway epithelial cells. Am J Respir Cell Mol Biol. 43 (6), 731-739 (2010).
- You, Y., et al. Role of f-box factor foxj1 in differentiation of ciliated airway epithelial cells. Am J Physiol Lung Cell Mol Physiol. 286 (4), L650-L657 (2004).
- Pan, J., You, Y., Huang, T., Brody, S. L. RhoA-mediated apical actin enrichment is required for ciliogenesis and promoted by Foxj1. J Cell Sci. 120, Pt 11 1868-1876 (2007).
- Teape, D., et al. Hyperoxia impairs intraflagellar transport and causes dysregulated metabolism with resultant decreased cilia length. Am J Physiol Lung Cell Mol Physiol. 324 (3), L325-L334 (2023).
- Hall, C. B. Respiratory syncytial virus and parainfluenza virus. N Engl J Med. 344 (25), 1917-1928 (2001).
- Guillien, A., et al. Determinants of immunoglobulin G responses to respiratory syncytial virus and rhinovirus in children and adults. Front Immunol. 15, 1355214(2024).
- Ito, K., Daly, L., Coates, M. An impact of age on respiratory syncytial virus infection in air-liquid-interface culture bronchial epithelium. Front Med (Lausanne). 10, 1144050(2023).
- Zimmermann, P., Curtis, N. Why does the severity of COVID-19 differ with age?: Understanding the mechanisms underlying the age gradient in outcome following SARS-CoV-2 infection. Pediatr Infect Dis J. 41 (2), e36-e45 (2022).
- Leung, C., Wadsworth, S. J., Yang, S. J., Dorscheid, D. R. Structural and functional variations in human bronchial epithelial cells cultured in air-liquid interface using different growth media. Am J Physiol Lung Cell Mol Physiol. 318 (5), L1063-L1073 (2020).
- Dieperink, H. I., Blackwell, T. S., Prince, L. S. Hyperoxia and apoptosis in developing mouse lung mesenchyme. Pediatric research. 59 (2), 185-190 (2006).
- Looi, K., et al. Preterm birth: Born too soon for the developing airway epithelium. Paediatr Respir Revi. 31, 82-88 (2019).
- Hilgendorff, A., Reiss, I., Ehrhardt, H., Eickelberg, O., Alvira, C. M. Chronic lung disease in the preterm infant. Lessons learned from animal models. Am J Respir Cell Mol Biol. 50 (2), 233-245 (2014).
Reprints and Permissions
Request permission to reuse the text or figures of this JoVE article
Request Permission