This protocol investigates the heterochromatin distribution in eight populations of Lycoris aurea (L′Her) Herb, using combined PI and DAPI chromosome staining, fluorescence in situ hybridization (FISH) with 18S-5.8-26S rRNA gene regions (45S rDNA regions), and 5S ribosomal DNA probes.
Method Article
Comparative Karyotype Analysis of Lycoris aurea Herb Populations Using Fluorochrome Banding and 45S and 5S rDNA-FISH
Opens in a new tab
In This Article
Summary
Loading...
$$\rightleftharpoonup{xx}$$
$$\longleftharp{xx}$$,
$$\longrightharp{xx}$$,
Abstract
Loading...
$$\rightleftharpoonup{xx}$$
$$\longleftharp{xx}$$,
$$\longrightharp{xx}$$,
To understand karyotype variation in eight populations, detailed karyotypes were meticulously established using chromosomal measurements, fluorescence bands, and rDNA FISH signals. The number of 45S rDNA sites varies from one to five pairs per population, with the most common number per karyotype being four pairs. The 45S rDNA locus is predominantly located in the short arms and terminal regions of chromosomes, while the 5S rDNA locus is found mainly in the short arm and the terminal or proximal regions. Populations HBWF, HNXN, HBBD, and HNZX showed a similar distribution of 45S rDNA sites, as did GXTL, HBFC, and SCLS, indicating a close relationship between populations with similar 45S rDNA site distributions. The karyotypes of all studied populations are symmetrical, comprising stable and metastable centromeres or exclusively stable centromeres. Scatter plots of MCA and CVCL effectively distinguish their karyotypic structures. The analysis includes six quantitative parameters (x, 2n, TCL, MCA, CVCL, CVCI). Additionally, the results indicate that PCoA based on these six parameters is a robust method for determining biological karyotype relationships among the eight populations. The chromosome number in Lycoris populations is x = 6-8. Based on the current study and literature, genomic differentiation of these populations is discussed in terms of genome size, heterochromatin, 45S and 5S rDNA sites, and karyotype asymmetry.
Introduction
Loading...
$$\rightleftharpoonup{xx}$$
$$\longleftharp{xx}$$,
$$\longrightharp{xx}$$,
Lycoris is a family that includes several important horticultural plants1. Lycoris aurea (L'Hér.) Herb. is a traditional Chinese medicinal plant with a long history. Phytochemical analysis has shown that Lycoris aurea (L′Her.) Herb contains galantamine and other alkaloids, which can enhance acetylcholine sensitivity and have the potential to treat Alzheimer's disease as cholinesterase inhibitors2.
In higher plants, karyotype analysis is crucial for integrating genetic and physical maps, with significant practical implications for plant biology. This analysis allows for chromosomal-level genome characterization, clarification of cellular taxonomic relationships between populations, identification of genetic aberrations, and understanding of chromosomal evolution trends3,4,5. Typically, a karyotype description includes chromosome number, absolute and relative chromosome lengths, primary and secondary constriction locations, heterochromatic fragment distribution, rDNA site numbers and locations, and other DNA sequence characteristics, as well as karyotype asymmetry6,7,8. Among karyotype parameters, asymmetry is determined by variations in chromosome length (interchromosomal asymmetry) and centromere position (intrachromosomal asymmetry). Karyotype asymmetry is a significant feature reflecting chromosome morphology and is widely used in plant cell taxonomy9,10,11,12.
Often, the absence of chromosome markers limits karyotype analysis and impedes the identification of individual chromosomes. In recent years, Giemsa staining, fluorescence banding, and fluorescence in situ hybridization (FISH) have become popular in plant chromosome analysis. Dual fluorescent staining methods, such as CMA (chromomycin A3) / DAPI (4, 6-diamino-2-phenylindole) staining and PI (propyl iodide) / DAPI staining (known as CPD staining), reveal GC-rich and AT-rich heterochromatic regions on chromosomes4,13. During metaphase or pachytene of plant mitosis, repeated DNA sequences or long DNA segments can generate specific signals in plant populations through FISH hybridization14,15,16.
Fluorescent bands and FISH signals provide useful markers for chromosome identification. By measuring chromosome length, analyzing fluorescence banding characteristics, and comparing FISH signal differences, detailed molecular cytogenetic karyotypes of different plant germplasms or populations can be constructed. These karyotypes effectively display chromosome morphology in various germplasms or populations, enabling comparisons of heterochromatin distribution and DNA sequence localization and encouraging further research4,8,17. Molecular cytogenetic karyotype comparisons can offer valuable insights into the phylogenetic relationships and chromosomal evolution of related populations8,14,18,19.
The Lycoris genus, a diverse and intriguing group within the Amaryllis family, is known for its perennial bulbs. Comprising approximately 20 species, 15 of which are endemic to China, it showcases rich biodiversity. This genus is found exclusively in warm temperate and subtropical regions of East Asia, including southwest China, southern Korea, and Japan, with a few populations extending to northern India and Nepal20. Early cytogenetic studies primarily involved chromosome counting to establish the genus's basic chromosome number and to describe chromosome morphology in specific populations, focusing largely on Lycoris radiata21. The total chromosome numbers observed in this genus range from 12 to 33 or 44, representing diploid, abnormal diploid, triploid, tetraploid, and aneuploid levels, respectively. The basic chromosome numbers, x, are 6, 7, 8, and 11.
Lycoris aurea (L'Hér.) Herb, a notable species within the Lycoris genus, is widely distributed throughout China22. It thrives in relaxed, moist environments and reproduces through small bulbs. These bulbs, containing lycorine and galantamine-two key medicinal compounds-have been used in traditional Chinese medicine for centuries. Lycoris aurea also captivates horticulturalists with its striking red flowers in the fall and evergreen leaves in the winter. However, the morphological similarity across all studied Lycoris aurea (L'Hér.) Herb populations present a significant challenge for chromosomal identification using conventional cytological methods.
Cloning of FISH, fosmid, or BAC (bacterial artificial chromosomes) with repetitive DNA sequences and oligonucleotide probes on metaphase or pachydermatous chromosomes has been used for karyotype analysis23,24,25, comparative cytogenetic analysis26,27, cytogenetic map construction28,29, and chromosome-specific assays30. Recently, the FISH technique has been applied to the chromosome analysis of Lycoris populations31. Although the chromosome number and karyotype vary in Lycoris populations, the total chromosome number remains constant, with three basic types observed: the central centromere chromosome (M-), the distal centromere chromosome (T-), and the proximal centromere chromosome (A-). Additionally, diverse chromosome shapes and sizes are observed in natural populations32.
RNA fluorescence in situ hybridization (FISH) is useful for detecting chromosomal changes, such as centromere fusion, inversion, gene amplification, and fragment deletion. Fluorescence In Situ Hybridization (RNA-FISH) technology enables high-resolution visual analysis of chromosomes to detect and identify multiple complex changes, including the fusion of chromosome central regions, formation of new chromosome structures, reversal of chromosomal regions, amplification of genes or gene fragments, and gene sequence loss on specific chromosome regions33. Five of the 500 clones showed strong FISH signals on the centromere region of the central centromere chromosome (M-) but not on the distal centromere chromosome (T-)34. The unique FISH signal distribution pattern on each chromosome enabled the identification of individual chromosomes, which had previously been challenging in Lycoris populations using traditional staining methods31. Currently, there are few studies on the molecular cytogenetics of Lycoris aurea (L'Hér.) Herb, emphasizing the urgent need for further research in this field.
In this study, eight well-differentiated metaphase chromosomes of Lycoris aurea (L'Hér.) Herb populations were prepared using enzyme immersion and flame drying (EMF) methods. CPD staining and 45S and 5S rDNA probes were used for FISH identification. Detailed molecular cytogenetic karyotypes of these populations were constructed using combined data from chromosomal measurements, fluorescent bands, and 45S and 5S rDNA FISH signals. Six different karyotypic asymmetry indices were calculated for each population to identify karyotypic relationships among them. Evaluation of the molecular cytogenetic karyotype data provided significant insights into the genomic differentiation and evolutionary relationships of the eight populations, potentially reshaping the understanding of Lycoris chromosomes.
Protocol
Loading...
$$\rightleftharpoonup{xx}$$
$$\longleftharp{xx}$$,
$$\longrightharp{xx}$$,
The reagents and equipment utilized in this study are detailed in the Table of Materials, while the probes employed are provided in Supplementary File 1.
1. Preparation of apical chromosomes
- Take root by hydroponics. After removing the above-ground part of the bulb, place it in a tapered bottle filled with water, replacing the water every 3 days, following the method described by Song et al.35.
- Excise actively growing root tips when they reach approximately 1.0-2.0 cm in length and treat them in saturated α-bromonaphthalene at 28 °C for 1.0 h.
- Cut the root tips to about 1 cm and place them in a freshly prepared mixture of methanol and glacial acetic acid in a 3:1 volume ratio at room temperature (about 20-25 °C) for 2-3 h. Then, store them in a refrigerator at 4 °C, as described by She et al.36.
- Wash the fixed root tips (2-3 mm) thoroughly in double-distilled water.
- Prepare a mixture of cellulase and pectin hydrolase in 0.01 mM citric acid-sodium citrate buffer at pH 4.5, with cellulase and pectin hydrolase each at 1%. Place the pre-treated root tips in the mixture and digest at 28 °C for 1.0-1.5 h.
- Wash the digested root tips with double-distilled water, transfer them onto a glass slide, and mash thoroughly with the fixative using fine-pointed forceps.
- Dry the slides over the flame of an alcohol lamp until the water mist just disappears. Under a phase-contrast microscope, select slides with more than five split phases and no overlapping chromosomes. Store the slides at -20 °C for future use.
2. CPD staining
- Prepare a CPD solution by adding PI and DAPI to a 30% (v/v) anti-fluorescence attenuator, where the concentration of PI is 0.6 µg·mL-1 and the concentration of DAPI is 3 µg·mL-1.
- Dry the chromosome slide at 65 °C for 30 min.
- Add 100 µL of RNase A diluent (the RNase A storage solution diluted 100 times with 2x SSC (saline sodium citrate), resulting in a final concentration of 100 µg/mL) per chromosome slide. Cover the slide and warm it in a 37 °C moist chamber for 30-60 min.
- Wash the chromosome slide with 2x SSC at room temperature for three intervals of 5 min each.
- Wash the chromosome slide at room temperature for 1-2 min.
- Add 200 µL of pepsin diluent (the pepsin storage solution diluted 100 times with 0.01 N HCl to achieve a final concentration of 5 µg/mL) per chromosome slide. Cover the slide and incubate it in a moist chamber at 37 °C for 5-20 min.
- Wash the chromosome sections with ultra-pure water at room temperature for 2 min, followed by washing with 2 xSSC at room temperature for two intervals of 5 min each.
- Fix the slides with methanol: glacial acetic acid (3:1) solution for 10 min.
- Wash with 2x SSC at room temperature for three intervals of 5 min each.
- Treat with 70%, 95%, and 100% ethanol at -20 °C for 5 min each, then dry at room temperature.
- Take the treated and dried chromosome slides, add 30 µL of CPD staining solution to each slide, cover with a 24 mm x 50 mm coverslip, and stain in the dark for more than 30 min. Extensive chromosome material should be stained overnight.
- Observe the chromosome slides under a fluorescence microscope, using a green excitation filter (WG) for PI staining and an ultraviolet filter (UV) for DAPI staining. Capture images with the compatible software.
- Adjust the exposure time through the two filters to achieve similar red and blue fluorescence intensities during image capture. The CPD image is obtained from the grayscale images stained with PI and DAPI. Chromosome measurements and image processing were performed using Adobe Photoshop software.
3. Fluorescence in situ hybridization
- Prepare the hybrid solution: FAD (10 µL), ssDNA (2 µL), 20× SSC (2 µL), 5S rDNA (1 µL), 45S rDNA (1 µL), and 50% glucan sulfate (4 µL). After preparation, centrifuge the hybrid solution (2500 x g, 5-10 min, at room temperature) and place it on ice.
- Place the scanned slides in the oven at 65 °C for 30-60 min.
- Remove the baked slides, add 100 µL of 70% FAD denaturation solution, cover with a cover glass, and denature in an 85 °C molecular hybridization furnace for 2.5 min.
- Remove the cover glass and immediately immerse the slides in 70%, 90%, and 100% cold ethanol, dehydrating successively for 5 min each.
- Remove the slides and allow them to dry at room temperature for more than 30 min.
- Add 20 µL of hybrid solution to the slide, gently place the cover glass on top until the liquid is completely diffused, and leave it at room temperature for 10 min to moisten the covered area of the slide.
- Place the slides in a hybrid dish soaked with 2× SSC (the hybrid dish should be a large Petri dish with a lid wrapped in tin foil to facilitate operation away from light) and incubate at 37 °C overnight (for at least 6 h).
- Counterstain the chromosomes by mounting them with 3 µg·mL-1 DAPI in a 30% (v/v) solution of Vectashield H-100. Capture the image using compatible software, with the blue fluorescence of DAPI excited by the purple light of the filter and the red fluorescence of PI excited by the green light, respectively.
NOTE: FISH hybridization was performed using 45S and 5S rDNA probes on previously CPD-stained slides, following the method described by She et al.36.
4. Karyotype analysis
- Select five metaphase mitotic cells for each population in which the chromosomes are well dispersed (with no overlapping) and moderately condensed (the chromosomes should not be maximally aggregated, but the ends should not be clumped together), following the methodology described by She et al.4.
- Determine the absolute length of each chromosome by selecting five chromosomes with the highest concentration during cell division.
- Meticulously and precisely measure the length of each chromosome's long arm (L) and short arm (S), as well as the size of each fluorescent pigment band on the chromosome.
- Calculate the following parameters: (1) relative chromosome length (RL, haploid percentage); (2) arm ratio (AR = L/S, long arm/short arm); (3) total haploid chromosome length (TCL; karyotype length); (4) average chromosome length (C); (5) size of the fluorescence band (the percentage of the fluorescence band relative to the length of the chromosome); (6) distance from the centromere to the rDNA site; (7) average centromere index (CI, calculated as the short arm length of each chromosome divided by the total length of that chromosome, then averaging these values); (8) four different indicators of karyotype asymmetry, including the centromere index (CVCI), coefficient of variation (CV), chromosome length coefficient of variation (CVCL), mean centromere asymmetry coefficient (MCA), and Stebbins asymmetry category.
NOTE: Refer to the methods of Paszko10 and Peruzzi et al.11 to calculate the asymmetry index. Classify chromosomes with different arm ratios according to Levan's five classification methods. Arrange the chromosomes of Lycoris aurea (L'Hér.) Herb in descending order of length as described in the Han et al. protocol37. - Ensure the precision and accuracy of the methodology by drawing chromosome karyotype patterns based on chromosome measurement data combined with fluorescence band information and the position and size of the rDNA-FISH.
- Visualizing the karyotype asymmetrical relationships of the eight populations is a key step that provides clear insights. This is achieved through two-dimensional scatter plots, which are used to obtain their MCA and CVCL.
- Perform principal coordinate analysis (PCoA) using the Gower similarity coefficient, a crucial component, following the methods of She et al.38.
- Calculate six quantitative parameters (x, 2n, TCL, MCA, CVCL, CVCI) to determine the cytogenetic karyotypes of the eight populations.
- Conduct statistical analyses using a data analysis and visualization program to generate the UPGMA-based dendrogram and PCoA scatter plot.
Results
Loading...
$$\rightleftharpoonup{xx}$$
$$\longleftharp{xx}$$,
$$\longrightharp{xx}$$,
By employing the meticulous enzyme immersion and flame drying (EMF) method, scattered and well-differentiated metaphase chromosomes of Lycoris aurea (L'Hér.) Herb were obtained, and the cytogenetic chromosome karyotype of Lycoris aurea was constructed (Figure 1). The metaphase chromosomes with the highest degree of condensation are unsuitable for karyotype analysis due to the reduced morphological differences. However, since the total length of haploid chromosomes (TCL) is comparable between populations, distinguishing the karyotypes of different Lycoris aurea populations is possible by comparing differences in TCL values. The karyotype characteristics and nuclear DNA content of eight populations of Lycoris aurea are shown in Table 1. The distribution of fluorescence bands and the locations of the 45S and 5S rDNA sites are presented in Table 2. Figure 2 displays the measurements of the chromosomes along with fluorescence banding characteristics and the location and size of the 45S and 5S rDNA FISH signals.
The diploid chromosome numbers are as follows: 2n = 16 = 8m + 8t for GXTL, 2n = 14 = 8m + 6t for HBFC, 2n = 14 = 8m + 6t for GZDS, 2n = 16 = 6m + 10t for HNZX, 2n = 14 = 8m + 6t for HBBD, 2n = 14 = 8m + 6t for HNXN, 2n = 16 = 6m + 10t for HBWF, and 2n + 1 = 15 = 7m + 8t for SCLS (Table 1). As described in the protocol by She et al.4, the metaphase chromosomes of the eight L. aurea populations are small, with mean chromosome lengths ranging from 1.01 µm (HNZX) to 2.08 µm (GZDS) and a TCL ranging from 16.14 µm (HNZX) to 29.13 µm (GZDS). The TCLs of the eight populations correlate with the reported nuclear DNA contents (Table 1). The smallest relative length range (RRL) is observed in HNXN (1.52-3.81), while the largest is seen in GZDS (2.73-5.86). Populations HNXN and GZDS exhibited the smallest and largest variation in chromosome length, respectively. The mean centromere index (CI) of the genome varied between 61.02 ± 5.63 (population HBFC) and 70.70 ± 4.63 (population HBWF). Population HBFC showed the least change in the centromere index, whereas population HBWF exhibited the most extensive changes.
The karyotypes are composed of metacentric (m) and telocentric (t) chromosomes (Table 1; Figure 2), representing the most common chromosome forms among the eight populations studied. The eight different karyotype asymmetry indices are provided in Table 1. Among these indices, the coefficient of variation of centromere index (CVCI) and mean centromere asymmetry (MCA) characterize intrachromosomal asymmetry, while the coefficient of variation of chromosome length (CVCL) measures interchromosomal asymmetry. The ranges for CVCI and MCA are as follows: CVCI = 10.97 (HBBD) to 18.25 (HBWF), and MCA = 28.85 (HNZX) to 39.30 (HBWF). These values consistently indicate that HBBD has the lowest and HBWF has the highest intrachromosomal asymmetry. The range for CVCL is 14.98 (GZDS) to 23.32 (HBWF), suggesting that GZDS exhibits the least asymmetrical karyotype, while HBWF displays the most asymmetrical karyotype among the eight populations. According to the classification principles of Stebbins9, these karyotypes belong to class 1B, indicating that all studied populations have relatively symmetric karyotypes.
The karyotype asymmetry relationships among the eight Lycoris aurea (L'Hérit.) Herb populations are illustrated using bidimensional scatter plots of CVCI versus CVCL and MCA versus CVCL (Figure 3). The karyotype structure of these populations, as revealed by the three pairs of parameters-CVCI, CVCL, and MCA-has significant implications. These parameters demonstrate similar karyotype asymmetries. The findings from the scatter plots highlight the research's potential impact, showing that population HNXN has the most symmetrical karyotype, while populations HBFC and HBWF exhibit the most intrachromosomal and interchromosomal asymmetries, respectively (Figure 3).
This study meticulously categorized the eight Lycoris aurea populations into three major groups based on the UPGMA tree diagram with five karyotype parameters (Figure 4). The first cluster, represented by population SCLS, forms an independent clade. The second group consists of HNXN and HBWF. The third cluster is divided into two subgroups: one contains only population HBFC, while the other includes populations HBWF, GZDS, and GXTL, with population HBBD and GZDS clustering in a smaller branch. The karyological relationships among the studied populations, as revealed by principal coordinate analysis (PCoA), are illustrated in Figure 5. The PCoA scatter plot indicates that the eight populations can be divided into two groups with a confidence level of 68.36%. The first group includes HBWF, HBBD, and GXTL, with the former three populations closely clustering together. The second group consists of HBFC, HNXN, HNZX, and SCLS, where HBFC occupies the middle position between the two groups, and SCLS is positioned most isolated (Figure 5).
CPD (combination of propidium iodide and DAPI) and DAPI (4',6-diamidino-2-phenylindole) reverse staining are standard techniques used to observe nuclear structure and chromatin distribution. The results of this study revealed apparent heterochromatin phenomena among eight populations of Lycoris aurea (L'Hérit.) Herb (Figure 1 and Figure 2; Table 2). FISH hybridization results for each population indicated that all chromosomal regions correspond to the 45S and 5S rDNA loci. The characteristics of the CPD bands are illustrated in Figure 1A,C,E,G,I,K,M,O.
In populations HBFC and HBBD, CPD bands were observed in the centromeric and pericentromeric regions (Figure 1G,K; Figure 2D,F). However, certain chromosomes did not display CPD bands: the 3rd and 8th chromosomes in SCLS, the 1st chromosome in HNXN, the 1st chromosome in HNZX, the 1st chromosome in HBWF, the 2nd chromosome in GZDS, and the 2nd chromosome in GXTL (Figure 1A,C,E,I,J,M,O; Figure 2A-C,E,G,H). Notably, CPD bands were also found on the terminals of the short arms of chromosome pairs 5, 6, and 7 in SCLS and HNXN, on pairs 4, 5, 6, 7, and 8 in HNZX, and on pairs 5, 6, and 7 in HBFC. Additionally, CPD bands were present on the short arm ends of chromosomes 4, 5, 6, 7, and 8 in HBWF, on the short arm ends of chromosomes 5, 6, and 7 in HBBD, and on the short arm ends of chromosomes 5, 6, 7, and 8 in GXTL (Figure 1A and Figure 2A).
After FISH hybridization, DAPI reverse staining formed bright fluorescent bands around the centric particles of chromosomes 5, 6, and 7 in GZDS. These bands, termed post-FISH DAPI+ bands, indicate that these heterochromatin regions contain a high number of A-T base pairs (Figure 2G). The range of (peri)centromeric CPD bands observed across the eight populations was 25.00% to 57.14% (Table 2), while the total amount of terminal CPD bands ranged from 40.00% to 71.43% (Table 2). In population GZDS, post-FISH DAPI+ bands correlated with karyotype length, accounting for 42.86% of the total. The sizes of rDNA CPD bands, non-rDNA CPD bands, and DAPI+ bands after FISH significantly differed among the various chromosome pairs of Lycoris aurea (L'Hérit.) Herb (Figure 2; Table 2).
The FISH technique was used to insert 45S and 5S rDNA probes into CPD-stained chromosomes, as illustrated in Figure 1. The summary of the number and location of 45S and 5S rDNA sites in the eight populations of Lycoris aurea (L'Hérit.) Herb is presented in Table 2 and depicted in Figure 2. Notably, significant differences in the number, size, and location of rDNA loci among the eight populations highlight the importance of these findings. In total, there were 30 45S rDNA loci across the eight populations. Of these, 4 loci (13.33%) were situated in the central centromere region, 9 (30.00%) in the near-central centromere region, and 17 (56.67%) in the terminal regions of their respective chromosome arms (Figure 2; Table 2).
In the GXTL population, one 45S rDNA locus signal was found in the centromere region of the short arm of chromosome 4, while four additional signals were located in the centromere region of the long arms of chromosomes 5, 6, 7, and 8 (Figure 1P; Figure 2G). In the HBFC population, one 45S rDNA locus was positioned in the centromere region on the short arm of chromosome 4, with three loci found in pericentromeric heterochromatin regions on the short arms of chromosomes 5, 6, and 8 (Figure 1H; Figure 2D). In the GZDS population, a 45S locus was located in the centromere region of the short arm of metacentric chromosome 4 (Figure 1N; Figure 2G). In HNZX, five 45S rDNA loci were observed in the terminal areas of the short arms of chromosome pairs 4, 5, 6, 7, and 8 (Figure 1H; Figure 2D). The distribution of 45S sites in HBBD (Figure 1J; Figure 2E) and HNXN (Figure 1L; Figure 2F) was similar, with one locus in the centromere region of the short arm of chromosome 4 and three loci in the centromere region of the short arms of chromosomes 5, 6, and 7.
In HBWF, five 45S rDNA loci signals appeared in the short arm centromere regions of chromosome pairs 4, 5, 6, 7, and 8 (Figure 1N; Figure 2G). In SCLS, one 45S rDNA locus signal was found in the short arm centromere regions of chromosome pairs 1 and 2, as well as in the pericentromeric regions of the short arms of chromosome pairs 5 and 6 (Figure 1P; Figure 2H). For the 5S rDNA loci, a total of nine were identified across the eight taxa, with 3 (33.33%) located in the proximal regions, 3 (33.33%) in the pericentromeric regions, and 3 (33.33%) in the terminal regions of the respective chromosome arms (Figure 2; Table 2). In GXTL, one 5S rDNA locus signal appeared near the terminal end of the long arm of chromosome pair 6 (Figure 1P; Figure 2G). The distribution of 5S sites was similar in HBFC (Figure 1H; Figure 2D) and GZDS (Figure 1N; Figure 2G), both containing one 5S rDNA locus in the proximal region of the short arm of chromosome 7. In HNZX, a 5S rDNA locus was found near the terminal end of the long arm of chromosome 8 (Figure 1H; Figure 2D), while in HBBD, a 5S rDNA locus was identified in chromosome 7 (Figure 1J; Figure 2E). In HBWF, two 5S rDNA loci appeared near the terminal end of the long arms of chromosomes 4 and 8, two more in the long arm of chromosome 7, one in the centromere region, and one near the end (Figure 1N; Figure 2G).
The combination of 45S and 5S rDNA FISH signals, along with terminal CPD segment characteristics, effectively distinguished all mitotic chromosomes from different populations of Lycoris aurea (L'Hérit.) Herb. In the SCLS, HBFC, HBBD, GZDS, and GXTL populations, chromosome 1 exhibited strong CPD signals in the centromeric region. Chromosome 2 displayed strong CPD signals in the centromeric region, with the exception of GZDS and GXTL. Chromosome 3 showed a strong CPD signal in the centromeric region, except for SCLS. Chromosome 4 consistently exhibited strong CPD signals in the centromeric region. For chromosomes 5, 6, and 7, strong CPD signals were observed at the ends of the short arms. Chromosome 4 also showed strong 45S rDNA signals at the end of the short arm, while chromosomes 5 and 6 had strong 45S signals in their terminal regions, except in GZDS. Notably, a strong DAPI signal was present in the GZDS population. Additionally, a weak 5S rDNA signal appeared in the proximal region of chromosome 7 in the HBFC, HBWF, HBBD, and GZDS populations.
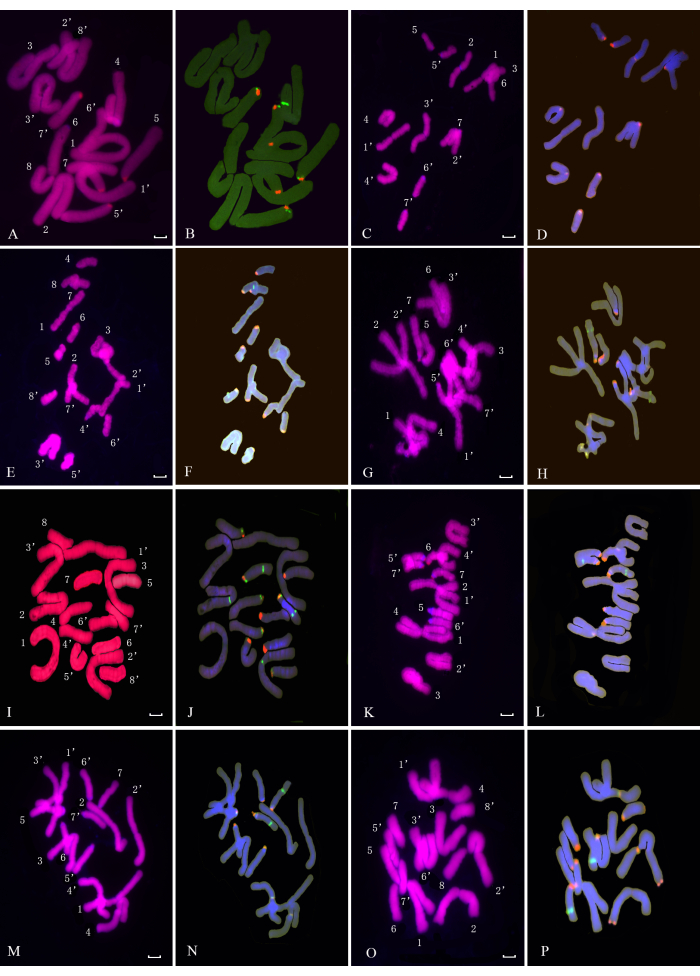
Figure 1: Mitotic chromosomes of eight Lycoris aurea (L' Hér.) Herb populations. Examination of mitotic metaphase chromosomes from eight different Lycoris aurea (L' Herit.) Herb populations is shown, including population SCLS (A,B), population HNXN (C,D), population HNZX (E,F), population HBFC (G,H), population HBWF (I,J), and population HBBD (K,L). Hybridization of GZDS (M,N) and GXTL (O,P) was performed using FISH with biotin-labeled 45S and digoxin-labeled 5S rDNA probes after CPD staining. The resulting images of chromosomes after CPD staining display 45S (green) and 5S (red) rDNA signals. Total DNA was reverse-dyed with DAPI dye, resulting in a blue color. Scale bars = 10 µm. Please click here to view a larger version of this figure.
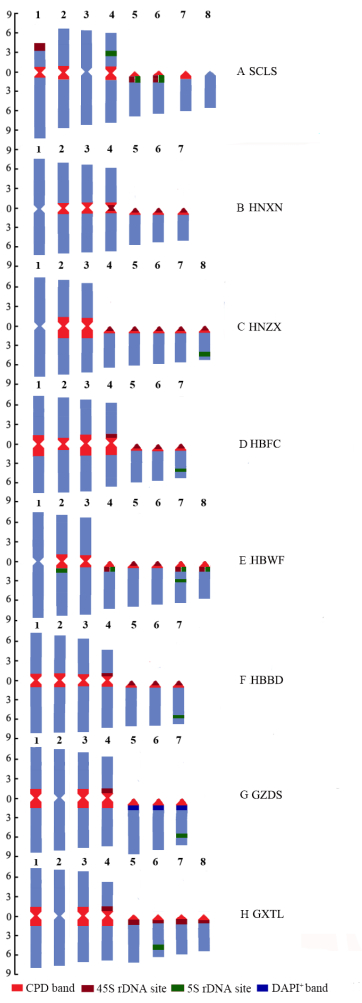
Figure 2: Chromosome karyotype diagrams of eight Lycoris aurea (L' Hér.) Herb populations. The chromosome pattern diagram for eight populations of Lycoris aurea (L' Herit.) Herb reveals fluorescence band characteristics, along with the location and size of 45S and 5S rDNA FISH signals. Populations SCLS, HNXN, HNZX, HBFC, HBWF, HBBD, GZDS, and GXTL are represented by (A-H), respectively. The ordinate scale indicates the relative length of the chromosome (the percentage of that chromosome in the haploid genome), and the number at the top indicates the serial number of the chromosome. Please click here to view a larger version of this figure.
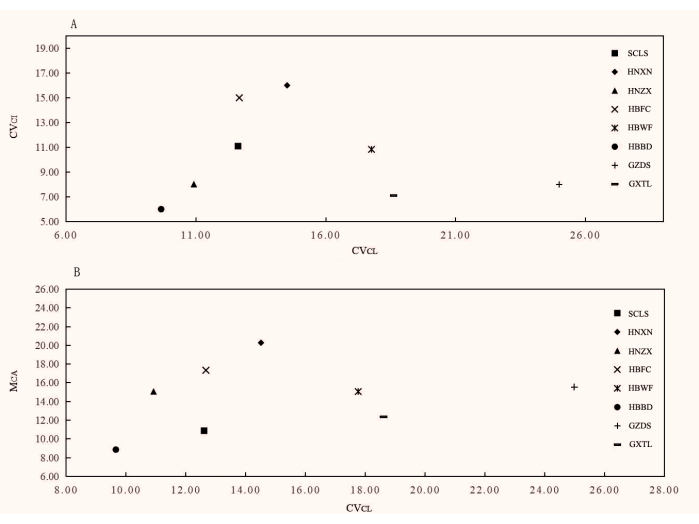
Figure 3: Scatter plots for eight Lycoris aurea (L' Hér.) Herb populations based on three karyotype parameters. (A) The CVCI index is plotted against the CVCL index. (B) The MCA index is plotted against the CVCL index. Populations SCLS, HNXN, HNZX, HBFC, HBWF, HBBD, GZDS, and GXTL are indicated. Please click here to view a larger version of this figure.
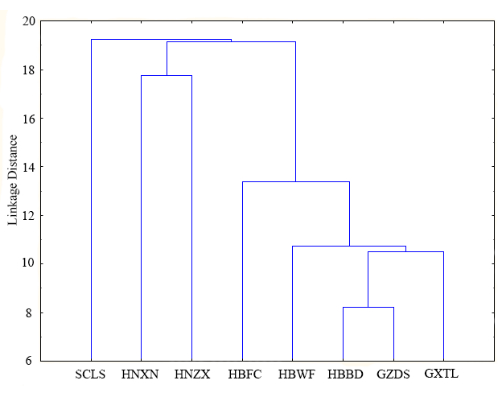
Figure 4: The UPGMA dendrogram of eight Lycoris aurea (L' Hér.) Herb populations. The UPGMA dendrogram is based on the parameters x, 2n, TCL, MCA, CVCL, and CVCI for the eight Lycoris aurea (L' Hér.) Herb populations: SCLS, HNXN, HNZX, HBFC, HBWF, HBBD, GZDS, and GXTL. Please click here to view a larger version of this figure.
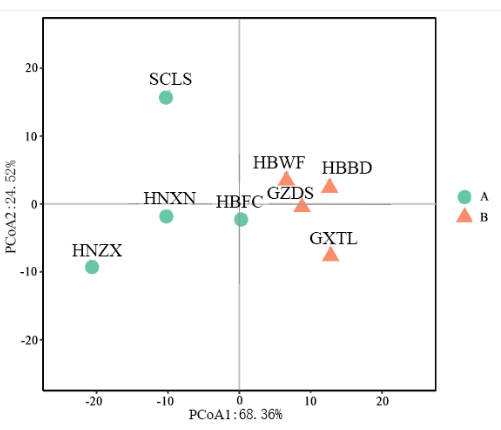
Figure 5: PCoA of the eight Lycoris aurea (L' Hér.) Herb varieties based on six karyotype parameters. The PCoA is based on the parameters x, 2n, TCL, MCA, CVCL, and CVCI, representing SCLS, HNXN, HNZX, HBFC, HBWF, HBBD, GZDS, and GXTL. Please click here to view a larger version of this figure.
Table 1: Names of eight Lycoris aurea (L' Hér.) Herb populations. Please click here to download this Table.
Table 2: Distribution of fluorochrome bands and rDNA sites in the eight Lycoris aurea (L' Hér.) Herb populations. Please click here to download this Table.
Supplementary File 1: The probes employed in this study. Please click here to download this File.
Discussion
Loading...
$$\rightleftharpoonup{xx}$$
$$\longleftharp{xx}$$,
$$\longrightharp{xx}$$,
The preparation of Lycoris aurea (L'Hér.) Herb root chromosomes involves several critical steps: (1) cultivating roots via hydroponics, (2) treating root tips with saturated α-bromonaphthalene, (3) fixing roots using an alcohol-acetic acid solution, (4) performing enzymatic hydrolysis on root tips with an enzyme solution, and (5) thoroughly squashing the digested roots and drying the slides over an alcohol lamp flame.
Accurate chromosome measurement is essential for karyotype analysis in cytogenetic studies. Chromosomes should exhibit noticeable condensation and clearly defined boundaries; otherwise, accurately calculating chromosome parameters becomes challenging5. Previous cytogenetic research has shown that the morphological differentiation of mitotic chromosomes depends on the degree of condensation4,36. When condensation is insufficient, the ends of chromosome arms may still be desagglutinated, leading to unclear chromosome boundaries. However, when chromosomes reach maximum condensation, morphological differences between chromosomes decrease. Therefore, selecting chromosomes with moderate condensation is crucial for chromosome identification and measurement, especially in populations with fewer chromosomes.
Probe labeling is crucial for successful FISH in situ hybridization, particularly for the 5S rDNA probe solution. Due to the short sequence of 5S rDNA, the concentration of target sequences labeled by PCR is typically low, leading to weak hybridization signals. Synthesizing fluorescein-labeled probes directly, however, produces stronger hybridization signals and simplifies the process. For the 45S rDNA probe solution, partial sequences from the 5.8S, 18S, and 25S rRNA coding regions of Arabidopsis thaliana were labeled at the 5' and 3' ends with 6-carboxyl-tetramethyl rhodamine (TAMRA) and then mixed. The fluorescein 5S rDNA probe solution was obtained using 1-59 and 60-118 nucleotide sequences from the Arabidopsis 5S rRNA gene coding region, with each sequence labeled at the 5' end with 6-carboxyl fluorescein (6-FAM), then mixed.
In this study, we leveraged the differences between DAPI and PI dyes in DNA binding and combined them to obtain clear fluorescent bands. PI (propidium iodide) dyes can penetrate cell membranes and bind to DNA molecules within cells. In contrast, DAPI (4',6-diamidino-2-phenylindole) preferentially binds to AT-rich DNA regions, providing clear, high-contrast staining. Due to these complementary properties, DAPI and PI are often used together, known as CPD staining, to gather information on both the nucleus and cytoplasm simultaneously. Differences in the presence, location, and size of CPD and DAPI+ bands revealed significant heterochromatin differentiation across the eight populations of Lycoris aurea. CPD staining showed heterochromatin regions rich in GC content both at centromeric and pericentromeric regions and within telocentric chromosomes.
The study of karyotype asymmetry is a popular, affordable, and widely used cytogenetic taxonomic approach that incorporates a range of parameters and indicators, including both qualitative and quantitative measures, Stebbins classification parameters, and various quantitative indices (e.g., Paszko10; Peruzzi et al.11). Among these, the R ratio and CVCL are used to measure chromosome asymmetry, while CVCI and MCA represent key indicators of chromosomal asymmetry. Notably, CVCL is considered a robust statistical parameter for estimating interchromosomal asymmetry10, and the Metric for Chromosomal Asymmetry (MCA) is recognized as an effective measure for assessing intrachromosomal asymmetry11. To best represent karyotype asymmetries between populations, a two-dimensional scatter plot is recommended, with two asymmetry estimators placed on the x- and y-axes, respectively, where each sample is represented as a point11,12. The results showed that two-dimensional scatter plots of CVCL vs. CVCI, as well as MCA vs. CVCL, effectively illustrate karyotype asymmetry relationships among the eight distinct populations of Lycoris aurea (L′Herit.) Herb, supporting the reliability of these indices in assessing chromosomal asymmetry.
To compare karyotypes and reconstruct karyological relationships among the eight populations, this study applied the methodology proposed by Peruzzi et al.11, using the parameters x, 2n, TCL, MCA, CVCL, and CVCI. The findings revealed that HBWF, GZDS, HBBD, and GXTL populations were closely related, with HBFC positioned between these groups. Consequently, PCoA based on these six parameters proved to be a highly effective method for differentiating relationships among the eight populations. However, certain complex patterns also emerged from the constructed molecular evolutionary tree. For example, while HNZX appeared closely related to HBWF in the molecular phylogenetic tree, it was more distantly related in the PCoA scatter plot. This complexity highlights the importance of employing multiple quantitative approaches to predict trends in karyotype evolution within Lycoris, supplementing molecular classification characteristics.
The plants for this study were sampled from central and western China, including Tianlin County, Guangxi Province (GXTL), Fang County, Hubei Province (HBFC), Dushan County, Guizhou Province (GZDS), Zixing County, Hunan Province (HNZX), Badong County, Hubei Province (HBBD), Xinning County, Hunan Province (HNXN), Wufeng County, Hubei Province (HBWF), and Lushan County, Sichuan Province (SCLS). A voucher specimen has been preserved at the Herbarium of Huaihua University. This study found that the combination of 45S and 5S rDNA FISH signals and terminal CPD segment characteristics effectively distinguished all mitotic chromosomes from different populations of Lycoris aurea (L′Herit.) Herb. The protocol presented here aims to investigate the heterochromatin distribution among different populations of Lycoris aurea (L′Herit.) Herb. CPD (a combination of PI and DAPI) and DAPI (4′,6-diamidino-2-phenylindole) reverse staining are established techniques for observing nuclear structure and chromatin distribution. The direct fluorescent labeling of 18S-5.8-26S rRNA gene regions (45S rDNA regions) and 5S ribosomal DNA for chromosome FISH hybridization is straightforward and provides robust hybridization signals. This qualitative distinction will be increasingly valuable in analyzing various populations.
This method is best suited for plant species capable of rapid root tip cultivation, as root tip culture is needed during active mitosis. Due to the short 5S sequence, the study used the 1-118bp nucleotide sequence of the 5S rRNA gene coding region of Arabidopsis thaliana as the 5S rDNA probe. Because of its short sequence and weak signal, this method is effective only for identifying species with relatively conserved bases in the 1-118bp region of the 5S rRNA gene. Selecting metaphase chromosomes with moderate condensation is crucial for the method's success. Chromosome condensation is closely related to the timing of root harvesting, pretreatment duration, and flame baking. Therefore, the technique requires precise control over each step to ensure experimental success.
Disclosures
Loading...
$$\rightleftharpoonup{xx}$$
$$\longleftharp{xx}$$,
$$\longrightharp{xx}$$,
The authors have declared that no competing interests exist.
Acknowledgements
Loading...
$$\rightleftharpoonup{xx}$$
$$\longleftharp{xx}$$,
$$\longrightharp{xx}$$,
This work was supported by the Natural Science Foundation of China (32070367).
Materials
| Name | Company | Catalog Number | Comments |
|---|---|---|---|
| Alcohol | Sangon Biotech (Shanghai) Co., Ltd. | A500737-0005 | (70%, 90%, 100%) |
| 1× TNT | Sangon Biotech (Shanghai) Co., Ltd. | B548108 | 1×, 10× |
| 2× SSC | Sangon Biotech (Shanghai) Co., Ltd. | B548109 | 2×, 20× |
| 45S rDNA | Sangon Biotech (Shanghai) Co., Ltd. | TAMRA is added to both ends (5 'and 3' ends) | |
| 4'6-diamidino-2-phenylindole(DAPI) | Sangon Biotech (Shanghai) Co., Ltd. | E607303 | 20ml |
| 5S rDNA | Sangon Biotech (Shanghai) Co., Ltd. | 5 'end plus 6-FAM(FITC) | |
| Adobe Photoshop software | Adobe Systems Incorporated | CS6 | |
| Alpha bromo-naphthalene | Sangon Biotech (Shanghai) Co., Ltd. | A602718 | Saturation |
| Anti-burnout agent | Sangon Biotech (Shanghai) Co., Ltd. | Vectashield H-1000 | 10 mL |
| Biochemical incubator | Shanghai Yiheng Scientific Instrument Co., LTD | LRH-70 | |
| Cellulase | Sangon Biotech (Shanghai) Co., Ltd. | A426068 | 10 g |
| Citric acid | Sangon Biotech (Shanghai) Co., Ltd. | A501702 | 10 g |
| Deionized formamide (FAD) | Sangon Biotech (Shanghai) Co., Ltd. | A600211-0500 | 0.7 |
| Dextran sulfate | Sangon Biotech (Shanghai) Co., Ltd. | A428229 | 10 mL |
| Fluorescence in situ hybridization instrument | USA/Abbott ThermoBrite | S500-24 | |
| Fluorescence microscope | Olympus China Co.ltd | BX60 | |
| Glacial acetic acid | Sangon Biotech (Shanghai) Co., Ltd. | A501931 | 500 mL |
| HCl | Aladdin Reagent Co. Ltd. (Shanghai) | H399657 | 500 mL |
| Ice machine | Dan Ding Shanghai International Trade Co., Ltd. | ST-70 | |
| Leica biological microscope | Germany Leica Instrument Co., LTD | DM6000B | |
| Methyl alcohol | Sangon Biotech (Shanghai) Co., Ltd. | A601617 | 500 mL |
| MetMorph software | Molecular Devices | Version 7.35 | |
| Oven | Thermo Scientific™ Heratherm™ | THM#51028152 | |
| Pectinase | Sangon Biotech (Shanghai) Co., Ltd. | A004297 | 10 g |
| Pepsin | Sangon Biotech (Shanghai) Co., Ltd. | 1.07185 | 100 g |
| Propidium iodide(PI) | Sangon Biotech (Shanghai) Co., Ltd. | A425259 | 1 g |
| RNaseA | Sangon Biotech (Shanghai) Co., Ltd. | R4642 | 10 mg |
| Salmon sperm DNA(ssDNA) | Aladdin Reagent Co. Ltd. (Shanghai) | D119871 | 1 g |
| Sodium citrate | Aladdin Reagent Co. Ltd. (Shanghai) | S189183 | 10 g |
| Statistica for Windows 10.0 | for statistical analysis |
References
Loading...
$$\rightleftharpoonup{xx}$$
$$\longleftharp{xx}$$,
$$\longrightharp{xx}$$,
- Conservation and sustainable use of crop wild relatives. Agric Ecosyst Environ. 121 (3), 245-255 (2007).">Heywood, V., Casas, A., Ford-Lloyd, B., Kell, S., Maxted, N. Conservation and sustainable use of crop wild relatives. Agric Ecosyst Environ. 121 (3), 245-255 (2007).
- Cloning and characterization of a tyrosine decarboxylase involved in the biosynthesis of galanthamine in Lycoris aurea. PeerJ. 7, e6729(2019).">Rong, W., Sun, J., Zhang, H., Wang, H., Liu, H. Cloning and characterization of a tyrosine decarboxylase involved in the biosynthesis of galanthamine in Lycoris aurea. PeerJ. 7, e6729(2019).
- Cytotaxonomy: The end of childhood. Plant Biosyst. 146 (3), 703-710 (2012).">Guerra, M. Cytotaxonomy: The end of childhood. Plant Biosyst. 146 (3), 703-710 (2012).
- Karyotype analysis of Lablab purpureus (L.) Sweet using fluorochrome banding and fluorescence in situ hybridization with rDNA probes. Czech J Genet Plant Breed. 51 (3), 110-116 (2015).">She, C. W., Qin, X., Lu, Y., Wang, H., Li, Y. Karyotype analysis of Lablab purpureus (L.) Sweet using fluorochrome banding and fluorescence in situ hybridization with rDNA probes. Czech J Genet Plant Breed. 51 (3), 110-116 (2015).
- Using carrot centromeric repeats to study karyotype relationships in the genus Daucus (Apiaceae). BMC Genomics. 22 (1), 508(2021).">Kadluczka, D., Grzebelus, E. Using carrot centromeric repeats to study karyotype relationships in the genus Daucus (Apiaceae). BMC Genomics. 22 (1), 508(2021).
- The role of chromosomal change in plant evolution. , Oxford Univ Press. 49-52 (2002).">Levin, D. A. The role of chromosomal change in plant evolution. , Oxford Univ Press. 49-52 (2002).
- Molecular cytogenetic characterization and comparison of the two cultivated Canavalia varieties (Fabaceae). Comp Cytogenet. 11 (4), 579-600 (2017).">She, C. W., Qin, X., Lu, Y., Wang, H., Li, Y. Molecular cytogenetic characterization and comparison of the two cultivated Canavalia varieties (Fabaceae). Comp Cytogenet. 11 (4), 579-600 (2017).
- Comparative molecular cytogenetic characterization of five wild Vigna varieties (Fabaceae). Comp Cytogenet. 14 (2), 243-264 (2020).">She, C. W., Qin, X., Lu, Y., Wang, H., Li, Y. Comparative molecular cytogenetic characterization of five wild Vigna varieties (Fabaceae). Comp Cytogenet. 14 (2), 243-264 (2020).
- Chromosomal evolution in higher plants. , Addison-Wesley. London. (1971).">Stebbins, G. L. Chromosomal evolution in higher plants. , Addison-Wesley. London. (1971).
- A critical review and a new proposal of karyotype asymmetry indices. Plant Syst Evol. 258 (1-2), 39-48 (2006).">Paszko, B. A critical review and a new proposal of karyotype asymmetry indices. Plant Syst Evol. 258 (1-2), 39-48 (2006).
- Karyotype asymmetry: Again, how to measure and what to measure. Comp Cytogenet. 7 (1), 1-9 (2013).">Peruzzi, L., Eroglu, H. Karyotype asymmetry: Again, how to measure and what to measure. Comp Cytogenet. 7 (1), 1-9 (2013).
- Karyotype and chromosome pairing analysis in some Iranian upland cotton (Gossypium hirsutum). Nucleus. 64 (2), 167-179 (2021).">Dehery, S. K., Tavakkoli, A., Jafari, M. Karyotype and chromosome pairing analysis in some Iranian upland cotton (Gossypium hirsutum). Nucleus. 64 (2), 167-179 (2021).
- Reverse fluorescent chromosome banding with chromomycin and DAPI. Chromosoma. 58 (4), 307-324 (1976).">Schweizer, D. Reverse fluorescent chromosome banding with chromomycin and DAPI. Chromosoma. 58 (4), 307-324 (1976).
- Quantitative karyotyping and dual color FISH mapping of 5S and 18S-25S rDNA probes in the cultivated Phaseolus varieties (Leguminosae). Genome. 42 (6), 1224-1233 (1999).">Moscone, E. A., Debat, H. J., Salguero, N. Quantitative karyotyping and dual color FISH mapping of 5S and 18S-25S rDNA probes in the cultivated Phaseolus varieties (Leguminosae). Genome. 42 (6), 1224-1233 (1999).
- Ribosomal DNA is an effective marker of Brassica chromosomes. Theor Appl Genet. 103 (4), 486-490 (2001).">Hasterok, R., Sliwinska, E., Kwasniewski, M. Ribosomal DNA is an effective marker of Brassica chromosomes. Theor Appl Genet. 103 (4), 486-490 (2001).
- Molecular cytogenetic mapping of GXTL and C. melo using highly repetitive DNA sequences. Chromosome Res. 18 (3), 325-336 (2010).">Koo, D. H., Han, Y., Lee, H. Molecular cytogenetic mapping of GXTL and C. melo using highly repetitive DNA sequences. Chromosome Res. 18 (3), 325-336 (2010).
- Karyotype diversity and the origin of grapefruit. Chromosome Res. 15 (1), 115-121 (2007).">De Moraes, A. P., Ferreira, J. P., Marques, R. Karyotype diversity and the origin of grapefruit. Chromosome Res. 15 (1), 115-121 (2007).
- Karyotype diversification and evolution in diploid and polyploid South American Hypochaeris (Asteraceae) inferred from rDNA localization and genetic fingerprint data. Ann Bot. 101 (7), 909-918 (2008).">Weiss-Schneeweiss, H., Kiefer, C., Schneider, H. Karyotype diversification and evolution in diploid and polyploid South American Hypochaeris (Asteraceae) inferred from rDNA localization and genetic fingerprint data. Ann Bot. 101 (7), 909-918 (2008).
- Cytogenetic characterization of endemics: Past and future. Plant Biosyst. 146 (3), 694-702 (2012).">Siljak-Yakovlev, S., Peruzzi, L. Cytogenetic characterization of endemics: Past and future. Plant Biosyst. 146 (3), 694-702 (2012).
- Reciprocal natural hybridization between Lycoris aurea and Lycoris radiata (Amaryllidaceae) identified by morphological, karyotypic, and chloroplast genomic data. BMC Plant Biol. 24 (1), 14-27 (2024).">Miaohua, Q., Wang, Y., Zheng, Y. Reciprocal natural hybridization between Lycoris aurea and Lycoris radiata (Amaryllidaceae) identified by morphological, karyotypic, and chloroplast genomic data. BMC Plant Biol. 24 (1), 14-27 (2024).
- Phylogenetic relationships and possible hybrid origin of Lycoris varieties (Amaryllidaceae) revealed by its sequences. Biochem Genet. 44, 198-208 (2006).">Shi, S., Wang, Y., Yu, J. Phylogenetic relationships and possible hybrid origin of Lycoris varieties (Amaryllidaceae) revealed by its sequences. Biochem Genet. 44, 198-208 (2006).
- Characterization, validation, and cross-species transferability of EST-SSR markers developed from Lycoris aurea and their application in genetic evaluation of Lycoris species. BMC Plant Biol. 20 (1), 522-528 (2020).">Yumai, J., Wang, Y., Zheng, H. Characterization, validation, and cross-species transferability of EST-SSR markers developed from Lycoris aurea and their application in genetic evaluation of Lycoris species. BMC Plant Biol. 20 (1), 522-528 (2020).
- Karyotype analysis of a Korean cucumber cultivar (Cucumis sativus L. cv. Winter Long) using C-banding and bicolor fluorescence in situ hybridization. Molecules Cells. 13 (3), 413-418 (2002).">Koo, D. H., Shin, D., Lee, J. Karyotype analysis of a Korean cucumber cultivar (Cucumis sativus L. cv. Winter Long) using C-banding and bicolor fluorescence in situ hybridization. Molecules Cells. 13 (3), 413-418 (2002).
- Dual-color FISH karyotype and rDNA distribution analyses on four Cucurbitaceae species. Hortic Environ Biotechnol. 53 (1), 49-56 (2012).">Waminal, N. E., Kim, H. H. Dual-color FISH karyotype and rDNA distribution analyses on four Cucurbitaceae species. Hortic Environ Biotechnol. 53 (1), 49-56 (2012).
- Localization of 45S and 5S rDNA sequences on chromosomes of 20 varieties of Cucurbitaceous plants. J South China Agric Univ. 40 (6), 74-81 (2019).">Xie, W. J., Yang, X., Wang, F. Localization of 45S and 5S rDNA sequences on chromosomes of 20 varieties of Cucurbitaceous plants. J South China Agric Univ. 40 (6), 74-81 (2019).
- Centromere repositioning in cucurbit varieties: Implication of the genomic impact from centromere activation and inactivation. Proc Natl Acad Sci USA. 106 (35), 14938-14941 (2009).">Han, Y., Zhang, H., Zhu, C. Centromere repositioning in cucurbit varieties: Implication of the genomic impact from centromere activation and inactivation. Proc Natl Acad Sci USA. 106 (35), 14938-14941 (2009).
- Cytogenetic relationships among Citrullus varieties in comparison with some genera of the tribe Benincaseae (Lycoris aurea (L' Hér.) Herb) as inferred from rDNA distribution patterns. BMC Evol Biol. 16, 85(2016).">Li, K. P., Yao, S., Li, Y. Cytogenetic relationships among Citrullus varieties in comparison with some genera of the tribe Benincaseae (Lycoris aurea (L' Hér.) Herb) as inferred from rDNA distribution patterns. BMC Evol Biol. 16, 85(2016).
- An integrated genetic and cytogenetic map of the cucumber genome. PLoS One. 4 (6), e5795(2009).">Ren, Y., Huang, H., Zhang, Z. An integrated genetic and cytogenetic map of the cucumber genome. PLoS One. 4 (6), e5795(2009).
- An integrated molecular cytogenetic map of Cucumis sativus L. chromosome. BMC Genet. 12, 18(2011).">Han, Y., Wang, H., Liu, B. An integrated molecular cytogenetic map of Cucumis sativus L. chromosome. BMC Genet. 12, 18(2011).
- Chromosome-specific painting in Cucumis varieties using bulked oligonucleotides. Genetics. 200 (3), 771-779 (2015).">Han, Y., Zhang, H., Yu, C. Chromosome-specific painting in Cucumis varieties using bulked oligonucleotides. Genetics. 200 (3), 771-779 (2015).
- Chromosomal variations of Lycoris varieties revealed by FISH with rDNAs and centromeric histone H3 variant associated DNAs. PLoS One. 16 (9), e0258028(2021).">Liu, M. S., Zhang, S., Liu, Q. Chromosomal variations of Lycoris varieties revealed by FISH with rDNAs and centromeric histone H3 variant associated DNAs. PLoS One. 16 (9), e0258028(2021).
- Genetic variations in Lycoris radiate var. radiate in Japan. Genes Genet Syst. 80, 199-221 (2005).">Hayashi, A., Murota, K., Murata, J. Genetic variations in Lycoris radiate var. radiate in Japan. Genes Genet Syst. 80, 199-221 (2005).
- Fluorescence in situ hybridization: Methods and application in cancer diagnosis. Cancer Immunol. 2, 711-728 (2020).">Nima, R. Fluorescence in situ hybridization: Methods and application in cancer diagnosis. Cancer Immunol. 2, 711-728 (2020).
- Cytogeography and chromosomal variation of the endemic East Asian herb Lycoris radiate. Ecol Evol. 9, 6849-6859 (2019).">Liu, K., Yang, X., Wang, J. Cytogeography and chromosomal variation of the endemic East Asian herb Lycoris radiate. Ecol Evol. 9, 6849-6859 (2019).
- Comparisons of G-banding patterns in six species of the Poaceae. Hereditas. 121, 31-38 (1994).">Song, Y. C., Zhang, L., Yan, B. Comparisons of G-banding patterns in six species of the Poaceae. Hereditas. 121, 31-38 (1994).
- CPD staining: An effective technique for detection of NORs and other GC-rich chromosomal regions in plants. Biotechnic Histochem. 81 (1), 13-21 (2006).">She, C. W., Zhou, M., Zhang, L. CPD staining: An effective technique for detection of NORs and other GC-rich chromosomal regions in plants. Biotechnic Histochem. 81 (1), 13-21 (2006).
- Distribution of the tandem repeat sequences and karyotyping in cucumber (Cucumis sativus L.) by fluorescence in situ hybridization. Cytogenet Genome Res. 122 (1), 90-98 (2008).">Han, Y. H., Kim, J., Yoon, M. Distribution of the tandem repeat sequences and karyotyping in cucumber (Cucumis sativus L.) by fluorescence in situ hybridization. Cytogenet Genome Res. 122 (1), 90-98 (2008).
- Comparative karyotype analysis of eight Cucurbitaceae crops using fluorochrome banding and 45S rDNA-FISH. Comp Cytogenet. 17, 31-58 (2023).">Chao-Wen, S., Chen, Z., Wang, S. Comparative karyotype analysis of eight Cucurbitaceae crops using fluorochrome banding and 45S rDNA-FISH. Comp Cytogenet. 17, 31-58 (2023).
Reprints and Permissions
Request permission to reuse the text or figures of this JoVE article
Request Permission