Biofilms of the bacterial pathogen Clostridioides difficile and their significance in disease are not well understood. Recent findings have suggested a role in recurrence, underscoring their importance. Here, we describe the adaptation of a biofilm assay coupled to a metabolic readout with applications for drug discovery against biofilms.
Method Article
Biofilm Assay for Clostridioides difficile with Applications for Drug Discovery
* These authors contributed equally
Opens in a new tab
In This Article
Summary
Loading...
$$\rightleftharpoonup{xx}$$
$$\longleftharp{xx}$$,
$$\longrightharp{xx}$$,
Abstract
Loading...
$$\rightleftharpoonup{xx}$$
$$\longleftharp{xx}$$,
$$\longrightharp{xx}$$,
Clostridioides difficile is a gastrointestinal bacterial pathogen able to take advantage of a dysbiotic microbiota environment to proliferate, secrete toxins, and damage the intestinal epithelium. A subset of C. difficile infection (CDI) patients will experience antibiotic (15%-30%) or fecal microbiota transplant (FMT) (<10%) treatment failure. Therefore, the development of additional therapeutic interventions is of critical importance. The role of C. difficile biofilms in recurrence is unclear. However, biofilms in other organisms are responsible for chronic and relapsing disease, suggesting this could also be the case in recurrent CDI. We hypothesize that biofilms of C. difficile present a valuable therapeutic target. The goal of the protocol presented here is to adapt a biofilm formation assay for the identification of repositionable compounds with activity against established C. difficile biofilms. The protocol refines a robust and reproducible assay for forming biofilms, couples it to a metabolic assay, and applies it to drug discovery. This protocol outlines the biofilm formation assay, biomass and metabolic activity readouts, drug susceptibility testing, drug screening of a repositioning library, and representative results.
Introduction
Loading...
$$\rightleftharpoonup{xx}$$
$$\longleftharp{xx}$$,
$$\longrightharp{xx}$$,
Clostridioides difficile is a spore-forming, anaerobic bacterial pathogen capable of inflicting severe damage to the human gastrointestinal (GI) tract by producing toxins. C. difficile is responsible for nearly half a million cases yearly, with ~30,000 fatalities (CDC, 2015). C. difficile infection (CDI) treatment adds a significant cost to the already strained healthcare system (~$4.8 billion)1,2,3. Individuals most at risk are those with immunosuppression, antibiotic exposure, and/or the elderly, all populations that continue to significantly expand both in the U.S. and around the globe 4,5,6,7.
C. difficile is highly dependent on the status of the host GI microbiota, and as such, antibiotic treatment is a key predisposing factor for CDI. The identification of antibiotic-resistant clinical isolates of C. difficile further complicates treatment8,9,10. Moreover, between 15% and 30% of patients treated with antibiotics for CDI will fail initial treatment5,11,12,13,14,15,16. Once a patient experiences a recurrence episode, the likelihood of recurrence episodes increases to 45%-64% (recurrence escalator) and is accompanied by an increased risk of further treatment failures16,17. Importantly, most relapse cases of CDI are caused by the original strain that established the first episode of infection in the host18,19, suggesting continued colonization by C. difficile even after successful treatment. While spores have been shown to persist in the GI tract and lead to relapse in ex vivo and murine models20, C. difficile biofilms and their role in disease and relapse are underexplored. Biofilms are microbial communities protected by a self-produced extracellular matrix, a characteristic that makes them highly recalcitrant to environmental insults such as antibiotic treatment and immune responses21. Further, biofilm formation is a significant virulence factor22,23,24,25 and in bacterial infections, such as those caused by Staphylococcus aureus and Pseudomonas aeruginosa, biofilms are key in recurrence and chronic manifestations26,27. Recently, C. difficile biofilms have been suggested as a reservoir for recurrent infections28,29,30 and therefore represent a high-value target for the treatment and/or prevention of CDI recurrence.
Current models to study C. difficile biofilms include colony biofilm models31,32, microfermentors33, chemostat gut models34,35, and liquid culture systems using flasks or well-plates36,37. All these models have yielded key information about C. difficile biofilms at distinct stages of development and in distinct environments. However, some of these models (i.e., microfermentors, chemostat gut models, colony biofilms) are not suitable for drug discovery efforts. To date, most studies involving drug discovery efforts have focused on the planktonic lifestyle of C. difficile38,39,40,41. Therefore, the protocol described here aims to adapt, standardize, and validate the existing 96-well plate biofilm model with the goal of developing a platform for screening libraries to identify repositionable molecules with the ability to kill established (24 h old) C. difficile biofilms. Validation of the protocol was performed by comparing biofilm formation capabilities between a laboratory-adapted strain (630 Δerm) and an epidemic clinical isolate (UK1 strain isolated during a 2006 outbreak at Stoke-Mandeville Hospital in the United Kingdom42). Biofilm formation was quantified using the classical Crystal violet assay to measure biomass and a metabolic assay to measure the viability of the biofilms. Significant differences in biofilm formation capabilities between the strains were identified, suggesting potential clinical implications. Further, the assay was utilized to determine antibiotic susceptibility profiles of established biofilms. Lastly, as proof of concept, the Global Health Priority box from Medicines for Malaria Venture (MMV), a non-profit organization focused on discovering new therapies against neglected diseases such as malaria, was screened to identify compounds with activity against established biofilms of C. difficile. The protocol described here adapts and validates a classical biofilm assay for use as a drug screening platform targeting mature biofilms.
Protocol
Loading...
$$\rightleftharpoonup{xx}$$
$$\longleftharp{xx}$$,
$$\longrightharp{xx}$$,
1. Preparing cells for the biofilm assay
CAUTION: Clostridioides difficile is a human pathogen and requires BSL-2 containment.
NOTE: Spores utilized for this study were acquired from Dr. Carol Kumamoto at Tufts University School of Medicine. C. difficile spore stocks were prepared as previously described43,44,45. Spores are then aliquoted as 10 µL volumes into PCR tubes for streaking out plates. All media and Phosphate Buffer Saline (PBS) required for the experiment should be pre-reduced in the anaerobic chamber 24 h prior to use. This is accomplished by loosening the cap of the bottle containing the media or PBS inside the chamber.
- Pre-reduce a Brain Heart Infusion agar plate supplemented with 0.1% (w/v) taurocholate and 0.1% (w/v) L-cysteine (BHIS) in the anaerobic chamber, preferably overnight or for at least 3 h to allow for full reduction. Set the temperature of the anaerobic chamber to 37 °C.
- Heat the PCR tube containing 10 µL of spores for 20 min at 70 °C. This can be done in a water bath or thermocycler.
- Bring spores into the anaerobic chamber, mix by gently pipetting 5x-6x, and pipette 10 µL on the pre-reduced BHIS plate. Perform a four-quadrant streak as previously described46, and incubate the plate overnight at 37 °C (temperature of the anaerobic chamber).
- After 24 h of growth, isolated colonies should be visible. Select a single colony and, using a disposable loop, transfer to a tube containing 10 mL of BHIS liquid. Incubate overnight (14-18 h).
- Determine cell density by serially diluting the overnight culture in the chamber.
- Perform 10-fold dilutions of the overnight culture. The 103 dilution yields a countable sample for each of the strains utilized in this protocol. However, standardization of this step might be required for clinical isolates with growth differences.
- Bring the tubes out of the anaerobic chamber, place 10 µL of each sample in a hemocytometer, and count using a brightfield microscope as described by the hemocytometer manufacturer.
- Follow the manufacturer's instructions to determine cell concentration after counting.
2. Biofilm formation
NOTE: While this protocol is adaptable to distinct well sizes, it was optimized for the 96-well platform. If the well size is modified, the cell concentration will need to be adjusted based on the surface area of the well.
- After determining the cell concentration from the overnight culture, adjust the cell concentration to 1 x 10⁷ cells/mL in BHIS (supplemented with 10% (w/v) L-cysteine and 0.1M glucose).
NOTE: The 0.1M glucose supplementation has previously been shown to increase biofilm formation by the C. difficile 630 Δerm strain47. For this protocol, the concentration of 1 x 10⁷ cells/mL was selected after testing distinct starting concentrations (Figure 1). Robust biofilm formation can still be achieved without glucose supplementation. - Dispense 100 µL of cells into the wells of a 96-well microtiter plate (flat bottom and tissue culture treated), leaving control (cells only) and blank (media only) columns. Incubate for 24 h in the anaerobic chamber (37 °C).
- If media evaporation becomes an issue, place biofilm plates away from any heating unit. Alternatively, place biofilms inside an additional container or cover with permeable 96-well plate membranes.
- Gently remove the media from all the wells, starting with the blank. This will remove non-adherent cells and leave behind a biofilm. This step is crucial as only cells within the biofilm are of interest.
- Gently wash the biofilms 2x with 200 µL of pre-reduced PBS. To perform this wash gently, tilt the 96-well plate slightly, insert the pipette tips against the wall of the well, slide the tips close to the bottom of the well without scraping the bottom, and slowly aspirate. If PBS is left at the bottom, repeat the process again. At this stage, non-adherent cells can be removed, and it is normal. Remove the PBS before taking the plate out of the anaerobic chamber.
- At this point, use biofilms for: Biomass measurements (See Step 3); metabolic activity measurements (See Step 4); drug susceptibility and drug screening assays (See Step 5).
NOTE: This protocol has been validated for the lab adapted 630 Δerm strain and the epidemic UK1 strain. Distinct clinical isolates and strains might display weak biofilm forming capabilities. To minimize biofilm disruption, wash with PBS 1x instead of 2x and reduce washing volume to 100 µL.
3. Measurement of biofilm biomass using the Crystal violet assay
NOTE: Crystal violet staining was based on a previously described protocol48.
- After washing the biofilms in the anaerobic chamber (see step 2.4), remove the plate and transfer it to a chemical fume hood.
- To fix the biofilms, gently add 150 µL of methanol to each well. Cover the plate with the lid for 10 min.
- Remove methanol and allow wells to completely dry with the lid removed. This should take between 30 min and 45 min.
- Add 100 µL of 0.3% Crystal violet to all wells and stain for 10 min. Remove Crystal violet carefully to prevent staining of the well rim and walls, as this can impact readout.
- Allow the plate to dry with the lid removed. This should take between 30 min to 45 min.
- Wash the wells 3x with 200 µL of distilled water and allow the plate to dry completely. This should take 30 to 45 minutes.
- Once dry, use a brightfield microscope to image the biofilms (Figure 2A). While this step is optional, it allows for more thorough observation of the cells in the biofilm.
- Place the 96-well plate on an inverted brightfield microscope with a plate adaptor. Identify representative wells for each strain tested.
- Take images for each well at the desired magnification. The images presented in this protocol were taken at 40x magnification.
- Once the desired images have been acquired, transfer the plate back to a chemical fume hood for de-staining.
- To de-stain the biofilm, add 150 µL of 33% acetic acid and place on a shaker at medium speed for 10 min.
- Remove 90 µL from each well and transfer to a new 96-well flat-bottom plate. Read absorbance at 595 nm using a plate reader (Figure 2B).
4. Measurement of biofilm viability using the metabolic dye PrestoBlue
- Conduct the measurement of metabolic activity following the manufacturer's protocol for the assay with key modifications. Warm the plate reader to 37 °C before preparing the biofilms for the assay. A plate reader capable of measuring fluorescence is recommended.
NOTE: Alternatively, metabolic activity can be read at OD600; however, we have not found that approach to be sensitive enough for these assays. It is recommended that users review the manufacturer's protocol and standardize if necessary. - After washing the biofilms with PBS in the anaerobic chamber as described above (see step 2.4), remove the plate from the chamber.
- Along with the plate, remove 9 mL of pre-reduced BHIS (supplemented with 10% (w/v) L-cysteine and 0.1 M glucose).
- Quickly add 1 mL of PrestoBlue reagent to 9 mL of pre-reduced BHIS and vortex. Do not pre-reduce the reagent as this can affect reagent coloration (See Discussion).
- Add 100 µL of BHIS-PrestoBlue mixture to each well. Place the plate in a plate reader with the following settings: Temperature at 37 °C, assay type as Kinetic; read time as 30 min; read frequency at every 2 min; fluorescence intensity depending on the type of plate reader available. The measurements described in this protocol were performed using excitation/emission wavelengths of 560 nm/ 590 nm, respectively.
- After reading, discard the plates.
- Once fluorescence values are acquired from the plate readouts, use blank (media only) wells to subtract the noise from all sample wells. After this, divide the biofilm wells treated with each compound by the control well containing an untreated (100%) biofilm to obtain metabolic activity.
5. Addition of drugs to biofilms
NOTE: The setup described below can be modified for drug susceptibility assays and fixed concentration drug screening. For both methods described below, the PrestoBlue assay is recommended.
- Determination of minimum inhibitory concentrations (MIC) of distinct antibiotics
NOTE: Biofilms are handled over a 48 h period, increasing the possibility of contamination. It is of high importance to process blank wells first and follow aseptic procedures. MIC values reported in the literature for other C. difficile strains and test dose response assays were used to inform starting antibiotic concentrations for the MIC assays presented in this protocol. This approach will be useful for determining starting antibiotic concentrations when working with clinical isolates.- Wash the mature (24 h old) biofilms with PBS in the anaerobic chamber as described above (See step 2.4).
- Add 200 µL of pre-reduced BHIS (supplemented with 10% (w/v) L-cysteine and 0.1M glucose) media containing two-fold dilutions of the test antibiotic to each well except the control (cells only) and blank (media only) columns in the plate.
- Incubate for an additional 24 h. In this study, vancomycin (starting concentration of 200 µg/mL), metronidazole (starting concentration of 16 µg/mL), and fidaxomicin (starting concentration of 4 µg/mL) were utilized to validate the assay. MIC values are reported in Table 1.
- To prevent drying of plates, keep away from the heating unit in the anerobic chamber or use a gas permeable membrane.
NOTE: Alternatively, a pre-reduced PBS or media moat (300 µL) could be used on the outer wells of the plate. - After 24 h of incubation with the drugs, remove the media and gently wash the biofilms 1x with PBS. Process biofilms using the Crystal violet assay or the PrestoBlue assay.
- Screening drug libraries
- Wash the mature (24 h old) biofilms with PBS in the anaerobic chamber as described above (See step 2.4).
- Add 200 µL of media containing a fixed concentration of drug library compounds to each well except the control (cells in media without antibiotics) and blank (media without antibiotics) columns in the plate. Incubate for an additional 24 h. To prevent drying of plates, keep away from the heating unit in the anerobic chamber.
- After 24 h of incubation with the drugs, remove the media and gently wash the biofilms 1x with PBS. Process biofilms using the Crystal violet assay or the metabolic assay.
Results
Loading...
$$\rightleftharpoonup{xx}$$
$$\longleftharp{xx}$$,
$$\longrightharp{xx}$$,
The aim of the protocol described above is to adapt and validate the 96-well plate biofilm formation model as a drug screening platform for the identification of repositionable compounds with activity against established biofilms of C. difficile. The impact of distinct cell densities (104, 105, 106, and 107 cells/mL) on biofilm formation was determined, and biofilm formation was quantified by Crystal violet staining as previously described48. The findings from these studies suggest that biofilm formation by C. difficile 630 Δerm (lab-adapted strain) was comparable between all starting cell densities. The cell density of 1 x 10⁷ cells/mL was selected for these studies.
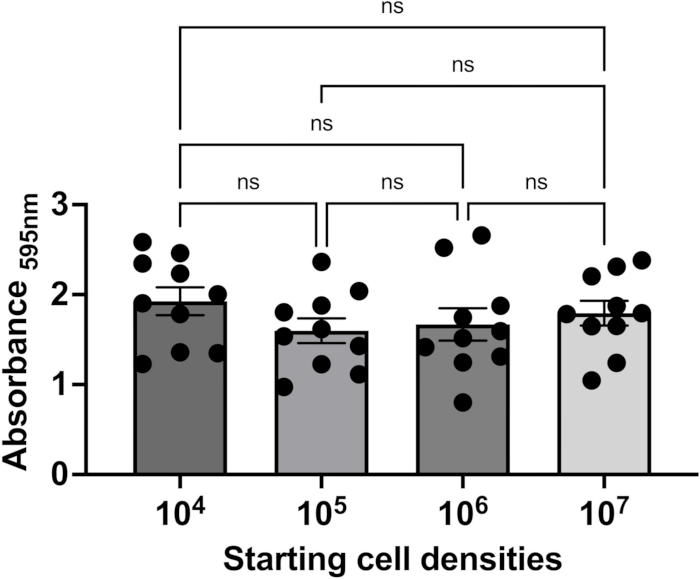
Figure 1: Optimization of cell concentrations for C. difficile biofilm formation. Distinct starting cell concentrations were tested to determine the impact on biofilm formation. The C. difficile 630 Δerm strain was grown overnight in BHIS, serially diluted, and counted using a hemocytometer. Cell concentrations were then adjusted to seed a 96-well flat-bottom microtiter plate at concentrations of 104, 105, 106, or 107 cells/well in BHIS + 0.1M glucose and allowed to form biofilms for 24 h at 37 °C in an anaerobic chamber. After 24 h, the plates were gently washed with PBS, fixed with methanol, and stained with Crystal Violet to measure biofilm biomass. Groups were compared using a One-way ANOVA. *p < 0.05; **p < 0.01; ***p < 0.001; ****p < 0.0001. Representative results of three experimental trials (biological replicates) with multiple technical replicates. Error bars represent the mean with standard error. Please click here to view a larger version of this figure.
After a starting cell density was selected, the biofilm-forming capabilities of the C. difficile UK1 strain, an epidemic strain isolated during a 2006 outbreak at Stoke-Mandeville Hospital in the United Kingdom42, and the lab-adapted strain 630 Δerm were compared. A significant difference in biofilm formation capabilities was identified, with UK1 biofilms containing higher biomass compared to 630 Δerm (Figure 2A). This difference was quantified after de-staining and measuring the absorbance (Figure 2B). To further quantify differences in biofilm-forming capabilities between the two strains, a metabolic assay was utilized. The findings from these studies show a significant difference in metabolic activity between the two strains (Figure 2C). Overall, the combination of these two assays shows significant differences in biofilm-forming capabilities between the two strains, which could translate to clinical implications. Lastly, these findings also underscore the potential of these assays for characterizing biofilm-forming capabilities between distinct C. difficile strains or isolates as the assays are low cost and reproducible.
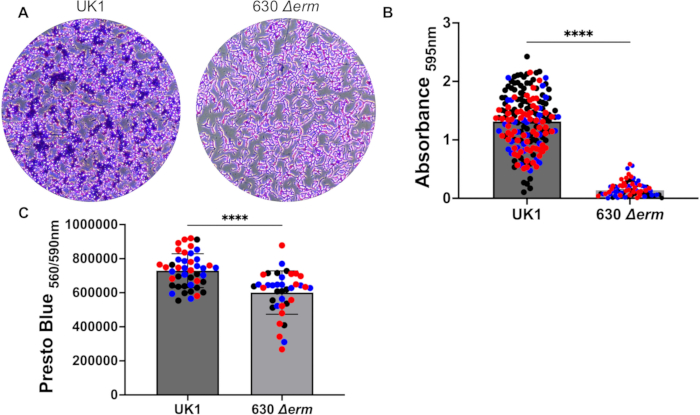
Figure 2: Characterization of C. difficile biofilm biomass and metabolic activity. Biofilm-forming capabilities of the C. difficile strains 630 Δerm and UK1 were compared. Both strains were grown on flat-bottom 96-well microtiter plates in BHIS + 0.1M glucose and incubated for 24 h at 37 °C in an anaerobic chamber. After 24 h, media was removed, and biofilms were gently washed with PBS. For biofilm biomass measurements, biofilms were fixed with methanol, stained with Crystal Violet, and de-stained with acetic acid, and biomass was quantified by measuring absorbance at 595 nm. (A, B) Images of Crystal Violet-stained biofilms were taken at 40x magnification with an inverted brightfield microscope. (C) Metabolic activity was measured by fluorescence (560/590 nm). Groups were compared using a Mann-Whitney test. *p < 0.05; **p < 0.01; ***p < 0.001; ****p < 0.0001. Representative results of three experimental trials (biological replicates) with multiple technical replicates. Each trial has been labeled with a distinct color (Trial 1: black, Trial 2: blue, and Trial 3: red). Error bars represent the mean with standard error. Please click here to view a larger version of this figure.
Using the biofilm assay described above and the metabolic assay as a readout for biofilms and OD600 for planktonic cells, the susceptibility of both C. difficile strains to commonly used antibiotics for the treatment of CDI was tested (Table 1). Significant differences in antibiotic susceptibility were identified between the strains, with UK1 being 10 times more resistant to fidaxomicin compared to 630 Δerm in the planktonic lifestyle and 16 times more resistant in the biofilm lifestyle. Further, both strains displayed similar sensitivities to metronidazole in both planktonic and biofilm lifestyles. Lastly, only UK1 in the biofilm lifestyle displays an increased MIC50 value in the presence of vancomycin. These findings highlight important differences between the lab-adapted strain and the epidemic strain and serve as a starting point to investigate their clinical relevance.
| Antibiotics | MIC50 (µg/mL) | |||
| Planktonic | Biofilm | |||
| 630 Δerm | UK1 | 630 Δerm | UK1 | |
| Vancomycin | 1.5 | 1.8 | 1.5 | 6.25 |
| Metronidazole | ~10 | 16 | >16 | >16 |
| Fidaxomicin | 0.0156 | 0.1 | 0.125 | 2 |
Table 1: MIC50 values of clinically relevant antibiotics against C. difficile.
This assay was adapted and refined for the purpose of screening repositioning libraries against established C. difficile biofilms with the goal of identifying biofilm-active compounds. After the optimization and validation described above, the assay was used to screen the Global Health Priority box from Medicines for Malaria Venture (MMV, Switzerland), containing 240 repositionable compounds with activity against drug-resistant malaria, neglected zoonotic disease, and vector species. Biofilms were formed for 24 h as described above, washed gently with PBS, and individual compounds were added to each biofilm at a concentration of 10 µM. Biofilms were incubated for a further 24 h in the presence of the compounds. After incubation, the media was removed, biofilms were washed gently with PBS, and the metabolic assay was performed. The screen was conducted in duplicate, and a hit was defined as having ≥ 50% reduction in metabolic activity. From this screen, a total of 16 candidates meeting this cutoff were detected (Figure 3). Among the candidates, MMV1793194 (73.25% reduction in metabolic activity), MMV1577459 (98.86%), MMV1577459 (93.04%), and MMV974630 (82.32%) were found to have the highest anti-biofilm activity, while the rest of the hits were in the range of 50%-65% activity. While most of the hits were in the insecticide category and are predicted to display toxicity towards mammalian cells, these findings support the use of this assay for high-content screening of both small-molecule and repositioning libraries.
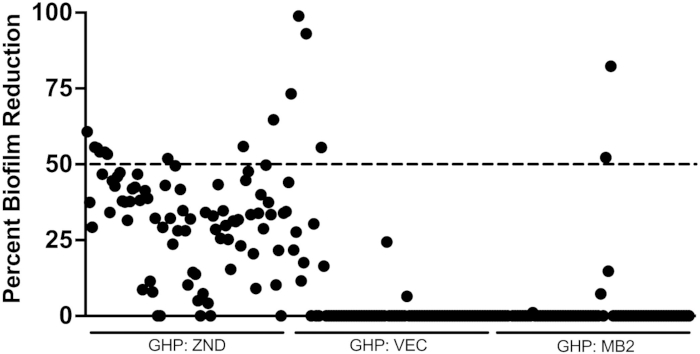
Figure 3: Screening of the Global Health Priority box against mature C. difficile biofilms. C. difficile biofilms were formed in BHIS + 0.1M glucose for 24 h at 37 °C in an anaerobic chamber. After 24 h, media were removed, biofilms were gently washed with PBS, and fresh media containing compounds from the library at a final concentration of 10 µM was added. Biofilms were then incubated for an additional 24 h. Biofilm viability was measured using the metabolic assay. Percent biofilm reduction was plotted on the Y-axis. Specific plates present in the Global Health Priority box are shown on the X-axis. Each dot on the graph is a distinct compound. Please click here to view a larger version of this figure.
Discussion
Loading...
$$\rightleftharpoonup{xx}$$
$$\longleftharp{xx}$$,
$$\longrightharp{xx}$$,
C. difficile biofilm formation and the role it plays in disease are not well understood. Recent findings suggest a role for biofilms in disease relapse28,34. Biofilm formation is a significant virulence factor22,23,24,25 and in bacterial infections, such as those caused by Staphylococcus aureus and Pseudomonas aeruginosa, biofilms are key in recurrence and chronic manifestations26,27, suggesting that this could also be the case for CDI. Therefore, C. difficile biofilms could prove to be a valuable therapeutic target for CDI recurrence. The protocol described here adopts a 96-well microtiter plate biofilm formation assay for the purpose of screening drug libraries to identify repositionable compounds with activity against established C. difficile biofilms. We describe the validation of this protocol by comparing biofilm biomass, metabolic activity, and drug susceptibility of two distinct strains (630 Δerm and UK1) and screening a repositioning library from the MMV, highlighting the applicability of this protocol for drug discovery targeted at C. difficile biofilms.
Optimization experiments were conducted to determine the necessary cell densities for biofilm formation, as previous studies on C. difficile biofilms vary in measurement strategies (OD600 vs. counting) and starting concentrations utilized 34,36,37,47,49. Cell counting was the approach selected to determine cell concentration over OD600 because of the accuracy and reproducibility of the approach from lab to lab. Ten-fold dilutions ranging from 107 to 104 cells/mL were used to seed cells for biofilm formation (Figure 1). No significant differences were identified in biofilm formation 24 h after seeding, and 1 x 10⁷ cells/mL was selected for the studies. Protocol users should optimize cell concentrations for the strains of interest.
Above, we highlight representative results which demonstrate distinct biofilm forming capabilities between the 630 Δerm and UK1 strains, something that was expected and has been previously reported for C. difficile clinical isolates50. Results from the Crystal violet assay show that the epidemic strain, UK1, forms a highly robust biofilm with higher biomass compared to the laboratory-adapted strain, 630 Δerm (Figure 2A,B). While a significant difference in metabolic activity was detected between the two strains, the implications of this are less clear and could indicate differences in growth patterns in the biofilm lifestyle between the strains (Figure 2C).
A key step in this protocol is the metabolic assay readout. The addition of the metabolic dye to the biofilms and incubation in the anaerobic chamber was not reliable, as colorimetric changes did not occur as expected in the absence of oxygen. To circumvent this issue, the biofilms were washed inside the anaerobic chamber and then removed from the chamber along with pre-reduced culture media. The metabolic dye was diluted in the pre-reduced culture media following the manufacturer's protocol (1:10), immediately added to the biofilms, and read in the plate reader as described above. This modification allows for proper reduction of the metabolic dye and a reproducible readout without affecting biofilm viability, as shown in Figure 2C.
Antibiotic susceptibility was measured for both planktonic and biofilm lifestyles of both strains using a dose-response assay to determine the minimum inhibitory concentration (MIC) index for vancomycin, metronidazole, and fidaxomicin, three common antibiotics used for the treatment of CDI. The MIC planktonic assays were measured using OD600, while the MIC biofilm assays were measured using a metabolic assay. The UK1 strain displayed lower susceptibility to fidaxomicin (10 times more resistant in the planktonic lifestyle and 16 times more resistant in the biofilm lifestyle) compared to 630 Δerm (Table 1), highlighting key differences with potential clinical implications.
As a proof of principle, the Global Health Priority box from MMV was screened against established C. difficile biofilms using a metabolic assay as a readout. The box contains 240 repositionable compounds with activity against drug-resistant malaria, neglected zoonotic disease, and vector species. A total of 16 compounds displaying ≥ 50% reduction in biofilm metabolic activity were identified (Figure 3), further validating this protocol and underscoring the applicability for drug screening against established C. difficile biofilms. While the assay described here focuses on established C. difficile biofilms, it can be easily modified to extend or shorten biofilm formation length by adjusting incubation times after seeding. This modification would allow for characterization of repositionable compound activity against distinct stages of biofilm development. An important caveat of this protocol is that cells within a biofilm exhibit distinct metabolic properties, and a metabolic assay will only detect metabolically active cells. Therefore, there is a possibility that live cells will still be present even if a compound displays significant activity. However, the assay is designed to allow for a rapid drug screen followed by further validation and characterization using dose-response assays.
In summary, this protocol is valuable as it describes the screening of a drug library and the identification of molecules with activity against C. difficile biofilms.
Disclosures
Loading...
$$\rightleftharpoonup{xx}$$
$$\longleftharp{xx}$$,
$$\longrightharp{xx}$$,
The authors have no conflicts to disclose.
Acknowledgements
Loading...
$$\rightleftharpoonup{xx}$$
$$\longleftharp{xx}$$,
$$\longrightharp{xx}$$,
J.A.R. designed the study and protocol and wrote the manuscript. A.S. and P.Z. conducted the experiments and helped refine the protocol. This work was supported by start-up funds from The University of Texas at San Antonio (UTSA) to J.A.R., and A.S. was supported by the UTSA MARC program (T34GM145507). The authors would like to acknowledge Medicines for Malaria Venture (MMV, Switzerland) for providing the Global Health Priority Box library.
Materials
| Name | Company | Catalog Number | Comments |
|---|---|---|---|
| ACETIC ACID SAF-CT ACS 500ML | Fisher Scientific | A38S500 | |
| AGAR BACTERIOLOGICAL GR 1KG | Fisher Scientific | AC443570010 | |
| BioTek Synergy H1 plate reader | Fisher Scientific | BTH1MG | |
| BOTTLE YEAST EXTRACT 500G | Fisher Scientific | DF0127179 | |
| BRAIN HEART INFUSION BROTH | Fisher Scientific | CM1135R | |
| Crystal Violet USP grade 100G | VWR | 97061-850 | For staining biofilms for biomass assays |
| CytoOne 96-well TC plate, flat bottom, clear, indiv.wrapped withlids, 50/case | USA Scientific | CC7682-7596 | |
| D-(+)-Glucose, anhydrous | Fisher Scientific | 50712744 | |
| Dimethyl Sulfoxide for Molecular Biology (DMSO) | Millipore Sigma | D8418-250ML | |
| FIDAXOMICIN 250MG | Fisher Scientific | AC468312500 | |
| L-CYSTEINE 98+% 1KG | Fisher Scientific | AAA104350B | For C. difficile media |
| METHANOL 99.8 ACROSEAL 1LT | Fisher Scientific | AC364390010 | |
| METRONIDAZOLE, 99% 5GR | Fisher Scientific | AC210340050 | |
| Phosphate buffer saline (PBS) 10X | Fisher Scientific | BP3991 | |
| PrestoBlue Cell Viability Reagent | Fisher Scientific | A13262 | |
| SILVERSEAL OPAQUE ADHES 100/CS | Fisher Scientific | 7000379 | Used to seal mother and daughter drug plates before storage |
| SODIUM TAUROCHOLATE 100MG | VWR | 100291-598 | |
| VANCOMYCIN | Fisher Scientific | BP29581 |
References
Loading...
$$\rightleftharpoonup{xx}$$
$$\longleftharp{xx}$$,
$$\longrightharp{xx}$$,
- Burden of Clostridium difficile on the healthcare system. Clin Infect Dis. 55 (Suppl 2), S88-S92 (2012).">Dubberke, E. R., Olsen, M. A. Burden of Clostridium difficile on the healthcare system. Clin Infect Dis. 55 (Suppl 2), S88-S92 (2012).
- Burden of Clostridium difficile infection in the United States. N Engl J Med. 372 (9), 825-834 (2015).">Lessa, F. C., et al. Burden of Clostridium difficile infection in the United States. N Engl J Med. 372 (9), 825-834 (2015).
- Clinical and healthcare burden of multiple recurrences of Clostridium difficile infection. Clin Infect Dis. 62 (5), 574-580 (2016).">Sheitoyan-Pesant, C., et al. Clinical and healthcare burden of multiple recurrences of Clostridium difficile infection. Clin Infect Dis. 62 (5), 574-580 (2016).
- Risk factors for recurrence, complications and mortality in Clostridium difficile infection: A systematic review. PLoS One. 9 (6), e98400(2014).">Abou Chakra, C. N., Pepin, J., Sirard, S., Valiquette, L. Risk factors for recurrence, complications and mortality in Clostridium difficile infection: A systematic review. PLoS One. 9 (6), e98400(2014).
- Treatment of Clostridium difficile-associated disease: Old therapies and new strategies. Lancet Infect Dis. 5 (9), 549-557 (2005).">Aslam, S., Hamill, R. J., Musher, D. M. Treatment of Clostridium difficile-associated disease: Old therapies and new strategies. Lancet Infect Dis. 5 (9), 549-557 (2005).
- Meta-analysis of antibiotics and the risk of community-associated Clostridium difficile infection. Antimicrob Agents Chemother. 57 (5), 2326-2332 (2013).">Brown, K. A., Khanafer, N., Daneman, N., Fisman, D. N. Meta-analysis of antibiotics and the risk of community-associated Clostridium difficile infection. Antimicrob Agents Chemother. 57 (5), 2326-2332 (2013).
- Clostridium difficile, the difficult "kloster" fuelled by antibiotics. Curr Microbiol. 76 (6), 774-782 (2019).">Dicks, L. M. T., Mikkelsen, L. S., Brandsborg, E., Marcotte, H. Clostridium difficile, the difficult "kloster" fuelled by antibiotics. Curr Microbiol. 76 (6), 774-782 (2019).
- Antimicrobial resistance in Clostridioides (Clostridium) difficile derived from humans: A systematic review and meta-analysis. Antimicrob Resist Infect Control. 9 (1), 158(2020).">Sholeh, M., et al. Antimicrobial resistance in Clostridioides (Clostridium) difficile derived from humans: A systematic review and meta-analysis. Antimicrob Resist Infect Control. 9 (1), 158(2020).
- Update on antimicrobial resistance in Clostridium difficile: Resistance mechanisms and antimicrobial susceptibility testing. J Clin Microbiol. 55 (7), 1998-2008 (2017).">Peng, Z., et al. Update on antimicrobial resistance in Clostridium difficile: Resistance mechanisms and antimicrobial susceptibility testing. J Clin Microbiol. 55 (7), 1998-2008 (2017).
- Prevalence and antimicrobial resistance pattern of Clostridium difficile among hospitalized diarrheal patients: A systematic review and meta-analysis. PLoS One. 17 (1), e0262597(2022).">Dilnessa, T., Getaneh, A., Hailu, W., Moges, F., Gelaw, B. Prevalence and antimicrobial resistance pattern of Clostridium difficile among hospitalized diarrheal patients: A systematic review and meta-analysis. PLoS One. 17 (1), e0262597(2022).
- Treatment of recurrent Clostridium difficile colitis: A narrative review. Gastroenterol Rep (Oxf). 6 (1), 21-28 (2018).">Hopkins, R. J., Wilson, R. B. Treatment of recurrent Clostridium difficile colitis: A narrative review. Gastroenterol Rep (Oxf). 6 (1), 21-28 (2018).
- Treatment of antibiotic-associated pseudomembranous colitis. Rev Infect Dis. 6 (Suppl 1), S235-S241 (1984).">Bartlett, J. G. Treatment of antibiotic-associated pseudomembranous colitis. Rev Infect Dis. 6 (Suppl 1), S235-S241 (1984).
- Treatment of Clostridioides difficile infection: From guidelines to clinical practice. Rev Esp Quimioter. 35 (Suppl 3), 97-101 (2022).">Merino, E., Salavert, M. Treatment of Clostridioides difficile infection: From guidelines to clinical practice. Rev Esp Quimioter. 35 (Suppl 3), 97-101 (2022).
- Increasing risk of relapse after treatment of Clostridium difficile colitis in Quebec, Canada. Clin Infect Dis. 40 (11), 1591-1597 (2005).">Pepin, J., et al. Increasing risk of relapse after treatment of Clostridium difficile colitis in Quebec, Canada. Clin Infect Dis. 40 (11), 1591-1597 (2005).
- Treatment of first recurrence of Clostridium difficile infection: Fidaxomicin versus vancomycin. Clin Infect Dis. 55 (Suppl 2), S154-S161 (2012).">Cornely, O. A., Miller, M. A., Louie, T. J., Crook, D. W., Gorbach, S. L. Treatment of first recurrence of Clostridium difficile infection: Fidaxomicin versus vancomycin. Clin Infect Dis. 55 (Suppl 2), S154-S161 (2012).
- Breaking the cycle: Treatment strategies for 163 cases of recurrent Clostridium difficile disease. Am J Gastroenterol. 97 (7), 1769-1775 (2002).">Mcfarland, L. V., Elmer, G. W., Surawicz, C. M. Breaking the cycle: Treatment strategies for 163 cases of recurrent Clostridium difficile disease. Am J Gastroenterol. 97 (7), 1769-1775 (2002).
- A randomized placebo-controlled trial of Saccharomyces boulardii in combination with standard antibiotics for Clostridium difficile disease. JAMA. 271 (24), 1913-1918 (1994).">Mcfarland, L. V., et al. A randomized placebo-controlled trial of Saccharomyces boulardii in combination with standard antibiotics for Clostridium difficile disease. JAMA. 271 (24), 1913-1918 (1994).
- Relapse versus reinfection: Surveillance of Clostridium difficile infection. Clin Infect Dis. 53 (10), 1003-1006 (2011).">Kamboj, M., et al. Relapse versus reinfection: Surveillance of Clostridium difficile infection. Clin Infect Dis. 53 (10), 1003-1006 (2011).
- Relapse versus reinfection: Recurrent Clostridium difficile infection following treatment with fidaxomicin or vancomycin. Clin Infect Dis. 55 (Suppl 2), S104-S109 (2012).">Figueroa, I., et al. Relapse versus reinfection: Recurrent Clostridium difficile infection following treatment with fidaxomicin or vancomycin. Clin Infect Dis. 55 (Suppl 2), S104-S109 (2012).
- Entry of spores into intestinal epithelial cells contributes to recurrence of Clostridioides difficile infection (vol 12, 1140, 2021). Nat Commu. 13 (1), 2456(2021).">Castro-Cordova, P., et al. Entry of spores into intestinal epithelial cells contributes to recurrence of Clostridioides difficile infection (vol 12, 1140, 2021). Nat Commu. 13 (1), 2456(2021).
- "It takes a village": Mechanisms underlying antimicrobial recalcitrance of polymicrobial biofilms. J Bacteriol. 202 (1), e00530-e00619 (2019).">Orazi, G., O'toole, G. A. "It takes a village": Mechanisms underlying antimicrobial recalcitrance of polymicrobial biofilms. J Bacteriol. 202 (1), e00530-e00619 (2019).
- Bacterial biofilms in nature and disease. Annu Rev Microbiol. 41, 435-464 (1987).">Costerton, J. W., et al. Bacterial biofilms in nature and disease. Annu Rev Microbiol. 41, 435-464 (1987).
- Bacterial biofilms: A common cause of persistent infections. Science. 284 (5418), 1318-1322 (1999).">Costerton, J. W., Stewart, P. S., Greenberg, E. P. Bacterial biofilms: A common cause of persistent infections. Science. 284 (5418), 1318-1322 (1999).
- Biofilms: Survival mechanisms of clinically relevant microorganisms. Clin Microbiol Rev. 15 (2), 167-193 (2002).">Donlan, R. M., Costerton, J. W. Biofilms: Survival mechanisms of clinically relevant microorganisms. Clin Microbiol Rev. 15 (2), 167-193 (2002).
- Biofilms: Microbial life on surfaces. Emerg Infect Dis. 8 (9), 881-890 (2002).">Donlan, R. M. Biofilms: Microbial life on surfaces. Emerg Infect Dis. 8 (9), 881-890 (2002).
- Hiding in plain sight: Interplay between Staphylococcal biofilms and host immunity. Front Immunol. 5, 37(2014).">Scherr, T. D., Heim, C. E., Morrison, J. M., Kielian, T. Hiding in plain sight: Interplay between Staphylococcal biofilms and host immunity. Front Immunol. 5, 37(2014).
- Animal models of chronic and recurrent Pseudomonas aeruginosa lung infection: Significance of macrolide treatment. Apmis. 130 (7), 458-476 (2022).">Thomsen, K., et al. Animal models of chronic and recurrent Pseudomonas aeruginosa lung infection: Significance of macrolide treatment. Apmis. 130 (7), 458-476 (2022).
- Biofilms harbour Clostridioides difficile, serving as a reservoir for recurrent infection. NPJ Biofilms Microbiomes. 7 (1), 16(2021).">Normington, C., et al. Biofilms harbour Clostridioides difficile, serving as a reservoir for recurrent infection. NPJ Biofilms Microbiomes. 7 (1), 16(2021).
- Clostridioides difficile biofilms: A mechanism of persistence in the gut. PLoS Pathog. 17 (3), e1009348(2021).">Frost, L. R., Cheng, J. K. J., Unnikrishnan, M. Clostridioides difficile biofilms: A mechanism of persistence in the gut. PLoS Pathog. 17 (3), e1009348(2021).
- Wolf in sheep's clothing: Clostridioides difficile biofilm as a reservoir for recurrent infections. Microorganisms. 9 (9), 1922(2021).">Meza-Torres, J., Auria, E., Dupuy, B., Tremblay, Y. D. N. Wolf in sheep's clothing: Clostridioides difficile biofilm as a reservoir for recurrent infections. Microorganisms. 9 (9), 1922(2021).
- Analysis of Clostridium difficile biofilms: Imaging and antimicrobial treatment. J Antimicrob Chemother. 73 (1), 102-108 (2018).">James, G. A., et al. Analysis of Clostridium difficile biofilms: Imaging and antimicrobial treatment. J Antimicrob Chemother. 73 (1), 102-108 (2018).
- What's a biofilm?-how the choice of the biofilm model impacts the protein inventory of Clostridioides difficile. Front Microbiol. 12, 682111(2021).">Brauer, M., et al. What's a biofilm?-how the choice of the biofilm model impacts the protein inventory of Clostridioides difficile. Front Microbiol. 12, 682111(2021).
- Clostridium difficile biofilm: Remodeling metabolism and cell surface to build a sparse and heterogeneously aggregated architecture. Front Microbiol. 9, 2084(2018).">Poquet, I., et al. Clostridium difficile biofilm: Remodeling metabolism and cell surface to build a sparse and heterogeneously aggregated architecture. Front Microbiol. 9, 2084(2018).
- Comparison of planktonic and biofilm-associated communities of Clostridium difficile and indigenous gut microbiota in a triple-stage chemostat gut model. J Antimicrob Chemother. 69 (8), 2137-2147 (2014).">Crowther, G. S., et al. Comparison of planktonic and biofilm-associated communities of Clostridium difficile and indigenous gut microbiota in a triple-stage chemostat gut model. J Antimicrob Chemother. 69 (8), 2137-2147 (2014).
- Development and validation of a chemostat gut model to study both planktonic and biofilm modes of growth of Clostridium difficile and human microbiota. PLoS One. 9 (2), e88396(2014).">Crowther, G. S., et al. Development and validation of a chemostat gut model to study both planktonic and biofilm modes of growth of Clostridium difficile and human microbiota. PLoS One. 9 (2), e88396(2014).
- Characterisation of Clostridium difficile biofilm formation, a role for spo0a. PLoS One. 7 (12), e50527(2012).">Dawson, L. F., Valiente, E., Faulds-Pain, A., Donahue, E. H., Wren, B. W. Characterisation of Clostridium difficile biofilm formation, a role for spo0a. PLoS One. 7 (12), e50527(2012).
- A microbiota-generated bile salt induces biofilm formation in Clostridium difficile. NPJ Biofilms Microbiomes. 5 (1), 14(2019).">Dubois, T., et al. A microbiota-generated bile salt induces biofilm formation in Clostridium difficile. NPJ Biofilms Microbiomes. 5 (1), 14(2019).
- Screening for potent and selective anticlostridial leads among fda-approved drugs. J Antibiot (Tokyo). 73 (6), 392-409 (2020).">Abdelkhalek, A., Mohammad, H., Mayhoub, A. S., Seleem, M. N. Screening for potent and selective anticlostridial leads among fda-approved drugs. J Antibiot (Tokyo). 73 (6), 392-409 (2020).
- Recent development of small-molecular inhibitors against Clostridioides difficile infection. Bioorg Chem. 125, 105843(2022).">Chen, J., Lu, Y., Du, Y., Wang, H., Wu, Q. Recent development of small-molecular inhibitors against Clostridioides difficile infection. Bioorg Chem. 125, 105843(2022).
- A high-throughput small-molecule screen to identify a novel chemical inhibitor of Clostridium difficile. Int J Antimicrob Agents. 44 (1), 69-73 (2014).">Katzianer, D. S., Yano, T., Rubin, H., Zhu, J. A high-throughput small-molecule screen to identify a novel chemical inhibitor of Clostridium difficile. Int J Antimicrob Agents. 44 (1), 69-73 (2014).
- High-throughput screening identifies a novel natural product-inspired scaffold capable of inhibiting Clostridioides difficile in vitro. Sci Rep. 11 (1), 10913(2021).">Pal, R., Dai, M., Seleem, M. N. High-throughput screening identifies a novel natural product-inspired scaffold capable of inhibiting Clostridioides difficile in vitro. Sci Rep. 11 (1), 10913(2021).
- Mouse relapse model of Clostridium difficile infection. Infect Immun. 79 (7), 2856-2864 (2011).">Sun, X., et al. Mouse relapse model of Clostridium difficile infection. Infect Immun. 79 (7), 2856-2864 (2011).
- Isolating and purifying Clostridium difficile spores. Methods Mol Biol. 1476, 117-128 (2016).">Edwards, A. N., Mcbride, S. M. Isolating and purifying Clostridium difficile spores. Methods Mol Biol. 1476, 117-128 (2016).
- Characterization of the effects of Candida gastrointestinal colonization on Clostridioides difficile infection in a murine model. Methods Mol Biol. 2542, 271-285 (2022).">Romo, J. A., Kumamoto, C. A. Characterization of the effects of Candida gastrointestinal colonization on Clostridioides difficile infection in a murine model. Methods Mol Biol. 2542, 271-285 (2022).
- Laboratory maintenance of Clostridium difficile. Curr Protoc Microbiol. Chapter 9 (Unit9A), 1(2009).">Sorg, J. A., Dineen, S. S. Laboratory maintenance of Clostridium difficile. Curr Protoc Microbiol. Chapter 9 (Unit9A), 1(2009).
- Aseptic laboratory techniques: Plating methods. J Vis Exp. (63), e3064(2012).">Sanders, E. R. Aseptic laboratory techniques: Plating methods. J Vis Exp. (63), e3064(2012).
- Biofilm formation by Clostridium difficile. Gut Microbes. 4 (5), 397-402 (2013).">Dapa, T., Unnikrishnan, M. Biofilm formation by Clostridium difficile. Gut Microbes. 4 (5), 397-402 (2013).
- Microtiter dish biofilm formation assay. J Vis Exp. (47), e2437(2011).">O'toole, G. A. Microtiter dish biofilm formation assay. J Vis Exp. (47), e2437(2011).
- Multiple factors modulate biofilm formation by the anaerobic pathogen Clostridium difficile. J Bacteriol. 195 (3), 545-555 (2013).">Ethapa, T., et al. Multiple factors modulate biofilm formation by the anaerobic pathogen Clostridium difficile. J Bacteriol. 195 (3), 545-555 (2013).
- Comparative biofilm-forming ability between Clostridioides difficile strains isolated in Latin America and the epidemic nap1/027 strain. Front Cell Infect Microbiol. 12, 1033698(2022).">Morais, M., et al. Comparative biofilm-forming ability between Clostridioides difficile strains isolated in Latin America and the epidemic nap1/027 strain. Front Cell Infect Microbiol. 12, 1033698(2022).
Reprints and Permissions
Request permission to reuse the text or figures of this JoVE article
Request Permission