Azoxymethane (AOM)/dextran sulfate sodium (DSS)-induced colitis-associated colon cancer is an established and cost-effective approach to modeling autochthonous tumors of the large intestine in mice. We present an updated protocol and discuss critical considerations for sex-specific DSS dose optimization and the contribution of the microbiome for rigor, robustness, and reproducibility.
Method Article
Optimized Mouse Model to Induce Colitis-Associated Colon Cancer using Azoxymethane and Dextran Sulfate Sodium for Tumor Immunology and Therapy Studies
Opens in a new tab
In This Article
Summary
Loading...
$$\rightleftharpoonup{xx}$$
$$\longleftharp{xx}$$,
$$\longrightharp{xx}$$,
Abstract
Loading...
$$\rightleftharpoonup{xx}$$
$$\longleftharp{xx}$$,
$$\longrightharp{xx}$$,
Azoxymethane (AOM, a DNA-damaging agent) and dextran sulfate sodium (DSS, a colitis-promoting agent) can induce tumors in the large intestine of mice with high penetrance. The murine colitis-associated colon cancer (CAC) model induced by AOM/DSS stands as a gold standard in investigating inflammation-related colon cancer, given its accuracy in recapitulating human CAC clinical characteristics. The model's advantages include its origin and development from endogenous tissue, immune competence preserving a full repertoire of tumor-immune interactions, adaptability to numerous mouse strains, convenience of a 3-month latency, and relatively low costs. Despite these advantages, several challenges limit the protocol's effectiveness. Variability in DSS dosage and in tumor penetrance across studies leads to inconsistent observations. Additionally, variations in gut microbiota contribute to increased experimental variability, negatively impacting statistical power. Sex differences in response to AOM/DSS further complicate the interpretation of results. Moreover, DSS lot-to-lot variability hinders the reproducibility of findings. Addressing these challenges is crucial for enhancing the reliability and applicability of this model in preclinical research. To resolve this, using C57BL/6J mice as a model, we refined the established protocol with strategies for effective optimization to enhance reproducibility and harmonization between studies. These include recommendations for DSS dose titration in both male and female mice, implementation of microbiota homogenization prior to each DSS cycle to mitigate cage-to-cage gut flora heterogeneity. These steps significantly reduced variability and improved reproducibility, resulting in robust induction of CAC. Recognizing the pivotal role of inflammation and cellular immune mechanisms in CAC development, the protocol also describes tissue processing procedures suitable for isolation of RNA or protein and for profiling inflammatory cytokines from colon tumors and surrounding colon tissue. Ultimately, the use of this method ensures a more rigorous, robust, and reproducible CAC production.
Introduction
Loading...
$$\rightleftharpoonup{xx}$$
$$\longleftharp{xx}$$,
$$\longrightharp{xx}$$,
Colorectal cancer (CRC) is the third most common cancer worldwide and a leading cause of cancer-related deaths1,2. Compared to sporadic CRC, colitis-associated colorectal cancer (CAC) arises as a result of prolonged, repeated intestinal damage in patients with inflammatory bowel disease (IBD)3,4, is characterized by a higher malignant grade and a tendency for multifocal presentation at a younger age. Due to these factors, CAC generally necessitates more aggressive treatment with less favorable clinical outcomes5. Although CAC is considered a distinct entity due at least in part to the unique timing of acquisition of mutations and an outsized role of the inflammatory immune mechanisms and the microbiome, CAC and sporadic CRC share many similarities with respect to overall genomic landscapes and pathogenetic features. To advance our understanding of CRC in general and CAC in particular, and to improve therapeutic strategies, robust preclinical models are essential.
Among the various models used to study CRC, the AOM/DSS-induced CAC model is the most widely adopted and is considered the current gold standard6,7. Initiated with a strong mutagenic insult delivered by AOM, this model relies on repeated DSS-induced bouts of colitis that closely mimic human IBD, such as Crohn's disease and ulcerative colitis, which are well-established risk factors for CAC8. The AOM/DSS model offers several key advantages over other in vivo approaches. Unlike methods relying on the injection of exogenous cancer-initiating material to establish flank or even orthotopic tumors, AOM/DSS-induced CAC is autochthonous, meaning that tumor initiation occurs endogenously and cancer progression unfolds in the native tissue microenvironment, more closely reflecting its biology and natural history. Unlike xenografts of human cell lines or of patient-derived material that can only be grown in immunocompromised mice, it is immunocompetent, enabling the study of cancer-immune interactions. Unlike genetically-engineered models producing tumors with specific genetic drivers, it is agnostic to pre-defined mutations, allowing for a broader modeling of cancer signaling pathways and immune education mechanisms. Finally, the AOM/DSS model can be readily adapted to many different strains of mice, eliminating the need for lengthy breeding schemes, making it both time- and cost-effective. However, factors such as animal sex, DSS dosage, and differences in gut microbiota can introduce variability, affecting reproducibility and complicating its application in translational research.
We aimed to refine this protocol to mitigate the impact of these factors that underpin inconsistencies in the extent of colon inflammation and CAC tumorigenesis. There is significant variability in the concentrations of DSS used to induce either acute inflammation, colitis, or chronic inflammation, and CAC9,10. DSS is a polymer, and the average molecular weight can vary between lots and manufacturers, effecting variability in experimental outcomes. Therefore, it is essential to test each batch of DSS to ensure consistency across studies. In addition, the extent of DSS-induced inflammation is highly influenced by the gut microbiome, which can differ significantly between mouse facilities around the world, and even among different holding locations and colonies within the same institution11,12. This variability in microbial composition can affect the model's outcomes and contribute to inconsistent results13. Co-housing of animals from the different experimental groups, whenever possible, is critical to decrease variability, yet may not be sufficient to address this confounder, as the microbial communities undergo stochastic drift over time and lead to cage effects in chronic inflammation models14. Since the AOM/DSS protocol involves long-term treatment to maintain chronic inflammation, we implemented microbiota homogenization by periodically mixing the bedding from all cages housing AOM/DSS-treated animals. This practice helps homogenize the microbiota environment, resulting in reduced experimental variability. Besides, observations indicate that the effects of DSS can vary based on animal sex15,16, potentially leading to differential responses in inflammation and cancer development. We refined the existing protocol by titrating DSS in female and male mice separately to choose an appropriate dosage of DSS for both sexes, ensuring more uniform outcomes and providing critical inputs for statistical power calculations to determine optimal sample sizes in both male and female mice.
Overall, to enhance the reproducibility of the AOM/DSS model, we outline a standardized set of protocol guidelines that account for and mitigate these confounding factors. We employ microbiome homogenization techniques, as well as describe precise DSS dosage adjustment to achieve more consistent and reproducible results, thereby improving the utility of the AOM/DSS model and harmonization across different studies. Our protocol stands out as demonstrating reduced variability from microbiota-homogenized cages and provides clear, step-by-step instructions for implementing these reproducibility practices. As a result, the lower within-group variability effected by these protocol refinements leads to a reduction in sample sizes necessary to achieve the desired statistical power in detecting differences between experimental groups. This optimized protocol is tailored for researchers who aim to adapt the AOM/DSS model to their own mouse models and experimental designs, regardless of strain or gender background, for studying tumorigenesis mechanisms, therapeutic targets, or exploring immune cell dynamics.
Protocol
Loading...
$$\rightleftharpoonup{xx}$$
$$\longleftharp{xx}$$,
$$\longrightharp{xx}$$,
All animal procedures must be carried out in accordance with an institutionally approved protocol to ensure humane handling and adherence to ethical standards. Studies described here were approved by the University of Florida Institutional Animal Care and Use Committee (IACUC).
1. Optimization of DSS dosing
- Obtain mice of the age, strain, and source to be used in the main experiment, with an equal distribution of males and females. Label each mouse by ear-punch, tail mark, or other approved method for individual tracking. Measure and record the initial body weight of each animal.
NOTE: Male mice should be co-housed prior to weaning and should not be redistributed between cages to minimize fighting. - If using automatic watering, one week prior to starting an experiment, switch animals to water bottles and simultaneously block cage nozzles (metal sipper tubes in the cage) with sterile plugs.
NOTE: Ensure any changes to water delivery, such as blocked automated drinking water nozzles, are approved by IACUC or the appropriate regulatory body overseeing humane use of animals. Animal cages may require daily checks to ensure uninterrupted access to drinking water. - Prepare the DSS solution by dissolving DSS in autoclaved sterile drinking water at varied concentrations from 1.5% to 5% (w/v), using a magnetic stir bar and a stir plate. Wait for 30 min at room temperature for the DSS powder to completely dissolve in water. Prepare the DSS water freshly every week and store it at 4 °C for up to one week.
- Fill two 50 mL conical tubes with DSS water at each concentration (one for males, one for females) and securely attach an autoclaved sterile drinking nozzle to prevent leakage.
- Administer DSS water at each concentration to female and male mice, with 3 mice in each cage receiving the same concentration. Use sterile drinking water without DSS as a negative control. Replace DSS water every other day.
- Administer DSS water for 7 days. Record the body weight of each mouse daily.
- On Day 8, switch all animals back to normal drinking water.
- On Day 8, assess the severity of diarrhea based on stool consistency utilizing a standardized scoring system as described17 and record scores. Score "1" as soft but still formed stool pellet, "2" as very soft stool pellet, and "3" as diarrhea.
- On Day 8, collect 2-3 fresh stool pellets and evaluate for the presence of occult blood (see Table of Materials). Record the presence or absence of blood in the sample.
- Evaluate for intestinal bleeding based on a combination of two scoring criteria, stool consistency (0-3) and presence of blood in stool (0-3), for a total score ranging from 0 to 6.
- From Day 9 to Day 12, record the body weight of each mouse daily and closely monitor DSS-treated animals for significant body weight loss and severe diarrhea. Promptly euthanize animals reaching or exceeding humane endpoints by carbon dioxide (CO2) asphyxiation or another appropriate method as per approved animal use protocol and established ethical guidelines.
- From Day 13 to Day 18, continue monitoring animals and record the body weight of each mouse daily until fully recovered to pre-experiment levels.
- Determine the optimal DSS concentration, as that resulting in approx. 20% body weight loss accompanied by soft yet still-formed stool. The optimal DSS dose may vary between males and females, mouse strains, ages, DSS lots, and animal facilities.
2. CAC induction
- Day 0-6: AOM treatment Day 7-28: 1 st cycle of DSS treatment
- AOM stock preparation: Dissolve AOM powder in sterile saline to achieve a stock concentration of 10 mg/mL. Filter the solution through a 0.45 µm filter, distribute 1 mL aliquots into 1.5 mL microcentrifuge tubes, and store at -80 °C for up to one year.
NOTE: AOM is a volatile carcinogen and must be handled with caution under a biosafety hood with appropriate personal protective equipment (PPE), following the manufacturer's safety recommendations. AOM and any AOM-contaminated materials should be disposed of in accordance with the institution's hazardous chemical waste disposal protocols. It is the investigator's responsibility to secure necessary environmental health and safety approvals ahead of time. - If using automated cage watering, 1 week prior to the experiment initiation, block automated drinking water nozzle and switch animals to water bottles for acclimation as in step 1.2.
- On Day 0, weigh and record the body weight of each mouse to calculate the total required amount of AOM. Then calculate the total volume of AOM (1 mg/mL final working concentration) based on each animal's weight to achieve a dose of 10 mg/kg, e.g., 200 µL for a 20 g mouse.
- Thaw the required number of new aliquots of 10 mg/mL AOM on ice before each use. Dilute each 1 mL aliquot of AOM with 9 mL of sterile saline to achieve a working concentration of 1 mg/mL.
- Administer AOM to mice via intraperitoneal injection. Perform this procedure inside a biosafety cabinet while wearing appropriate PPE such as double gloves and an N95 mask for optimal protection.
CAUTION: Discard any leftover AOM solution in accordance with hazardous chemical waste disposal requirements. - On Day 3, transfer AOM-treated animals into clean cages. Wear appropriate PPE when handling AOM-contaminated cages and other materials for protection.
CAUTION: Dispose of soiled cage bedding and any leftover food according to the institution's approved hazardous chemical waste disposal procedures.
NOTE: AOM and its metabolites are completely excreted by 72 h after administration18, at which point soiled cage bedding can be disposed of. - On Day 7, perform gut microbiota homogenization to minimize cage-to-cage variability. To do this, sample 25% of bedding from each cage, mix thoroughly, and redistribute it back into each cage.
NOTE: Refrain from changing cages during the week of DSS treatment and for five days thereafter. Coordinate with the facility's husbandry cage changing service, as necessary. - Initiate colitis induction by providing DSS in drinking water using 50 mL conical tubes equipped with suitable nozzles. Check mice daily to confirm that animals have unrestricted access to DSS water. Replace DSS water every other day. Record the body weight of each mouse daily.
- On Day 14, replace DSS water with normal drinking water bottles. Continue to closely monitor animals for pain and distress.
- On Days 14-19, weigh each mouse daily. Euthanize animals that lose more than 25% of their body weight, or if an animal reaches any of the humane endpoints outlined in the approved animal care and use protocol. Additionally, monitor for and record any instances of rectal bleeding.
- AOM stock preparation: Dissolve AOM powder in sterile saline to achieve a stock concentration of 10 mg/mL. Filter the solution through a 0.45 µm filter, distribute 1 mL aliquots into 1.5 mL microcentrifuge tubes, and store at -80 °C for up to one year.
- Day 7-28: 1 st cycle of DSS treatment
- On Day 7, perform gut microbiota homogenization to minimize cage-to-cage variability. To do this, sample 25% of bedding from each cage, mix thoroughly, and redistribute it back into each cage.
NOTE: Refrain from changing cages during the week of DSS treatment and for five days thereafter. Coordinate with the facility's husbandry cage changing service, as necessary. - Initiate colitis induction by providing DSS in drinking water using 50 mL conical tubes equipped with suitable nozzles. Check mice daily to confirm that animals have unrestricted access to DSS water. Replace DSS water every other day. Record the body weight of each mouse daily.
- On Day 14, replace DSS water with normal drinking water bottles. Continue to closely monitor animals for pain and distress.
- On Days 14-19, weigh each mouse daily. Euthanize animals that lose more than 25% of their body weight, or if an animal reaches any of the humane endpoints outlined in the approved animal care and use protocol. Additionally, monitor for and record any instances of rectal bleeding.
- On Day 7, perform gut microbiota homogenization to minimize cage-to-cage variability. To do this, sample 25% of bedding from each cage, mix thoroughly, and redistribute it back into each cage.
- Day 29-49: 2 nd cycle of DSS treatment
- Repeat microbiota homogenization along with DSS administration, following the same procedures as in steps 2.2.1-2.2.4. Optional: Following the second and/or third DSS cycle, perform colonoscopy as previously described19.
- Day 50-70: 3rd cycle of DSS treatment
- Repeat microbiota homogenization along with DSS administration, following the same procedures as in steps 2.2.1-2.2.4. As mice tend to lose the most weight three days after the third cycle of DSS, closely monitor all animals for excessive body weight loss or for any indications of rectal bleeding during this period and provide moist chow for supportive care if indicated.
3. Assessment of colitis severity and CAC gross pathology
- On Day 70, collect 2-3 fresh fecal pellets from each mouse to test for the presence of occult blood and/or inflammation markers such as lipocalin-220 to assess colitis severity. Use appropriate reagents/kits (see list of materials and equipment) and follow manufacturer's instructions to conduct the assays, briefly outlined below.
- To prepare fecal samples for assessment of inflammation marker lipocalin-2 levels, place fresh stool pellets into a 1.5 mL microcentrifuge tube. Dissolve pellets in 1 mL of sterile phosphate buffered saline (PBS) using a vortex mixer until a uniform solution is achieved. Centrifuge the solution at 10,000 x g for 10 min at 4 °C. The supernatant can be used immediately for lipocalin-2 ELISA or stored at -80 °C for later use.
- Perform mouse lipocalin-2 ELISA as per kit manufacturer's instructions. Run pilot serial dilution experiments to determine optimal dilution of fecal samples relative to standards.
NOTE: Lipocalin-2 levels are expected to increase at least 1000 fold in DSS treated mice compared to water treated control animals20. - Assess colitis severity using a diarrhea scoring system17 as described in steps 1.8-1.10.
- On day 70, euthanize animals by CO2 asphyxiation or using any other approved humane method.
- Spray the abdominal area of each animal with 70% ethanol to minimize contamination during subsequent steps.
- Use fine surgical forceps to lift the skin and the peritoneal layer. Make a horizontal incision with scissors to expose the abdominal cavity.
- Pull the small intestine outside and identify the cecum. Gently lift the cecum and colon using forceps. Carefully dissect the colon by cutting the mesentery and associated vasculature using scissors, avoiding puncturing or cutting through the colon.
- Cut the pelvic bone and the skin surrounding the rectal-anal area to expose the complete distal colon. It is important to dissect the entire colon with the distal part intact, as most tumors typically occur in this region.
- Place the dissected colon onto a clean strip of filter paper, straightening it out gently.
- Measure the colon length with a ruler and document it with a photograph. Include the ruler in the photograph for scale.
- Clean Peyer's patches on the colon's exterior, taking care not to puncture the tissue.
- Rinse the colon in cold sterile PBS.
- Secure a 200 µL micropipette tip (without filter) onto a 3 mL syringe using paraffin film. Use this setup to fill the syringe with sterile PBS, insert the pipette tip into the colon lumen, and gently flush the contents of the colon 2-3 times, ensuring complete removal of stool pellets.
- Gently stretch out the colon on a clean, pre-wetted strip of filter paper. Cut open the colon longitudinally and lay it flat on the filter paper.
- Identify larger tumors, which typically present as prominent blebs protruding from the colon wall with an inflamed, red appearance.
- For smaller tumors, exercise additional caution during identification. Utilize a sterile bacterial seeding loop to gently probe the surface of the colon for any irregularities or bumps. Confirm that any detected bumps are not remnants of lymph nodes or blood vessels located on the exterior of the colon wall.
- Use digital calipers to measure the width and length of each tumor.
- Record the tumor count and each tumor's size and location on a pre-printed colon map.
4. Histology assessment
- Use two pairs of fine-tipped forceps to grasp both lateral ends of the distal colon. Roll the colon from the distal end to the proximal end into a Swiss-roll shape as described elsewhere21. Ensure that the distal end is at the center of the roll, and the proximal end forms the outermost layer.
- Secure each Swiss-rolled colon using a 27½-G needle.
- Place each secured Swiss-rolled colon into an appropriately labeled tissue cassette.
- Submerge the tissue cassettes containing Swiss-rolled colons in 4% paraformaldehyde (PFA) in sterile PBS. Allow the tissues to remain in the fixative for 24 h.
- After 24 h, transfer the tissues into 70% ethanol. The tissues can be kept in 70% ethanol at 4 °C for up to three months.
- The Swiss-roll can be used for multiple histopathology exams, including conventional hematoxylin and eosin (H&E) staining, immunohistochemistry, and immunofluorescence.
5. Tissue harvest for protein and RNA isolation from tumors and the surrounding colon
- Work on ice and use pre-chilled tubes and reagents to preserve the integrity of the biological material.
- After tumor assessment, dissect tumors and collect into pre-chilled, pre-labeled tubes with appropriate buffer (see below) on ice. Depending on the experimental design, pool all tumors from the same animal or process them individually. If desired, similarly collect ~1 cm pieces of surrounding non-tumor colon tissue.
- Protein isolation
- Add 0.5 mL of 800 µm grinding glass beads and 400 µL of lysis buffer (1% NP-40 in 150 mM NaCl with 20 mM Tris-HCl (pH 7.5) and 1% protease and phosphatase inhibitor cocktail into each tissue homogenization tube and transfer the colon/tumor tissue into each tube.
- Homogenize colon/tumor tissue using a bead-based tissue homogenizer at 6 M/S for 30 s, repeat twice for complete homogenization.
NOTE: Place tubes on ice between cycles to prevent sample overheating from mechanical homogenization. - After homogenization, aspirate 150 µL of the lysate (supernatant) and transfer to a clean 1.5 mL microcentrifuge tube.
- Spin down the lysate at 10,000 g at 4 °C to pellet any insoluble material. Transfer the supernatant into a clean tube if desired.
- Quantify total protein concentration by bicinchoninic acid (BCA) assay or other appropriate method.
- If desired, adjust total protein concentration to 4 mg/mL for each sample with the same lysis buffer.
- Use protein lysates immediately for downstream assays such as immunoblotting or cytokine analysis, or store at −80 °C for later use.
- RNA purification:
- After dissection, place colon/tumors into 1.5 mL microcentrifuge tubes and submerge in 200 µL of appropriate RNA preservation reagent.
NOTE: Pause point: fresh colon/tumor tissue can be flash-frozen in liquid nitrogen and stored at −80°C for later processing - Thaw colon/tumor tissue on ice.
- Transfer colon/tumor into a tissue homogenization tube containing 500 µL of appropriate lysis buffer suitable for RNA isolation and 200 µL of grinding glass beads.
- Homogenize using a bead-based tissue homogenizer at 6 M/S for 30 s three times, with a two-minute break between each cycle.
NOTE: Transfer the tube on ice between cycles to prevent RNA degradation from overheating during mechanical homogenization. - Transfer 300 µL of lysate to a new 1.5 mL microcentrifuge tube.
- Isolate total RNA using the appropriate RNA purification procedure as necessary. Measure RNA concentration, purity, and quality/integrity as appropriate for downstream use.
- After dissection, place colon/tumors into 1.5 mL microcentrifuge tubes and submerge in 200 µL of appropriate RNA preservation reagent.
Results
Loading...
$$\rightleftharpoonup{xx}$$
$$\longleftharp{xx}$$,
$$\longrightharp{xx}$$,
We performed DSS dose optimization for our experimental conditions. DSS dosing needs to be re-calibrated for every animal facility, mouse strain, study design, and DSS lot. For this study, C57BL/6J mice were housed in a specific pathogen-free vivarium in ventilated cages with ad libitum standard irradiated 18% protein rodent diet. Both male and female mice begin to lose weight starting on Day 5 after being placed on DSS water, reaching their lowest weight three days after DSS withdrawal (Figure 1A,C). On the day of the greatest weight loss, male mice exhibited approximately 15% weight loss, while female mice showed about 20% weight loss (Figure 1B,D). Based on these results, we determined the optimal dose for our specific experimental conditions was 3.0% for females and 3.25% for males. The treatment schedule for AOM/DSS is outlined in Figure 2A, with microbiome homogenization occurring at the start of each DSS treatment cycle until the experiment concludes to mitigate cage effects and variability. Typical dynamics of animal weight loss and recovery for the entire duration of the experiment are shown in Figure 2B. Animals fully recover to the original body weight within two weeks following the discontinuation of DSS administration. A well-calibrated DSS colitis model results in soft but still formed stool pellets instead of diarrhea (stool consistency score 1-2), with occasional detection of occult blood in feces indicative of subclinical bleeding and few cases of visible blood in the stool (blood presence score 1-2)17. To further assess the severity of colitis, fecal samples were collected to analyze inflammatory marker lipocalin-2 levels. The presence of occult blood was not detected in mice receiving regular drinking water throughout the experiment, unlike DSS-treated animals (Figure 2C). Consistently, lipocalin-2 levels were elevated approximately 1,000-fold in AOM/DSS-treated mice compared to AOM/water-only controls (Figure 2D).
At the endpoint, we dissected the colons and counted tumors using a tumor record map (Figure 3A). DSS-colitis results in a significantly shorter colon length, unlike AOM/water-only controls (Figure 3B). Moreover, AOM/DSS-treated animals develop visible colon tumors, most of which form in the distal end (Figure 3C). Histological examination of the H&E-stained colon sections revealed significant epithelial cell erosion, immune infiltration, and ulceration in AOM/DSS mice (Figure 4A). The severity of the colon histopathology can be quantified using established scoring systems for DSS-induced murine CAC, based on four parameters (Figure 4B): immune infiltration and edema (0-3), ulceration (0-3), colonic epithelial morphology (0-4), and neoplasms (0-4)22,23,24. The results of such evaluations, as applied to histology examples in Figure 4A, are presented in Figure 4C. Colon epithelial proliferation was evaluated via immunohistochemical analysis using Ki67 staining, demonstrating that DSS treatment promotes proliferation of colon epithelial cells. Additionally, the colon sections can be utilized for immunofluorescent staining of various markers, such as the angiogenesis marker CD31 (Figure 4D,E).
We further evaluated the effects of microbiota homogenization on experimental endpoints such as the magnitude of colonic inflammation, body weight loss, and cumulative tumor burden in each animal. One group of mice was housed in cages that were subjected to mixing and redistribution of soiled bedding on Day 0 to achieve microbiota homogenization, alongside control animals in cages wherein this manipulation was omitted. Animals in both groups received 2.5% DSS water for 7 days. While the average levels of the inflammatory marker lipocalin-2 in feces per cage on day 8 did not significantly differ between groups (Welch's t-test), we observed significantly lower variability between data points in cages that underwent microbiota homogenization (Figure 5A, Welch's F-test to compare variances, p<0.0001). Consistently, by day 8, all animals exhibited a similar extent of body weight loss compared to the day 0 baseline. However, mice in the microbiota homogenization group showed less variability in body weight loss compared to the control group (Figure 5B). Further, in a 10-week CAC induction protocol (Figure 2A) with (microbiota homogenization) and without (control) cage bedding mixing prior to each DSS cycle, the cumulative tumor burden per mouse was more consistent in the microbiota homogenized group compared to controls that were significantly more variable (Figure 5C). Overall, these data provide strong evidence that microbiota homogenization strongly improves the robustness and reproducibility of the AOM/DSS model.
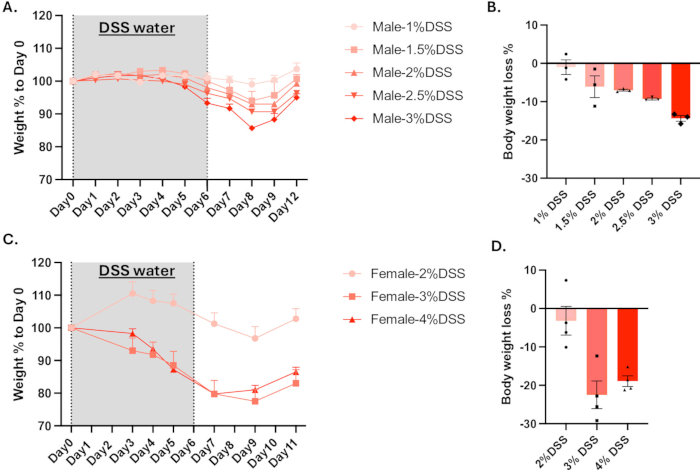
Figure 1. DSS dose titration in male and female mice. (A-D) Percent body weight change compared to day 0 in 14 week-old male (A, B) and female (C, D) C57BL/6J wild-type mice maintained on water with indicated DSS concentrations (1%, 1.5%, 2%, 2.5%, 3% for males and 2%, 3%, 4% for females). (A, C) Animals were administered DSS for 7 days and monitored for body weight loss up to 12 days. B and D show body weight loss of male mice at Day 8 (B) and female mice at Day 9 (D) from the start of DSS treatment. Data are presented as averages ± SEM; n=3 in A & B, n=4 in C & D. Please click here to view a larger version of this figure.
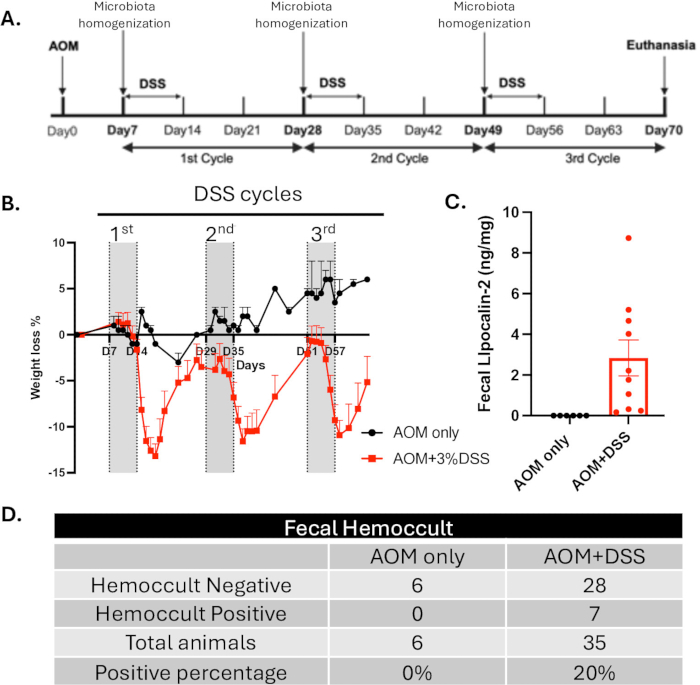
Figure 2. AOM/DSS-induced CAC timeline and monitoring. (A) AOM/DSS-induced CAC experimental timeline. (B) Body weight relative to day 0 in experimental AOM/DSS-treated (red) or control (AOM only, no DSS, black) female C57BL/6J wild-type mice. All animals received one dose of AOM (10 mg/kg) and were randomized to either three cycles of 3% DSS (red) or normal drinking water (control, black) for a total of 70 days. Data are presented as averages ± SEM, n=2 and 11. (C) Fecal Hemoccult test from control (AOM only) or DSS-treated (AOM and 1.5% DSS) female mice. (D) Fecal lipocalin-2 levels from 6 control (AOM only, black) or 35 treated (AOM and 1.5% DSS, red) female mice at day 70. Data are presented as averages ± SEM. Please click here to view a larger version of this figure.
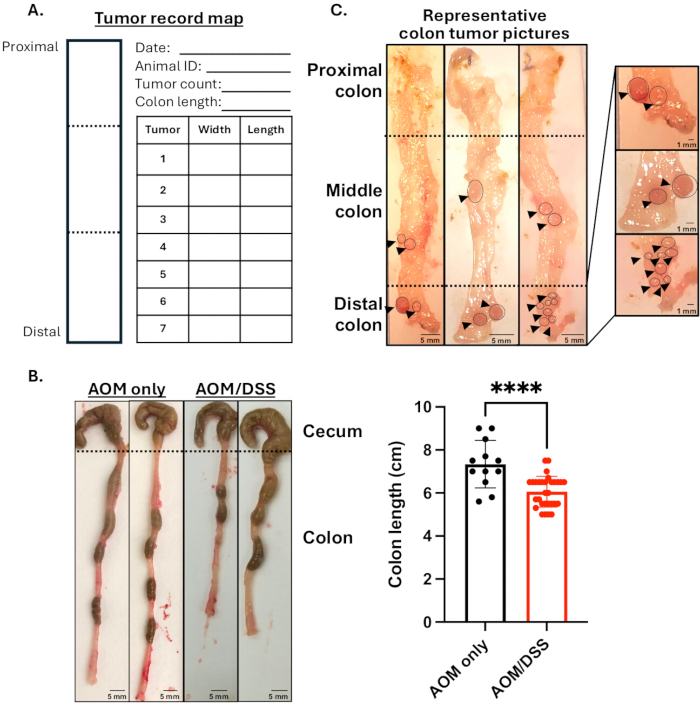
Figure 3. Macroscopic assessment of colons. (A) Example of a tumor record map. (B) Representative colon pictures from control (AOM only) or DSS-treated (AOM and 1.5% DSS) female mice at day 70. Colon length shortening indicates greater inflammation in DSS-treated animals. Bar - 5 mm; ****, p=0.002, Mann-Whitney rank sum test; n=12 & 30. (C) Representative gross pathology pictures of colons with tumors at day 70 from female mice treated with AOM and 3% DSS (tumors are circled and marked with black triangles). Bar - 5 mm. Callout - enlarged view of distal colon regions with tumors; bar - 1 mm). Please click here to view a larger version of this figure.
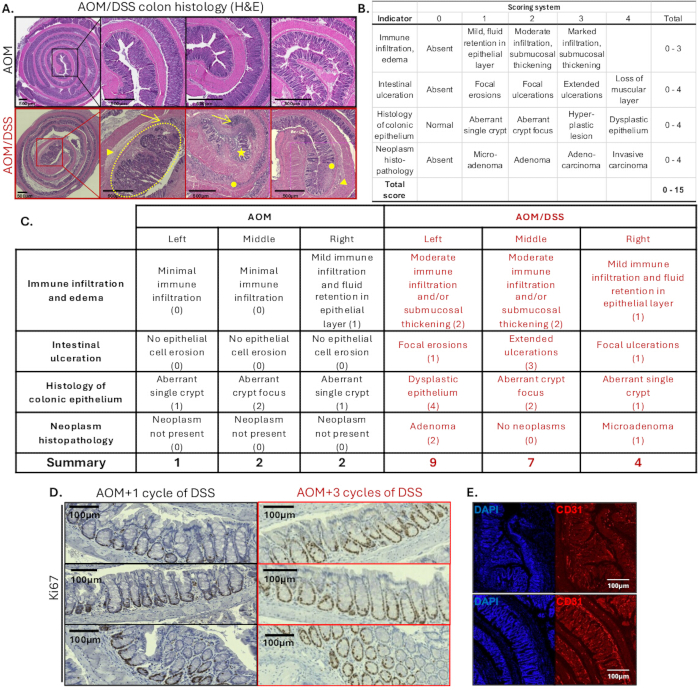
Figure 4. CAC histology assessment. (A) Representative H&E-stained sections of Swiss-rolled colons from AOM/DSS-treated and control (AOM only) mice at day 70 with enlarged distal regions from 3 animals displayed on the right. Control colons show intact colonic crypt organization. Colons from AOM/DSS-treated mice are characterized by submucosal thickening (arrowheads), immune infiltration (arrows), disruption or loss of crypt architecture (star), erosion of the epithelial layer, epithelial hyperplasia or dysplastic epithelia (circles) with adenoma and adenocarcinoma formation (outlined by dotted line). Bar - 500 µm. (B) Histopathology scoring system used to assess the severity of CAC phenotype. (C) Example of colon histology scores from AOM-only or AOM/DSS-treated mice shown in A. (D) Representative immunohistochemistry staining for Ki67 proliferation marker in Swiss-rolled colons from AOM-treated animals after 1 or 3 cycles of DSS. Proliferating Ki67-positive cells (brown) localize at the bottom of colonic crypts but spread upward and invade inside the crypts with CAC initiation and more advanced pathology. Bar - 100 µm. (E). Representative immunofluorescent staining assessing vascularization based on CD31 endothelial marker (red) and counterstained with DAPI to visualize nuclei (blue) in colon sections from AOM/DSS-treated mice. Bar - 100 µm. Please click here to view a larger version of this figure.
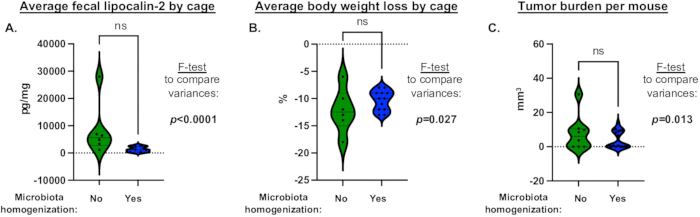
Figure 5. Microbiota homogenization reduces variability in colon inflammation and CAC tumor burden. (A) Average fecal lipocalin-2 levels in mice treated with 2.5% DSS on day 8. Statistical analysis was performed using Welch's t-test to compare average fecal lipocalin-2 levels between the two groups (p=0.137, n=6 & 12 cages). Additionally, an F-test on variances was conducted, yielding a p-value of 0.0001, indicating significant differences in variance between the two groups. (B) Average body weight loss in AOM/DSS-treated animals receiving DSS water on day 8. While the average body weight loss between the two groups is not significantly different (Welch's t-test, p=0.194, n=6 & 12), the variance within the groups is significantly different (F-test, p=0.027). (C) Tumor burden per mouse following 10 weeks of AOM/DSS treatment. Statistical analysis was performed using Welch's t-test to assess differences in average tumor burden between groups (p=0.211, n=8 & 18) and an F-test to evaluate the difference between variances (p=0.013). (A-C) Blue violin plots depict the group that underwent microbiota homogenization, while green violin plots represent the control group (without microbiota homogenization), ns - not significant. Please click here to view a larger version of this figure.
Discussion
Loading...
$$\rightleftharpoonup{xx}$$
$$\longleftharp{xx}$$,
$$\longrightharp{xx}$$,
The AOM/DSS protocol was first introduced in 1996 by Okayasu et al.25 and has since been recognized as an excellent model for faithfully mimicking the initiation and progression of colon cancer from normal tissue to adenomatous changes and ultimately carcinoma, as demonstrated by Suzuki et al. in 200626, especially in the context of colonic inflammation. Subsequent studies evaluated the effects of AOM and AOM/DSS across different mouse strains, as well as the impact of varying treatment durations on tumor phenotype and penetrance26,27,28. In 2018, Christopher Williams and his group published an updated protocol29 that laid a crucial foundation for the development of this methodology. Recent advances have further demonstrated the utility of the AOM/DSS model for the studies of mucosal immunity by integrating methods for isolation of intestinal immune infiltrates and immunophenotyping via flow cytometry30.
One of the major strengths of the AOM/DSS protocol is in the easy adaptability to virtually any strain of mice, prompting investigation into the effects of different genetic backgrounds. Thus, Suzuki et al. compared susceptibility to AOM/DSS-induced colon carcinogenesis in four different mouse strains using colon adenoma penetrance as a readout, with the following results: BALB/c > C57BL/6N > DBA/2N = C3H/HeN26. Additional studies found that FVB/N mice develop colon tumors more readily after repeated AOM treatment compared to C57BL/6J and 129/SvJ strains27. Notably, the development of well-differentiated colon adenocarcinoma with nearly 100% penetrance was reported in FVB/N mice in a 10-week AOM/DSS CAC induction protocol31. These findings collectively suggest that different mouse strains may not be equally susceptible to AOM/DSS treatment, contributing to variations in tumorigenesis and further highlighting the need for a consistent set of guidelines for the AOM/DSS protocol harmonization and reproducibility across mouse strains, housing facilities, and other variables. Among those, significant variability in the gut microbiome hinders the reproducibility of studies focused on inflammation and tumor penetrance9,10. Specifically, the composition of the gut microbiome, including Duncaniella muricolitica and Alistipes okayasuensis species, can have an outsized impact on the severity of DSS colitis13. Another study highlighted the significance of microbiota composition in CAC induction by demonstrating that NLRP3-deficient mice exhibited an exacerbated colitis phenotype characterized by an increased presence of the bacterial phyla Bacteroidetes (specifically Prevotellaceae) and TM710.
Despite the method's popularity, the existing AOM/DSS protocols have not addressed the significant issue of high variability observed across animals within experimental groups32. To tackle this challenge, we put forth a set of recommendations for protocol optimization and harmonization by implementing DSS titration (taking animal sex into account) and microbiota homogenization. Our approach aims to reduce the variability and enhance the reproducibility of the AOM/DSS model across animal strains, experimental designs, and endpoints. While we cannot provide specific recommendations regarding sample sizes, the number of experimental replicates will be guided by the specific study design and the expected effect sizes for each experiment. The lower within-group variability achieved by these refinements requires fewer animals in each condition to achieve the same statistical power in detecting these differences. We anticipate that these improvements will further promote ethical use of animals, responsible stewardship of research funds, and reductions in labor, leading to increased efficiency.
The AOM/DSS model has significant translational value in studying human colitis-associated colorectal cancer. Given the challenges of modeling human CRC due to its complex etiology, it is important to emphasize that although the AOM/DSS model might provide some insights into the pathogenesis of sporadic CRC, it is most appropriate for studies into inflammation-associated malignancy. Further, the AOM/DSS-induced cancer has a low incidence of metastasis33,34 and thus is inappropriate for studying metastatic spread. These limitations notwithstanding, the AOM/DSS model is highly penetrant, reliable, demonstrates human-relevant histopathology, and accurately mimics disease progression from inflammation to dysplasia to adenocarcinoma, all while remaining cost-effective. In this protocol, we provide recommendations for generating reproducible results and minimizing confounding factors based on existing workflows8,35.
Identification of the optimal DSS dosage through dose-response pilot experiments, accounting for animal sex as a biological variable16,36,37, is the first critical step toward establishing a robust AOM/DSS protocol (Figure 1). We found that treatment with 3% DSS for 7 days resulted in a more significant decrease in body weight in females (~20%) compared to males (~15%) (Figure 1B,D). However, male mice may be more, less, or equally sensitive to DSS compared to females. This may be attributable to different mouse strains and variations in gut microbiome composition across animal facilities, necessitating re-adjustment of DSS concentration tailored to each specific set of experiments. The optimal DSS concentration is a trade-off between maximizing colonic inflammation and tumor induction without exceeding tolerable toxicity. In our experience, this balance is most likely achieved at DSS doses resulting in body weight loss of approximately 20% after the first cycle. Animals tend to lose less weight in the second cycle of treatment, but a greater reduction in body weight is generally observed in the third cycle of DSS, potentially due to tumor formation in the colon. Therefore, 25% body weight loss can be adopted as a humane endpoint for institutional animal use protocols. Furthermore, well-calibrated DSS colitis results in soft but still formed stool pellets rather than diarrhea and occasional positive hemoccult test, but few cases of visible blood traces in the stool, with animals expected to make a full recovery within two weeks following the cessation of DSS administration.
DSS is a polymer with a molecular weight ranging from 36,000 to 50,000 Da. Due to the lot-to-lot variability in DSS manufacturing, it is essential to perform DSS dose recalibration experiments for each new batch of the product. To maintain consistency, it is practical to estimate the total amount of DSS needed for the entire study to be purchased from the same lot. Further, this protocol also describes steps to standardize microbiota composition across the entire experimental cohort of mice during CAC induction, thus mitigating potential cage effects to reduce variability. As an additional precaution to minimize cage effects, it is recommended that animals from different experimental groups be co-housed whenever possible. Depending on the specific experimental goals and ethical animal use policies, these considerations should be mirrored in pilot experiments. Microbiota drift may also be precipitated by bedding changes in a wet cage with leaking drinking bottles. It is best to refrain from cage changes during DSS delivery and for five days thereafter. Using 50 mL tubes for DSS water administration reduces the risk of leakage and minimizes DSS waste. These logistical considerations may require close collaboration between research staff and animal care technicians performing cage changing and husbandry services.
In this protocol, we also provide a basic workflow for tissue and cell harvest, as well as data collection. This includes testing for the presence of occult blood (Figure 2C) and mapping tumors (Figure 3A). The AOM/DSS model is suitable for immunocompetent mice, making it an ideal system for exploring the tumor immune microenvironment because of the fully intact immune system38,39, in contrast to xenograft approaches. Notably, it is amenable to experimental perturbation of the immune system or stromal components, whether through a genetic Cre-Lox system for cell-type-specific gene knock-ins/outs or reporter cassettes, or engraftment or depletion of specific cell populations. As one example, by combining the AOM/DSS model with bone marrow transplantation, we previously investigated how mutations in the hematopoietic system modulate CAC severity and burden40. To assist in such studies, there are excellent published methods for isolating viable tumor-infiltrating leukocytes suitable for further analyses, such as immunophenotyping, functional assays, and single-cell multi-omics41. Finally, because of the high penetrance and consistent latency, the AOM/DSS model is suitable for pre-clinical therapeutic studies using total tumor burden as a primary read-out.
Disclosures
Loading...
$$\rightleftharpoonup{xx}$$
$$\longleftharp{xx}$$,
$$\longrightharp{xx}$$,
The authors declare no competing financial interests.
Acknowledgements
Loading...
$$\rightleftharpoonup{xx}$$
$$\longleftharp{xx}$$,
$$\longrightharp{xx}$$,
This work was funded in part by NIH awards R01 DK121831 (OAG) and R01 AI067846 (DA). OAG was also supported by the Edward P Evans Foundation and the Oxnard Family Foundation. DA is supported by the Merit Society award. UFHCC is an NCI-designated cancer center (P30 CA247796).
Materials
| Name | Company | Catalog Number | Comments |
|---|---|---|---|
| Azoxymethane powder | Sigma-Aldrich | CAS 25843-45-2, Cat# A4586 | Carcinogen to induce colon tumors |
| Benchtop microcentrifuge | NA | NA | For sample preparition |
| C57BL/6J mice | Jackson Laboratory | 000664 | Strain and age as appropriate for each specific study |
| Conical tubes, 50 mL | Fisher | 14955239 | To administer DSS water |
| Dextran sulfate sodium salt, MW ca 40,000 | Cayman Chemical | 23250 | To induce colon inflmmation |
| Ethanol, 70% | Fisher | 43655223 | To sanitize working surfaces and dissection tools |
| Grinding glass beads, 800 µm | VWR | 12621-148 | To facilitate the homogenization of colon/tumor tissue |
| HemoCue America Beckman Coulter Hemoccult ICT Immunochemical Fecal Occult Blood Test Kit | HemoCue America 395065A | Catalog No.23280010 | For detection of occult blood in feces |
| Insulin Syringe 27GX5/8 1CC | BD | 3294-12 | For AOM injections |
| Lixit blocker | NA | NA | To block automated water delivery to mouse cages, if present (provided by the animal facility, sterille) |
| Magnetic stir bar and stir-plate | NA | NA | To dissolve DSS |
| Microtube Bead Homogenizer, BeadBlaster 24 | Benchmark | D2400 | To homogenize colon/tumor |
| Mouse Lipocalin-2/NGAL DuoSet ELISA | R&D Systems | Catalog No.DY1857 | To detect the lipocalin-2 from fecal samples |
| NP-40 solution, 10% | Thermo Fisher Scientific | 85124 | For lysis tumor/colon tissue |
| Pierce BCA Protein Assay Kit | Thermo Fisher Scientific | A65453 | For quantify protein concentration in total tissue lysates, or any other appropriate method |
| Protease and phosphate inhibitor cocktail | Fisher | PI78440 | To prepare samples for cytokine/protein analysis |
| RLTplus buffer | Qiagen | 1053393 | To isolate RNA, or any other appropriate RNA isolation method |
| RNAlater | Thermo Fisher Scientific | AM7021 | To preserve tissue samples prior to RNA isolation |
| RNeasy Microprep kit | QIAGEN | 74004 | To isolate RNA, or other RNA isolation and purification method as appropriate |
| Rodent Water Bottle Nozzle (30mm) | Vision | Type E | For adminitrating water or DSS solution |
| Sterile scissors and forceps | NA | NA | For tissue dissection |
| Syringe needles, 27G x 1/2in length (short) | BD | 305109 | For colon swiss-roll tissue fixation |
| Syringes, Luer lock, 3 mL | BD | 309657 | To flush colons prior to dissection and staging |
| TapeStation | Agilent | For RNA concentration and quality/integrity assessment | |
| Teklad 2918 | Evigo Bioproducts | T.2918M.15 | Standard rodent diet, 18% protein, irradiated |
| Tissue cassette | VWR | #87002-472 | To preserve sample for embedding |
| Toploading laboratory balance, 0-220 g | NA | NA | To weigh animals |
| Whatman Blotting Paper | VWR International | Cat# 28298-020 | For staging dissected colons for gross pathology and tumor counting |
References
Loading...
$$\rightleftharpoonup{xx}$$
$$\longleftharp{xx}$$,
$$\longrightharp{xx}$$,
- Morgan, E., et al. Global burden of colorectal cancer in 2020 and 2040: Incidence and mortality estimates from globocan. Gut. 72 (2), 338-344 (2023).
- Siegel, R. L., Wagle, N. S., Cercek, A., Smith, R. A., Jemal, A. Colorectal cancer statistics 2023. CA Cancer J Clin. 73 (3), 233-254 (2023).
- Lu, C., et al. Survival outcomes and clinicopathological features in inflammatory bowel disease-associated colorectal cancer: A systematic review and meta-analysis. Ann Surg. 276 (5), e319-e330 (2022).
- Porter, R. J., Arends, M. J., Churchhouse, A. M. D., Din, S. Inflammatory bowel disease-associated colorectal cancer: Translational risks from mechanisms to medicines. J Crohns Colitis. 15 (12), 2131-2141 (2021).
- Pan, Q., et al. Genomic variants in the mouse model induced by azoxymethane and dextran sodium sulfate improperly mimic human colorectal cancer. Sci Rep. 7 (1), 25(2017).
- Johnson, R. L., Fleet, J. C. Animal models of colorectal cancer. Cancer Metastasis Rev. 32 (1-2), 39-61 (2013).
- De Robertis, M., et al. The AOM/DSS murine model for the study of colon carcinogenesis: From pathways to diagnosis and therapy studies. J Carcinog. 10, 9(2011).
- Thaker, A. I., Shaker, A., Rao, M. S., Ciorba, M. A. Modeling colitis-associated cancer with azoxymethane (aom) and dextran sulfate sodium (dss). J Vis Exp. (67), e4100(2012).
- Chen, Y., Zhang, P., Chen, W., Chen, G. Ferroptosis mediated DSS-induced ulcerative colitis associated with Nrf2/Ho-1 signaling pathway. Immunol Lett. 225, 9-15 (2020).
- Elinav, E., et al. Nlrp6 inflammasome regulates colonic microbial ecology and risk for colitis. Cell. 145 (5), 745-757 (2011).
- Mahler, M., et al. Differential susceptibility of inbred mouse strains to dextran sulfate sodium-induced colitis. Am J Physiol. 274 (3), G544-G551 (1998).
- Bleich, A., Fox, J. G. The mammalian microbiome and its importance in laboratory animal research. ILAR J. 56 (2), 153-158 (2015).
- Forster, S. C., et al. Identification of gut microbial species linked with disease variability in a widely used mouse model of colitis. Nat Microbiol. 7 (4), 590-599 (2022).
- Mccafferty, J., et al. Stochastic changes over time and not founder effects drive cage effects in microbial community assembly in a mouse model. ISME J. 7 (11), 2116-2125 (2013).
- Wagnerova, A., et al. Sex differences in the effect of resveratrol on dss-induced colitis in mice. Gastroenterol Res Pract. 2017, 8051870(2017).
- Son, H. J., et al. Effect of estradiol in an azoxymethane/dextran sulfate sodium-treated mouse model of colorectal cancer: Implication for sex difference in colorectal cancer development. Cancer Res Treat. 51 (2), 632-648 (2019).
- Wirtz, S., Neufert, C., Weigmann, B., Neurath, M. F. Chemically induced mouse models of intestinal inflammation. Nat Protoc. 2 (3), 541-546 (2007).
- Fiala, E. S. Investigations into the metabolism and mode of action of the colon carcinogens 1,2-dimethylhydrazine and azoxymethane. Cancer. 40 (5 Suppl), 2436-2445 (1977).
- Becker, C., Fantini, M. C., Neurath, M. F. High resolution colonoscopy in live mice. Nat Protoc. 1 (6), 2900-2904 (2006).
- Chassaing, B., et al. Fecal lipocalin 2, a sensitive and broadly dynamic non-invasive biomarker for intestinal inflammation. PLoS One. 7 (9), e44328(2012).
- Dooley, S. A., et al. Optimized protocol for intestinal swiss rolls and immunofluorescent staining of paraffin embedded tissue. J Vis Exp. (209), e66977(2024).
- Cooper, H. S., Murthy, S. N., Shah, R. S., Sedergran, D. J. Clinicopathologic study of dextran sulfate sodium experimental murine colitis. Lab Invest. 69 (2), 238-249 (1993).
- Arthur, J. C., et al. Intestinal inflammation targets cancer-inducing activity of the microbiota. Science. 338 (6103), 120-123 (2012).
- Karrasch, T., Kim, J. S., Muhlbauer, M., Magness, S. T., Jobin, C. Gnotobiotic IL-10-/-;NF-Kappa B(egfp) mice reveal the critical role of TLR/NF-Kappa B signaling in commensal bacteria-induced colitis. J Immunol. 178 (10), 6522-6532 (2007).
- Okayasu, I., Ohkusa, T., Kajiura, K., Kanno, J., Sakamoto, S. Promotion of colorectal neoplasia in experimental murine ulcerative colitis. Gut. 39 (1), 87-92 (1996).
- Suzuki, R., Kohno, H., Sugie, S., Nakagama, H., Tanaka, T. Strain differences in the susceptibility to azoxymethane and dextran sodium sulfate-induced colon carcinogenesis in mice. Carcinogenesis. 27 (1), 162-169 (2006).
- Nambiar, P. R., et al. Preliminary analysis of azoxymethane induced colon tumors in inbred mice commonly used as transgenic/knockout progenitors. Int J Oncol. 22 (1), 145-150 (2003).
- Arnesen, H., et al. Induction of colorectal carcinogenesis in the C57BL/6J and a/j mouse strains with a reduced dss dose in the aom/dss model. Lab Anim Res. 37 (1), 19(2021).
- Parang, B., Barrett, C. W., Williams, C. S. AOM/DSS model of colitis-associated cancer. Methods Mol Biol. 1422, 297-307 (2016).
- Eich, C., Vogt, J. F., Langst, V., Clausen, B. E., Hovelmeyer, N. Isolation and high-dimensional flow cytometric analysis of tumor-infiltrating leukocytes in a mouse model of colorectal cancer. Front Immunol. 15, 1295863(2024).
- Barderas, R., et al. Sporadic colon cancer murine models demonstrate the value of autoantibody detection for preclinical cancer diagnosis. Sci Rep. 3, 2938(2013).
- Dzhalilova, D., Zolotova, N., Fokichev, N., Makarova, O. Murine models of colorectal cancer: The azoxymethane (AOM)/dextran sulfate sodium (DSS) model of colitis-associated cancer. PeerJ. 11, e16159(2023).
- Rosenberg, D. W., Giardina, C., Tanaka, T. Mouse models for the study of colon carcinogenesis. Carcinogenesis. 30 (2), 183-196 (2009).
- Pothuraju, R., et al. Colorectal cancer murine models: Initiation to metastasis. Cancer Lett. 587, 216704(2024).
- Neufert, C., Becker, C., Neurath, M. F. An inducible mouse model of colon carcinogenesis for the analysis of sporadic and inflammation-driven tumor progression. Nat Protoc. 2 (8), 1998-2004 (2007).
- Lee, S. M., et al. The effect of sex on the azoxymethane/dextran sulfate sodium-treated mice model of colon cancer. J Cancer Prev. 21 (4), 271-278 (2016).
- Jang, S., Han, H., Oh, Y., Kim, Y. Sex differences in inflammation correlated with estrogen and estrogen receptor-beta levels in azoxymethane/dextran sodium sulfate-induced colitis-associated colorectal cancer mice. Heliyon. 10 (6), e28121(2024).
- Xin, B., et al. Enhancing the therapeutic efficacy of programmed death ligand 1 antibody for metastasized liver cancer by overcoming hepatic immunotolerance in mice. Hepatology. 76 (3), 630-645 (2022).
- Rivera, M., et al. Patient-derived xenograft (pdx) models of colorectal carcinoma (crc) as a platform for chemosensitivity and biomarker analysis in personalized medicine. Neoplasia. 23 (1), 21-35 (2021).
- Feng, Y., et al. Hematopoietic-specific heterozygous loss of dnmt3a exacerbates colitis-associated colon cancer. J Exp Med. 220 (11), (2023).
- Mcmanus, D., Novaira, H. J., Hamers, A. aJ., Pillai, A. B. Isolation of lamina propria mononuclear cells from murine colon using collagenase e. J Vis Exp. (151), e59821(2019).
Reprints and Permissions
Request permission to reuse the text or figures of this JoVE article
Request Permission