Traditional Magnetic Resonance Elastography separates stiffness and structural images, requiring manual ROI delineation and radiologist input. This study introduces a multimodal fusion method that combines both image types to produce stiffness-structural fusion images and liver stiffness distribution statistics, supporting accurate cirrhosis staging and enabling radiomics analysis based on liver stiffness distribution.
Method Article
Precise Non-invasive Liver Cirrhosis Quantification via Multimodal Stiffness-Structural Fusion Imaging
1The First Clinical College, Beijing University of Chinese Medicine, 2Beijing Intelligent Entropy Science & Technology Co Ltd., 3Center for Integrated Chinese and Western Medicine, Beijing You An Hospital, Capital Medical University, 4Fever Clinics, Dongzhimen Hospital, Beijing University of Chinese Medicine
Opens in a new tab
In This Article
Summary
Loading...
$$\rightleftharpoonup{xx}$$
$$\longleftharp{xx}$$,
$$\longrightharp{xx}$$,
Abstract
Loading...
$$\rightleftharpoonup{xx}$$
$$\longleftharp{xx}$$,
$$\longrightharp{xx}$$,
Traditional Magnetic Resonance Elastography (MRE) presents stiffness and structural images separately, requiring manual ROI delineation for liver stiffness assessment. This introduces observer variability and may overlook significant lesions, failing to accurately represent whole-liver stiffness distribution patterns. The present study implemented multimodal image fusion integrating stiffness maps with structural images using: (1) acquisition on a 3.0T MRI with optimized T1-weighted imaging (TR/TE = 157.62/1.17 ms) and MRE (60 Hz vibrations); (2) computational preprocessing of DICOM data into 3D volumes; (3) precise co-registration and fusion calculation; and (4) quantitative liver stiffness distribution analysis across different cirrhosis stages. The stiffness-structural fusion imaging technique integrated anatomical structures with stiffness patterns in a single visualization, enabling simultaneous assessment of liver morphology and stiffness distribution. Comparative analysis revealed a clear differentiation between cirrhotic patients and healthy controls, with cirrhotic livers showing significantly higher proportions of advanced fibrosis. This technique eliminated variability due to manual ROI placement and established a standardized framework for comprehensive whole-liver assessment. The stiffness-structural fusion imaging technique provides comprehensive visualization of liver stiffness with precise anatomical correlation, potentially improving diagnostic accuracy compared to conventional MRE. This approach eliminates observer variability, enables standardized whole-liver assessment, and establishes a quantitative framework for monitoring disease progression and treatment response, while facilitating improved clinician-patient communication and offering a foundation for advanced radiomics in liver cirrhosis staging.
Introduction
Loading...
$$\rightleftharpoonup{xx}$$
$$\longleftharp{xx}$$,
$$\longrightharp{xx}$$,
Liver cirrhosis represents a significant global health challenge, with accurate staging being crucial for optimal patient management and treatment planning1,2. Magnetic Resonance Elastography (MRE) has emerged as a valuable non-invasive technique for liver cirrhosis assessment, offering advantages over invasive biopsy procedures that carry inherent sampling error risks and patient discomfort3,4,5. However, conventional MRE approaches present significant limitations in clinical practice that impact diagnostic accuracy and workflow efficiency.
Traditional MRE methodologies typically present stiffness maps and structural images as separate entities, requiring clinicians to mentally correlate anatomical features with stiffness patterns across different image series5,6. This approach necessitates manual region of interest (ROI) placement for liver stiffness quantification, introducing considerable inter-observer variability and potential sampling bias7,8. Furthermore, the conventional ROI-based approach fails to capture the heterogeneous nature of liver stiffness distribution, as highlighted in recent literature emphasizing the prognostic significance of parenchymal heterogeneity in chronic liver disease progression9,10. The inability to comprehensively visualize and quantify whole-liver stiffness distribution represents a significant barrier to advanced radiomics analysis and precise disease characterization.
Alternative non-invasive techniques for liver cirrhosis assessment include ultrasound elastography and serum biomarker panels11,12. While transient elastography offers point measurements of liver stiffness, it lacks the comprehensive spatial mapping capabilities of MRE 13. Serum biomarker panels provide indirect estimates of fibrosis but cannot visualize the spatial distribution of parenchymal changes11. Recent comparative studies have consistently demonstrated superior diagnostic accuracy of MRE for intermediate and advanced fibrosis stages compared to these alternatives13,14.
To address these limitations, we have developed a novel multimodal stiffness-structural fusion imaging technique that seamlessly integrates quantitative stiffness maps with high-resolution structural images. This approach enables simultaneous visualization of anatomical landmarks and stiffness patterns in a single integrated representation, eliminating the need for mental co-registration and reducing cognitive burden during interpretation15,16. The technique provides comprehensive whole-liver stiffness distribution analysis, overcoming sampling limitations of conventional ROI-based methods.
This study utilized 3.0 Tesla MRI systems with elastography capabilities, standard patient preparation including 4-6 h fasting, and MATLAB with Image Processing Toolbox for computational analysis. These requirements are increasingly available at academic medical centers and specialized imaging facilities.
This protocol provides a detailed methodology for implementing the stiffness-structural fusion technique in clinical and research settings. The approach is particularly valuable for centers with access to MRE capabilities seeking to enhance diagnostic precision, improve clinical workflow efficiency, and establish quantitative frameworks for longitudinal monitoring of chronic liver disease. The technique is applicable across various etiologies of chronic liver disease and can be implemented with minimal additional post-processing time using the provided computational framework.
Protocol
Loading...
$$\rightleftharpoonup{xx}$$
$$\longleftharp{xx}$$,
$$\longrightharp{xx}$$,
The protocol was performed under institutional IRB approval. A patient from Dongzhimen Hospital, Beijing University of Chinese Medicine, underwent routine upper abdominal magnetic resonance imaging and MRE at YouAn Hospital with informed consent. This case was selected for the research methodology due to the confirmed progression from fibrosis to cirrhosis, highlighting the value of the approach in diagnosing the boundary between liver fibrosis and cirrhosis. The study also provides a quantitative comparison between this patient's liver stiffness distribution (LSD) and that of a healthy liver. All equipment and software tools used in this study are listed in the Table of Materials.
1. MRI scanning strategies
- Prepare the patient by ensuring a fasting period of 4-6 h prior to examination to reduce physiological variability.
- Position the patient on the 3.0 Tesla MRI system using a combination of a 16-channel abdominal array and a 32-channel posterior array coil.
- Structural imaging acquisition
- Perform anatomical imaging using a breath-hold axial 2D T1-weighted dual-echo gradient-recalled echo sequence with the following parameters:
NOTE: TR/TE = 157.62/1.17 ms; Flip angle = 60°; Field of view = 400 × 400 mm2; Acquisition matrix = 512 × 512; Slice thickness = 7 mm. - Verify that the sequence provides high-resolution structural information (in-plane resolution of 0.78 × 0.78 mm2) with inherent fat-water separation capability.
- Perform anatomical imaging using a breath-hold axial 2D T1-weighted dual-echo gradient-recalled echo sequence with the following parameters:
- MR Elastography acquisition
- Place the pneumatic driver over the right anterior liver to apply mechanical vibrations at 60 Hz.
- Perform liver stiffness mapping using a 2D echo-planar imaging (EPI)-based acquisition with the following parameters:
NOTE: TR/TE = 1050.3/63.4 ms; Flip angle = 90°; Field of view = 420 × 420 mm²; Acquisition matrix = 256 × 256 (reconstructed to 256 × 256); Slice thickness = 10 mm; Bandwidth = 1953.1 Hz/pixel. - Acquire eight phase offsets to compute wave propagation and generate quantitative stiffness maps (elastograms) with values expressed in kilopascals (kPa).
- Image co-registration strategy
- Ensure accurate spatial alignment between structural images and elastograms by maintaining identical patient positioning and consistent breath-hold instructions.
- Perform all imaging in the axial plane with matching slice coverage of the liver.
- Plan the MRE sequence using the anatomical T1-weighted images as a reference to ensure optimal coverage of the liver parenchyma.
- Verify that both sequences utilize the same frame of reference to facilitate automated co-registration in the subsequent fusion process.
2. Data collection and preparation
- Renaming the folder of every sequence
NOTE: Add explicit names for each sequence, as DICOM data exported from the equipment lacks sequence identification. This facilitates subsequent analysis and processing.- Execute the Description_Name function to add descriptive names to the folders for each sequence.
- Copy all DICOM data to a customized working directory.
- Navigate to the directory containing the data in MATLAB's working directory.
- Quickly checking images of structural sequence
NOTE: Examine structural images derived from T1 imaging, which share the same coordinate system with stiffness maps and provide clear liver contour visualization essential for subsequent stiffness distribution calculations.- Generate a 3D volume matrix from the DICOM files of the MRI sequences using the following MATLAB code:
f=dir('*.dcm');
for i=1:length(f)
V(:,:,i)=dicomread(fullfile(f(i).folder,f(i).name));
End - Visualize the image sequence using MATLAB's sliceViewer function for interactive examination:
figure;
H=sliceViewer(V);colormap(gray(1024));
set(gcf, 'Toolbar', 'figure'); - Interact with the sliceViewer GUI. Use the scroll bar to browse through different slices. Verify that liver boundaries are clearly delineated with sharp contrast against surrounding tissues.
NOTE: Acceptable images should show continuous liver parenchyma without motion artifacts or blurring (Figure 1). This interactive viewer allows a quick assessment of image quality and liver morphology. - Find the icons for zooming in, zooming out, and returning to the global view in the upper-right corner of the GUI. Use the Data Tip icon to mark the coordinates of specific liver regions for further analysis.
- Observe that the default gray colormap displays values from low (black) to high (white). Right-click on the Color Bar in the pop-up menu to select different colormap options for optimal liver tissue visualization.
- If the contrast is not satisfactory, use the left mouse button to drag up and down in the middle of the figure to adjust the window level. Drag left and right to adjust the window width. The corresponding accurate contrast range will be displayed on the color bar.
NOTE: Use these interactive controls to inspect MRI structural sequence characteristics across intensity and spatial dimensions. Assess liver anatomical contour integrity and image quality before proceeding to the next step.
- Generate a 3D volume matrix from the DICOM files of the MRI sequences using the following MATLAB code:
- Quickly checking MRE stiffness maps
NOTE: Examine MRE stiffness maps for quantitative liver elasticity measurements, where different colors represent varying degrees of stiffness, which is essential for identifying fibrotic or cirrhotic areas.- Generate a 3D volume matrix from the DICOM files of the MRE sequences using the following MATLAB code:
f=dir('*.dcm');
for i=1:length(f)
V_LSD(:,:,i)=dicomread(fullfile(f(i).folder,f(i).name));
End - Visualize the MRE stiffness maps using MATLAB's sliceViewer function for interactive examination:
figure;H=sliceViewer(V_LSD);colormap(jet(1024));set(gcf, 'Toolbar', 'figure'); - Interact with the sliceViewer GUI. Use the scroll bar at the bottom of the graphical user interface (GUI) to browse through different slices in the sequence (Figure 2). Note that this interactive viewer allows a quick assessment of stiffness distribution and liver elasticity patterns.
- Find the icons for zooming in, zooming out, and returning to the global view in the upper-right corner of the GUI. Use the Data Tip icon to mark the coordinates of specific liver regions with notable stiffness values for further analysis.
- Observe that the default jet colormap represents stiffness values from low (blue) to high (red). Right-click on the Color Bar in the pop-up menu to adjust the colormap range for optimal visualization of liver stiffness gradients.
- If the contrast is not satisfactory, use the left mouse button to drag up and down in the middle of the figure to adjust the window level. Drag left and right to adjust the window width. The corresponding accurate stiffness range will be displayed on the color bar.
- Confirm that stiffness maps display smooth color transitions within the liver parenchyma. Acceptable stiffness mapping should show minimal noise artifacts and clear differentiation between liver tissue (typically in the 1-8 kPa range) and background regions.
NOTE: These interactive controls enable flexible inspection of MRE stiffness maps across both intensity space and sequence location, facilitating quick assessment of liver stiffness distribution and potential areas of fibrosis.
- Generate a 3D volume matrix from the DICOM files of the MRE sequences using the following MATLAB code:
3. Stiffness-structural fusion
NOTE: Integrate both modalities since stiffness maps alone cannot accurately localize lesions without structural image correlation.
- Define path variables for both structural images and stiffness maps, as well as scan files at approximately the same axial positions.
- Select the Struct_Stiffness_Fusion function (I_fusion = Struct_Stiffness_Fusion(I_structural, I_stiffness)) to generate Stiffness-Structural Fusion Images in the current directory.
- Locate the fusion image files in the file browser and open them using the default image viewer. Verify that anatomical structures and stiffness patterns are properly aligned.
NOTE: Acceptable fusion images should demonstrate precise overlay without spatial misregistration between structural and elastography data. Following the steps above, aligned scan axial positions automatically output the fusion image sequence, which can be viewed using common RGB image viewers.
4. The liver stiffness distribution
NOTE: To complement the fusion image analysis shown in Figure 3, generate liver stiffness distribution statistics as demonstrated in Figure 4.
- Repeat steps 1-3 to examine patients with different stages of liver cirrhosis.
- Select the LSD_compute function ([LSD_distribution, LSD_stats] = LSD_compute(V_stiffness, liver_mask)) to calculate the Patient's LSD (Liver Stiffness Distribution) values across different stiffness stages15 (Figure 4).
NOTE: The patient shown in Figure 3 is in late-stage liver fibrosis that has already progressed to cirrhosis, with the whole liver average stiffness reaching 5 kPa. Therefore, in the quantitative distribution in Figure 4, the majority of liver tissue stiffness values are above the F4 stage.
5. Final verification and data archiving
- Verify that all fusion images have been successfully generated and saved in the working directory.
- Confirm that LSD analysis results have been computed and documented for clinical interpretation.
- Archive all processed data, including structural images, stiffness maps, fusion images, and quantitative LSD metrics, for future reference and longitudinal comparison.
NOTE: The multimodal stiffness-structural fusion imaging protocol is now complete. The generated fusion images and quantitative LSD analysis provide comprehensive liver assessment data ready for clinical interpretation and patient communication.
Results
Loading...
$$\rightleftharpoonup{xx}$$
$$\longleftharp{xx}$$,
$$\longrightharp{xx}$$,
The visualization approach presented in this study offers comprehensive insights into liver structure and stiffness distribution, enabling precise assessment of liver cirrhosis. Through the GUI depicted in Figure 1, clinicians can better understand the liver's structural anatomy across multiple cross-sections, primarily evaluating its anatomical integrity. Examining Figure 2 reveals a critical limitation of isolated stiffness maps: without corresponding structural references, clinicians and patients face substantial difficulty in anatomically localizing regions of increased stiffness (represented in red). This limitation significantly impairs clinical interpretation, particularly in cases of advanced liver disease where splenomegaly commonly accompanies hepatic pathology, resulting in increased stiffness of the spleen. While Figure 2 provides approximate structural positioning, it lacks the precision necessary for accurate clinical assessment and patient communication.
The unique methodological advancement presented in this study addresses this limitation through the fusion of structural sequences (Figure 1) with stiffness maps (Figure 2) into a single integrated visualization (Figure 3). This multimodal fusion technique represents a significant innovation, enabling simultaneous visualization of anatomical structures with superimposed pseudocolor stiffness distribution patterns. This integrated approach is designed to facilitate immediate visual correlation between anatomical landmarks and stiffness patterns, providing an intuitive representation of liver pathophysiology.
This fusion imaging technique has the potential to offer substantial clinical advantages. Clinicians may benefit from enhanced diagnostic precision by directly correlating areas of increased stiffness with specific anatomical segments of the liver. Patients may better understand their condition through intuitive visual representation, potentially enhancing treatment adherence and engagement. Furthermore, this approach establishes a quantitative framework designed for future longitudinal monitoring of disease progression and therapeutic response assessment.
Figure 4 complements the qualitative fusion images with precise quantitative analysis matched to the patient visualized in Figure 3. This quantitative analysis delineates the proportional distribution of liver tissue across different fibrosis stages. The comparative analysis between the patient and healthy control subjects provides objective metrics for disease severity assessment. This quantitative framework provides a foundation for future longitudinal comparisons of the same patient at different timepoints, with the potential for precise monitoring of disease progression or regression in response to therapeutic interventions.
The case presented in Figure 3 exemplifies advanced liver fibrosis progressed to cirrhosis, with whole-liver average stiffness measurements reaching 5 kPa. Quantitative distribution analysis demonstrates that the majority of liver tissue exhibits stiffness values above the F4 threshold, consistent with cirrhotic transformation. This finding is further corroborated by the comparative analysis in Figure 4, which reveals a marked shift in stiffness distribution toward higher fibrosis stages (F4) compared to healthy controls, where stiffness values predominantly fall within the normal range.
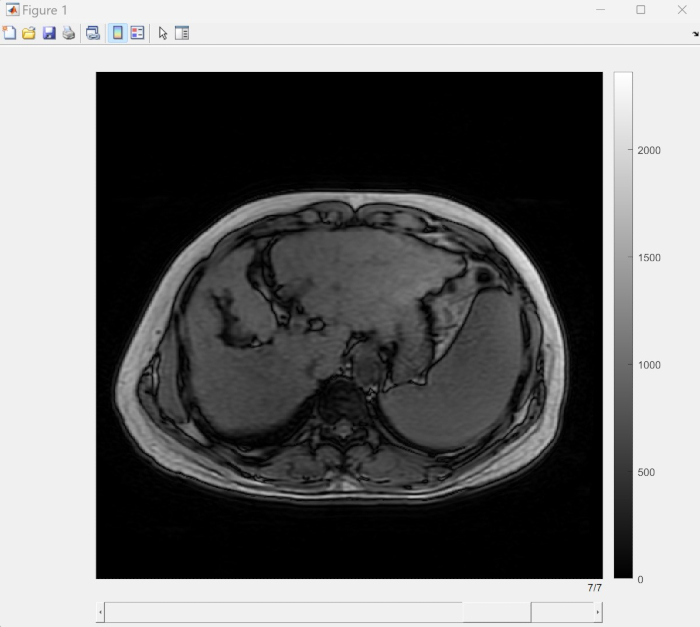
Figure 1: Interactive examination of liver structural sequence integrity. This figure displays the interactive MATLAB GUI interface showing axial MRI structural images of the liver, allowing a comprehensive assessment of liver morphology and anatomical boundaries. Please click here to view a larger version of this figure.
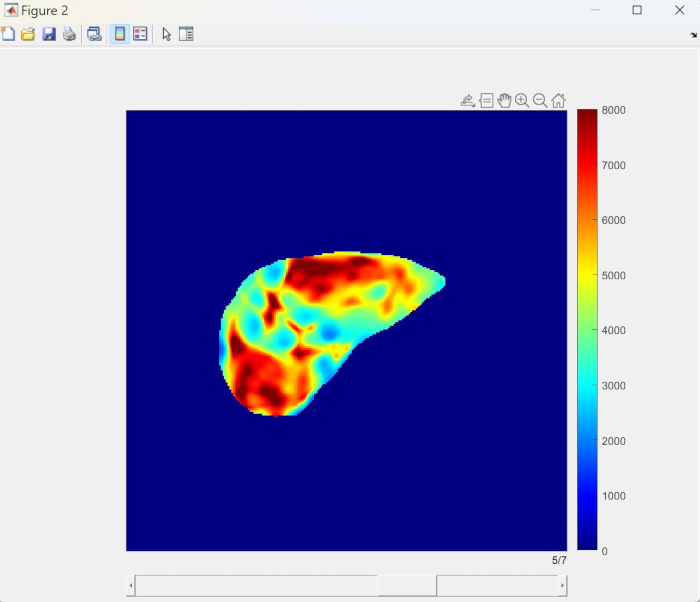
Figure 2: Interactive examination of MRE stiffness maps. This figure shows the color-coded stiffness map generated from MR elastography, where different colors represent varying degrees of tissue stiffness measured in kilopascals (kPa). Please click here to view a larger version of this figure.
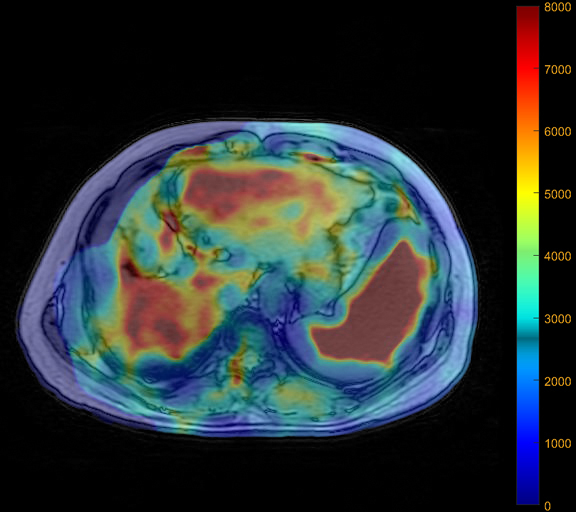
Figure 3: The Stiffness-Structural Fusion Image. This figure demonstrates the unique integration of anatomical structural information with quantitative stiffness measurements, allowing simultaneous visualization of liver anatomy and stiffness distribution patterns. Please click here to view a larger version of this figure.
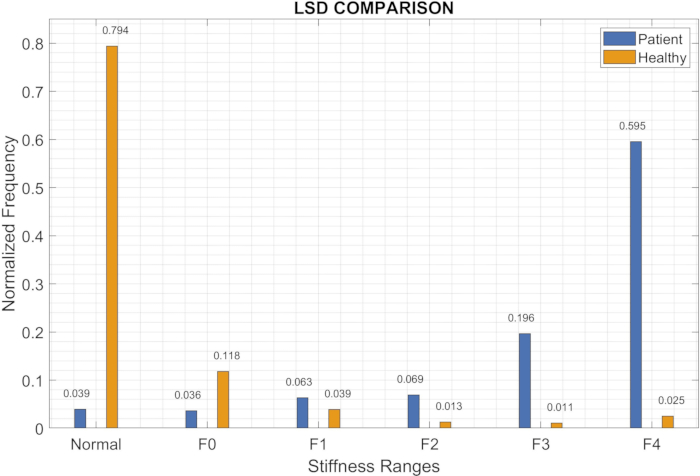
Figure 4: Patient's LSD (Liver Stiffness Distribution) values across different stiffness stages. This comparative histogram illustrates the normalized frequency distribution of liver stiffness values across different fibrosis stages (Normal, F0-F4) for both the patient (blue) and healthy control (orange). Please click here to view a larger version of this figure.
Discussion
Loading...
$$\rightleftharpoonup{xx}$$
$$\longleftharp{xx}$$,
$$\longrightharp{xx}$$,
Critical steps
Several critical steps in the protocol require particular attention to ensure the successful implementation of the multimodal stiffness-structural fusion imaging technique. First, the planning of the MRE sequence using anatomical T1-weighted images as reference ensures optimal coverage of liver parenchyma and facilitates subsequent automated co-registration15. Second, the preprocessing of DICOM data requires careful management of sequence identification. Since DICOM data exported from MRI equipment often lacks explicit sequence naming, proper application of the "Description_Name" function is crucial for differentiating structural sequences from elastography sequences. This differentiation forms the basis for all subsequent analysis and fusion operations. Third, the interactive examination confirms adequate image quality, proper liver coverage, and appropriate contrast before proceeding to the fusion process. Any inadequacies identified during this step would necessitate acquisition adjustments or image processing corrections. Finally, during the fusion process, a precise definition of path variables for both structural images and stiffness maps at approximately the same axial positions is critical for accurate spatial integration. Any misalignment at this stage would result in incongruent fusion images that could lead to misinterpretation of stiffness distribution relative to anatomical landmarks.
Modifications and troubleshooting
Several modifications and troubleshooting approaches can address common challenges in implementing this protocol. For structural imaging, if the breath-hold capability is limited in patients with advanced liver disease, respiratory-triggered or navigator-gated sequences may be substituted for the breath-hold axial 2D T1-weighted sequence. These alternatives, while increasing acquisition time, can maintain adequate image quality with reduced motion artifacts.
For MRE acquisition, if wave propagation is inadequate due to patient-specific factors (e.g., obesity, ascites), increasing the driver amplitude or repositioning the pneumatic driver may improve wave penetration4. Additionally, reducing the mechanical vibration frequency from 60 Hz to 50 Hz can enhance wave propagation at the cost of potentially reduced spatial resolution of stiffness maps. And stiffness maps typically produce minor artifacts near tissue boundaries or scan edges, so arranging scans with adequate margins at boundaries is recommended.
During interactive examination of image sequences, if contrast is suboptimal, the protocol provides specific troubleshooting steps, including window level and width adjustment using mouse dragging operations. If colormap settings are inadequate for visualizing subtle stiffness gradients, alternative colormaps can be selected through the Color Bar pop-up menu beyond the default gray (structural) or jet (stiffness).
Limitations
A limitation is the requirement for MRI equipment with specialized MR elastography capabilities, restricting application to centers with appropriate technology7,11. The current research is limited to a single-center study, with multicenter and cross-device validation studies still ongoing. Further research is needed to establish standardized protocols applicable across different MRI manufacturers, field strengths, and elastography implementations.
The current study demonstrates the technical feasibility and clinical potential of the stiffness-structural fusion imaging technique, while acknowledging the need for validation across larger, more diverse patient cohorts. This limitation is being addressed through ongoing research applying this fusion imaging approach and LSD analysis to a comprehensive cohort (n = 300) with varying stages of liver fibrosis and cirrhosis. This expanded study will establish robust diagnostic thresholds for different fibrosis stages, assess sensitivity and specificity compared to conventional ROI-based MRE, and develop predictive models integrating both qualitative fusion features and quantitative LSD metrics, including reproducibility assessments and interobserver variability analysis.
The significance of the method with respect to existing/alternative methods
The stiffness-structural fusion imaging technique represents a significant advancement over conventional MRE assessment methods in several respects16,17. Traditional MRE analysis relies on the manual placement of regions of interest (ROIs) on stiffness maps, introducing observer variability, potential sampling bias, and necessitating the participation of specialized radiologists for accurate interpretation5,7. In contrast, the fusion approach presented here eliminates this variability by enabling comprehensive whole-liver assessment. This not only improves reproducibility but also ensures that focal areas of increased stiffness are not overlooked due to sampling error. The quantitative distribution analysis across different cirrhosis stages provides a more nuanced understanding of liver parenchymal changes beyond simple mean stiffness values18,19.
Alternative non-invasive fibrosis assessment methods, such as ultrasound elastography (FibroScan), offer point measurements of stiffness but lack the comprehensive spatial mapping provided by MRE13. Blood-based biomarkers and scoring systems (FIB-4, APRI) provide indirect estimates of fibrosis but lack the direct visualization of parenchymal changes offered by this fusion technique11,12.
Furthermore, conventional side-by-side viewing of structural and stiffness images requires mental co-registration by the radiologist, increasing cognitive load and introducing potential interpretation errors7. The fusion approach streamlines this process, enabling immediate visual correlation between anatomical landmarks and stiffness patterns.
Importance and potential applications of the method in specific research areas
The stiffness-structural fusion imaging technique has broad implications for both clinical practice and research applications in hepatology. In clinical settings, the enhanced visualization facilitates more precise communication between radiologists and referring clinicians, potentially improving diagnostic confidence and treatment planning16,20.
For longitudinal monitoring of chronic liver disease, the quantitative stiffness distribution metrics provide objective parameters for assessing disease progression or regression in response to therapeutic interventions2,10. This standardized approach enables more reliable comparison across timepoints than conventional ROI-based measurements.
In the research domain, this methodology establishes a foundation for advanced radiomics analysis of liver disease16,20,21. The integration of Liver Stiffness Distribution (LSD) characteristics with immunohistochemical, biochemical, and proteomic indicators through cross-modality fusion analysis opens unprecedented cognitive perspectives in the field of liver cirrhosis. For pharmaceutical trials targeting fibrosis regression, the technique offers quantitative endpoints with potentially increased sensitivity to detect therapeutic effects compared to conventional staging systems1,2. The ability to detect changes in stiffness distribution patterns may identify treatment responses earlier than histological changes become apparent.
Additionally, the fusion technique could facilitate machine-learning approaches to liver disease characterization by providing standardized input data that combines structural and functional information20,21. This could lead to the development of computer-aided diagnosis tools that further improve diagnostic accuracy and efficiency.
In conclusion, the multimodal stiffness-structural fusion imaging technique represents a methodological advancement that bridges the gap between qualitative structural assessment and quantitative stiffness measurement in liver disease evaluation. By addressing key limitations of conventional approaches and establishing a standardized framework for comprehensive liver assessment, this technique has the potential to improve clinical management and advance research in chronic liver disease1,2.
Disclosures
Loading...
$$\rightleftharpoonup{xx}$$
$$\longleftharp{xx}$$,
$$\longrightharp{xx}$$,
The software tool for hepatic cirrhosis quantification listed in the Table of Materials of this study, LSD-Fusion V1.0, is a software tool from Beijing Intelligent Entropy Science & Technology Co Ltd. The intellectual property rights of this software tool belong to the company.
Acknowledgements
Loading...
$$\rightleftharpoonup{xx}$$
$$\longleftharp{xx}$$,
$$\longrightharp{xx}$$,
This research was supported by the Young Investigator Grant in Beijing You'an Hospital Affiliated to Capital Medical University (BJYAYY-YN2023-18) "Clinical Efficacy Observation of Ruangan Granules in the Treatment of Patients with Hepatitis B Liver Cirrhosis"; and the Fifth National Program for Outstanding Clinical Talents in Traditional Chinese Medicine (Grant No. NATCM Education [2022]-1), organized by the National Administration of Traditional Chinese Medicine of China.
Materials
| Name | Company | Catalog Number | Comments |
|---|---|---|---|
| MATLAB | GE Medical Systems | SIGNA Pioneer | 3.0 Tesla |
| MRI system | Intelligent Entropy | LSD-Fusion V1.0 | Beijing Intelligent Entropy Science & Technology Co Ltd. Modeling for CT/MRI fusion |
| Tools for Modeling | MathWorks | 2022B | Computing and visualization |
References
Loading...
$$\rightleftharpoonup{xx}$$
$$\longleftharp{xx}$$,
$$\longrightharp{xx}$$,
- Fibrosis: from mechanisms to medicines. Nature. 587, 555-566 (2020).">Henderson, N. C., Rieder, F., Wynn, T. A. Fibrosis: from mechanisms to medicines. Nature. 587, 555-566 (2020).
- Liver fibrosis: Pathophysiology, pathogenetic targets and clinical issues. Mol Aspects Med. 65, 37-55 (2019).">Parola, M., Pinzani, M. Liver fibrosis: Pathophysiology, pathogenetic targets and clinical issues. Mol Aspects Med. 65, 37-55 (2019).
- Diagnostic performance of magnetic resonance elastography in predicting hepatic fibrosis and portal hypertension in patients with chronic liver disease: a systematic review and meta-analysis. AJR Am J Roentgenol. 207 (4), 775-784 (2016).">Singh, S., et al. Diagnostic performance of magnetic resonance elastography in predicting hepatic fibrosis and portal hypertension in patients with chronic liver disease: a systematic review and meta-analysis. AJR Am J Roentgenol. 207 (4), 775-784 (2016).
- Resolving the fibrotic niche of human liver cirrhosis at single-cell level. Nature. 575, 512-518 (2019).">Ramachandran, P., et al. Resolving the fibrotic niche of human liver cirrhosis at single-cell level. Nature. 575, 512-518 (2019).
- Assessment of hepatic fibrosis with magnetic resonance elastography. Clin Gastroenterol Hepatol. 5 (10), 1207-1213.e2 (2007).">Yin, M., et al. Assessment of hepatic fibrosis with magnetic resonance elastography. Clin Gastroenterol Hepatol. 5 (10), 1207-1213.e2 (2007).
- Magnetic resonance elastography for staging liver fibrosis in chronic hepatitis C. Magn Reson Med. 68 (3), 767-772 (2012).">Ichikawa, S., et al. Magnetic resonance elastography for staging liver fibrosis in chronic hepatitis C. Magn Reson Med. 68 (3), 767-772 (2012).
- Magnetic resonance elastography for the detection and staging of liver fibrosis in chronic hepatitis B. Eur Radiol. 24 (1), 70-78 (2014).">Venkatesh, S. K., et al. Magnetic resonance elastography for the detection and staging of liver fibrosis in chronic hepatitis B. Eur Radiol. 24 (1), 70-78 (2014).
- NAFLD as a continuum: From obesity to metabolic syndrome and diabetes. Diabetol Metab Syndr. 12, 60(2020).">Godoy-Matos, A. F., Silva Júnior, W. S., Valerio, C. M. NAFLD as a continuum: From obesity to metabolic syndrome and diabetes. Diabetol Metab Syndr. 12, 60(2020).
- Non-invasive testing and risk-stratification in patients with MASLD. Eur J Intern Med. 122, 11-19 (2024).">Zoncapè, M., Liguori, A., Tsochatzis, E. A. Non-invasive testing and risk-stratification in patients with MASLD. Eur J Intern Med. 122, 11-19 (2024).
- Imaging-based non-invasive liver disease assessment for staging liver fibrosis in chronic liver disease: A systematic review supporting the AASLD Practice Guideline. Hepatology. 81 (2), 725-748 (2025).">Duarte-Rojo, A., et al. Imaging-based non-invasive liver disease assessment for staging liver fibrosis in chronic liver disease: A systematic review supporting the AASLD Practice Guideline. Hepatology. 81 (2), 725-748 (2025).
- Non-invasive assessment of liver disease in patients with nonalcoholic fatty liver disease. Gastroenterology. 156 (5), 1264-1281 (2019).">Castera, L., Friedrich-Rust, M., Loomba, R. Non-invasive assessment of liver disease in patients with nonalcoholic fatty liver disease. Gastroenterology. 156 (5), 1264-1281 (2019).
- Non-alcoholic fatty liver disease: Causes, diagnosis, cardiometabolic consequences, and treatment strategies. Lancet Diabetes Endocrinol. 7 (4), 313-324 (2019).">Stefan, N., Häring, H. U., Cusi, K. Non-alcoholic fatty liver disease: Causes, diagnosis, cardiometabolic consequences, and treatment strategies. Lancet Diabetes Endocrinol. 7 (4), 313-324 (2019).
- Comparison of laboratory tests, ultrasound, or magnetic resonance elastography to detect fibrosis in patients with nonalcoholic fatty liver disease: A meta-analysis. Hepatology. 66 (5), 1486-1501 (2017).">Xiao, G., et al. Comparison of laboratory tests, ultrasound, or magnetic resonance elastography to detect fibrosis in patients with nonalcoholic fatty liver disease: A meta-analysis. Hepatology. 66 (5), 1486-1501 (2017).
- Head-to-head comparison between MEFIB, MAST, and FAST for detecting stage 2 fibrosis or higher among patients with NAFLD. J Hepatol. 77 (6), 1482-1490 (2022).">Kim, B. K., et al. Head-to-head comparison between MEFIB, MAST, and FAST for detecting stage 2 fibrosis or higher among patients with NAFLD. J Hepatol. 77 (6), 1482-1490 (2022).
- A three-dimensional digital model for early diagnosis of hepatic fibrosis based on magnetic resonance elastography. J Vis Exp. (197), e65507(2023).">Liu, Y., et al. A three-dimensional digital model for early diagnosis of hepatic fibrosis based on magnetic resonance elastography. J Vis Exp. (197), e65507(2023).
- Radiomics in prostate cancer: an up-to-date review. Ther Adv Urol. 14, 175628722211090(2022).">Ferro, M., et al. Radiomics in prostate cancer: an up-to-date review. Ther Adv Urol. 14, 175628722211090(2022).
- Direct comparison of US and MR elastography for staging liver fibrosis in patients with nonalcoholic fatty liver disease. Clin Gastroenterol Hepatol. 20 (4), 908-917.e11 (2022).">Imajo, K., et al. Direct comparison of US and MR elastography for staging liver fibrosis in patients with nonalcoholic fatty liver disease. Clin Gastroenterol Hepatol. 20 (4), 908-917.e11 (2022).
- Correlation of MR elastography with morphometric quantification of liver fibrosis (Fibro-C-Index) in chronic hepatitis B. Magn Reson Med. 72 (4), 1123-1129 (2014).">Venkatesh, S. K., et al. Correlation of MR elastography with morphometric quantification of liver fibrosis (Fibro-C-Index) in chronic hepatitis B. Magn Reson Med. 72 (4), 1123-1129 (2014).
- Early detection of nonalcoholic steatohepatitis in patients with nonalcoholic fatty liver disease by using MR elastography. Radiology. 259 (3), 749-756 (2011).">Chen, J., et al. Early detection of nonalcoholic steatohepatitis in patients with nonalcoholic fatty liver disease by using MR elastography. Radiology. 259 (3), 749-756 (2011).
- Artificial intelligence in liver diseases: Improving diagnostics, prognostics and response prediction. JHEP Rep. 4 (4), 100443(2022).">Nam, D., et al. Artificial intelligence in liver diseases: Improving diagnostics, prognostics and response prediction. JHEP Rep. 4 (4), 100443(2022).
- Radiomics in early lung cancer diagnosis: From diagnosis to clinical decision support and education. Diagnostics (Basel). 12 (5), 1064(2022).">Wu, Y. J., et al. Radiomics in early lung cancer diagnosis: From diagnosis to clinical decision support and education. Diagnostics (Basel). 12 (5), 1064(2022).
Reprints and Permissions
Request permission to reuse the text or figures of this JoVE article
Request Permission