This protocol presents a machine learning pipeline using XGBoost and SHAP to predict drug sensitivity in breast cancer. The workflow includes data preprocessing, hybrid modeling, SHAP-based interpretation, synergy scoring, and PCA clustering to identify potent drugs and understand key biological factors influencing therapeutic response.
A subscription to JoVE is required to view this content. Sign in or start your free trial.
Method Article
Data-Driven Drug Discovery Optimization for Breast Cancer Using Interpretable Machine Learning Models
In This Article
Summary
Abstract
Breast cancer remains one of the most prevalent malignancies worldwide, posing significant therapeutic challenges due to tumor heterogeneity and drug resistance. This study presents a reproducible, data-driven machine learning protocol for predicting drug sensitivity in breast cancer cell lines, with the dual objective of identifying potent single agents and synergistic drug combinations. Using curated datasets from the Genomics of Drug Sensitivity in Cancer (GDSC), two predictive approaches were implemented: a standalone XGBoost regressor and a hybrid Autoencoder-XGBoost pipeline. Preprocessing included label encoding, one-hot encoding, Z-score standardization, missing value imputation, and dimensionality reduction via PCA. Model evaluation demonstrated that XGBoost achieved superior performance (MSE = 1.3789, R2 = 0.8145) compared to the hybrid model (MSE = 4.0322, R2 = 0.4577). Interpretability was addressed using SHapley Additive exPlanations (SHAP), which identified TARGET_PATHWAY, DRUG_ID, TARGET, and CELL_LINE_NAME as key predictive features, aligning with established pharmacological mechanisms. Predicted synergy scores, derived from combining model outputs with DrugComb and SynergyDB data, highlighted promising drug pairs such as Bortezomib + Romidepsin and Paclitaxel + Bortezomib. These findings were further supported by PCA-based pharmacological clustering, revealing biologically relevant groupings of drugs with similar mechanisms of action. The proposed protocol provides a transparent and adaptable framework for precision oncology research, enabling both predictive accuracy and biological interpretability. By integrating rigorous preprocessing, model validation, explainability, and drug synergy analysis, this workflow offers a scalable foundation for translational drug discovery and repurposing in breast cancer treatment.
Introduction
Breast cancer remains the most commonly diagnosed cancer and the second leading cause of cancer-related death among women globally1. In the United States alone, it accounts for nearly 30% of all new female malignancies, with over 280,000 new cases diagnosed annually2. Despite therapeutic advances, particularly in HER2-positive and hormone receptor-positive subtypes, resistance to treatment and recurrence remain critical challenges-especially for aggressive subtypes like triple-negative breast cancer (TNBC), which lacks targeted therapies3,4. This underscores the urgent need for precision-driven drug discovery to identify effective therapeutic agents and combinations tailored to individual molecular profiles. Drug discovery, traditionally guided by experimental and trial-and-error methods, has seen remarkable acceleration through the integration of machine learning (ML) techniques5,6. ML enables the modeling of complex, nonlinear relationships across high-dimensional biomedical data and can assist in target identification, biomarker discovery, drug sensitivity prediction, and combination therapy design7,8. However, the practical deployment of ML models in oncology faces several hurdles, including model interpretability, reproducibility, overfitting on sparse datasets, and generalization across cancer subtypes9,10,11.
To overcome these limitations, recent research has focused on combining deep learning for feature extraction with ensemble learning for robust prediction. In studies evaluating multiple algorithms, models such as Artificial Neural Networks (ANN) achieved accuracy levels up to 93.2%, outperforming conventional classifiers like Naïve Bayes and Decision Trees12. Additionally, integrated feature mining techniques have uncovered key driver genes and molecular targets through databases like GEO (Gene Expression Omnibus) and GSE45827, identifying up to 1,700 differentially expressed genes, some of which exhibit known drug interactions13. Further, novel drug repurposing studies have revealed the potential of non-oncology compounds like calcitriol to reduce breast cancer cell viability more effectively than standard treatments like neratinib, especially in HER2+ cell lines14. Investigations into the Akt-signaling pathway have also shown promise in overcoming trastuzumab resistance, suggesting molecular pathway targeting as an alternative to receptor-focused therapy15,16. Yet, despite these advancements, a systematic and explainable framework capable of predicting continuous drug response values, ranking effective drug combinations, and visualizing pharmacological similarities remains underexplored in the current literature. Many models are either classification-based or lack translational clarity, especially when applied to real-world pharmacogenomic datasets.
Drug discovery and decision-making can be improved by machine learning (ML), which offers instruments for high-quality data. All phases of drug discovery, including target validation, biomarker identification, and clinical trial analysis, can benefit from the use of machine learning. Interpretability and reproducibility of ML-generated outcomes are obstacles, too17. Reducing failure rates and expediting the process can be achieved by addressing these problems and raising knowledge of validation variables. Using machine learning algorithms, the researchers assessed biopsy samples at various stages of cancer. Test accuracies were high, with ANN 93.2%, Naïve Bayes (NB) 90.4%, Decision Tree (DT) 87.8%, and RF 85.9%, according to the findings. A total of 350 predicted genes and 164 differentially expressed genes were found by combining the GEO database by Rakhshaninejad et al.18. In the combined dataset, the Binary Grey Wolf Optimization with Simulated Annealing Ensemble (BGWO_SA_Ens) algorithm found 1404 genes, while in the GSE45827 dataset, it found 1710. Around 35 superior genes, along with their roles in important pathways and the relationships between superior genes and anticancer medications, were found. To find target genes from the Epidermal Growth Factor Receptor (EGFR (EGFR) overexpression signaling pathway and their related family members, molecular networking investigations were carried out by Nagaraj et al.19 A medication called calcitriol, which is authorized to treat conditions unrelated to cancer, had strong binding affinities with each of the four receptors. According to in vitro cytotoxicity studies, calcitriol reduced SK-BR-3 cell viability in a dose-dependent manner, indicating superior cytotoxicity and reduced proliferation of breast cancer cells in comparison to neratinib. An active and druggable Akt-signaling pathway was suggested by Jernström et al.20 that two cell lines that were trastuzumab-insensitive were responsive to an Akt1/2 kinase inhibitor. Instead of focusing on HER2 amplification or expression, the study recommends targeting the Akt-signaling pathway and taking molecular aspects into account when making treatment decisions. Thirty percent of new female malignancies in the US are breast cancers, making it the most frequent malignant disease among women. The goal of Witt and Tollefsbol21 was to develop a fundamental tool that would help researchers select a breast cancer cell line for use in xenograft experiments, cancer prevention, and epigenetic discoveries, among other fields. Also covered are debates about the provenance of specific breast cancer cell lines and the advantages of employing patient-derived xenograft (PDX) as opposed to cell-derived xenograft (CDX). The use of drug prediction techniques to provide new drug discovery hypotheses was examined in Gruener et al.22, with a focus on triple-negative breast cancer (TNBC). On the basis of cell line transcriptome data, machine learning models of drug response were constructed and then applied to patient tumor data. The findings demonstrated that the Wee1 inhibitor AZD-1775 had preferential action in TNBC and that TP53 mutations were strongly linked to its effectiveness. In order to forecast unknown drug-target interactions in breast cancer research, Song et al23 present a feature-based approach dubbed Pseudo Position-Specific Physicochemical Property-Derived Composition for Drug-Target Interaction Prediction (PsePDC-DTIs), which makes use of protein sequences, the Deep Canonical Correlation Analysis (DCCA) coefficient, and a molecular fingerprint descriptor. The technique predicts DTIs on four gold standard datasets using a random forest classifier and handles unbalanced data using SMOTE. Additionally, the model uses risk genes from genome-wide genetic research to investigate novel targets for the therapy of breast cancer. The model's superiority and validity are demonstrated by the ten possible DTIs it offers for therapy. Ten to twenty percent of instances of breast cancer are triple-negative breast cancer (TNBC). There are currently no targeted therapies for TNBC, despite advancements in HER2+ and hormonal receptor+ treatments24. Although the EGFR is expressed by the majority of patients, early studies did not find any discernible activity. Future experimental treatments for TNBC are suggested by recent findings and clinical advancements25.
Despite the growing integration of machine learning in drug discovery, current models often lack interpretability and reproducibility, limiting their translational application. While prior studies have explored classification accuracy and gene mining, few have systematically predicted continuous drug sensitivity (like LN_IC50) using hybrid interpretable models. Moreover, the combination of dimensionality reduction techniques with robust regressors remains underexplored in the context of breast cancer treatment. This study addresses that gap by introducing and evaluating a dual-pipeline strategy -- XGBoost and Autoencoder-XGBoost -- for high-fidelity prediction of drug response, coupled with explainability and synergy mapping tools for real-world clinical applicability.
Access restricted. Please log in or start a trial to view this content.
Protocol
1. Dataset acquisition
- Download drug sensitivity data from GDSC (https://www.cancerrxgene.org/downloads/drug_data). A summary of the used dataset is provided in Table 1. Files used are gdsc_drug_data.csv (drug response), gdsc_expression_data.csv (gene expression), and gdsc_cell_metadata.csv (cell line info).
See Figure 1 for an example of the dataset structure used in this workflow. - Filter the dataset to include only breast cancer cell lines using Python (Pandas library).
- Select records where the TCGA_DESC column equals "Breast".
- Extract corresponding CELL_LINE_NAME values.
- Refer to Supplementary Code 1 (Supplementary File 1) for implementation.
NOTE: Restricting the dataset to breast cancer cell lines ensures domain-specific model training and improves biological validity. The dataset employed in this study was retrieved from the Genomics of Drug Sensitivity in Cancer (GDSC) database, and its key features are presented in Table 2.
2. Data preprocessing
- The preprocessing pipeline:
- Encode categorical variables such as DRUG_ID, CELL_LINE_NAME, and TARGET_PATHWAY using LabelEncoder to convert them into integer-based formats suitable for XGBoost input.
- Normalize numerical features, including gene expression data, copy number alterations (CNA), and methylation features, using Z-score standardization (StandardScaler) to ensure zero mean and unit variance.
- Remove samples with more than 30% missing features.
- Impute remaining missing values using the median of each respective feature column with SimpleImputer(strategy='median').
- Apply one-hot encoding to categorical variables (DRUG_ID and TARGET_PATHWAY) using OneHotEncoder from scikit-learn.
- Perform dimensionality reduction on gene expression features using Principal Component Analysis (PCA) to reduce feature space while preserving variance.
- Split the final cleaned dataset into training (80%) and testing (20%) sets using train_test_split from scikit-learn, maintaining the distribution of drug-cell pairs.
NOTE: The detailed rationale for each preprocessing step and the resulting dataset dimensions is discussed in the Discussion section.
- Handle categorical variables
- Identify categorical variables (CELL_LINE_NAME, DRUG_NAME, TARGET_PATHWAY) using Pandas.
- Apply label encoding to these variables using scikit-learn's LabelEncoder.
- Implement this step programmatically as shown in Supplementary Code 2 (Supplementary File 1).
NOTE: Machine learning algorithms require numeric inputs; label encoding converts categorical variables into integer format while preserving class distinctions.
- Standardize numerical features
- Identify numerical variables across gene expression, copy number alteration (CNA), and methylation features.
- Apply StandardScaler to normalize features to zero mean and unit variance.
NOTE: Standardization ensures that all numeric features contribute equally to the model by rescaling them to have zero mean and unit variance. This prevents features with larger scales from dominating model training and improves convergence in optimization algorithms.
- Treat missing values
- Detect missing entries across all features.
- Remove records with more than 30% missing data.
- Impute remaining missing values using the median imputation strategy.
NOTE: Incomplete data can introduce bias and reduce model robustness. Removing heavily missing records ensures data reliability, while median imputation provides a stable and outlier-resistant method to preserve usable information without introducing strong distributional assumptions.
- Split the dataset
- Use an automated method (e.g., train_test_split from sikit-learn) to divide the final cleaned dataset into training and testing subsets.
- Specify a random seed (e.g., random_state=42) to ensure reproducibility.
- Allocate 80% of the data to the training set and 20% to the testing set.
- Refer to Supplementary Code 3 (Supplementary File 1) for the full code implementation.
NOTE: Dividing data into training and test subsets allows for unbiased evaluation of model generalizability.
3. Modeling framework
- Define regression objective
- Frame the prediction task as a regression problem to estimate the natural logarithm of half-maximal inhibitory concentration (LN_IC50) for each drug-cell line pair.
- Choose LN_IC50 as the target variable to stabilize variance and improve the model.
NOTE: Transforming IC50 to LN_IC50 reduces skewness and improves model performance.
- Train XGBoost Regressor (Model 1)
- Select XGBoost as the primary model due to its strong performance on structured pharmacogenomic datasets and ability to model nonlinear feature interactions with regularization to prevent overfitting.
- Initialize the model programmatically using the XGBRegressor class from the xgboost library. Specify tuned hyperparameters (learning rate, maximum depth, number of estimators, and random seed) identified through cross-validation.
- Train the model on the training subset (X_train, y_train) using the fit() method.
- Generate predictions on the test subset (X_test) using the predict() method.
- Evaluate performance using Mean Squared Error (MSE) and R² score with scikit-learn's mean_squared_error and r2_score functions.
NOTE: Refer to Supplementary Code 4 (Supplementary File 1) for the full implementation.
- Consider alternative models
- Assess Support Vector Regression (SVR) for its robustness in small-sample, high-dimensional data settings.
- Evaluate an Autoencoder-XGBoost hybrid for potential performance gains through deep latent feature extraction and nonlinear modeling.
- Compare performance across models using identical evaluation metrics and cross-validation.
NOTE: SVR was excluded from the final results due to lower predictive accuracy compared with XGBoost, while the Autoencoder-XGBoost hybrid was retained for comparison of deep learning and machine learning approaches.
- Model 1: XGBoost Regressor
- Select XGBoost as the baseline model due to its strong performance on structured biomedical data, its capability to model nonlinear feature interactions, and its built-in regularization that reduces overfitting.
- Configure the XGBoost model with hyperparameters learning_rate = 0.05, max_depth = 6, and n_estimators = 100.
- Optimize hyperparameters using grid search and validate performance with 5fold crossvalidation.
- Train the model on the prepared training dataset (X_train, y_train).
- Evaluate predictive performance using Mean Squared Error (MSE) and R² score computed with scikitlearn's mean_squared_error and r2_score functions.
NOTE: Prior studies26 have shown that XGBoost consistently outperforms deep learning models on tabular biomedical datasets with lower computational cost.
- Build Hybrid Autoencoder + XGBoost Model (Model 2)
- Design an Autoencoder for unsupervised dimensionality reduction
NOTE: Encoder compresses input features into a low-dimensional latent representation. Decoder reconstructs input to minimize reconstruction error. - Train the Autoencoder on the full feature matrix to extract latent features.
- Pass the encoder's output (latent features) as input to an XGBoost regressor, as shown in Supplementary code 5A (Supplementary File 1).
- Train the XGBoost regressor on the encoded feature set with LN_IC50 as the target variable, as shown in Supplementary Code 5B (Supplementary File 1).
- Evaluate model performance using the same metrics as Model 1 for direct comparison.
NOTE: This hybrid approach leverages deep learning-based representation learning and XGBoost's strong regression capability, providing an advantage for high-dimensional biological data.
- Design an Autoencoder for unsupervised dimensionality reduction
- Model evaluation
- Evaluate the trained regression model by predicting target values using the predict() method on the test dataset (X_test).
- Calculate the Mean Squared Error (MSE) to measure the average squared difference between the predicted and actual LN_IC50 values using mean_squared_error(y_test, y_pred) from scikit-learn.
NOTE: Together, these models combine interpretability and precision, forming a robust framework for predicting drug sensitivity in breast cancer research27,28.
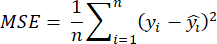
where yi denotes the true LN_IC50 for the ith drug-cell pair, is the corresponding predicted value, and n is the total number of observations. For the autoencoder, the reconstruction loss is given by,

where X is the input feature matrix, E(·) is the encoder function mapping X to a latent representation, and D(·) is the decoder function reconstructing X from the latent space. - Compute the R2 score to determine the proportion of variance in the target variable explained by the model using r2_score(y_test, y_pred) from scikit-learn.
- Record the computed MSE and R2 values for reporting. The computed MSE and R² values are summarized in Table 3 to clearly present and directly compare the performance of the different models.
- Interpret the evaluation metrics: lower MSE indicates higher predictive accuracy, and an R2 score closer to 1 indicates stronger explanatory power and better generalization capability of the model.
- SHAP explainability
- Install and import the SHAP library (import shap). Ensure the version is 0.41.0 for reproducibility.
- Initialize the SHAP explainer using the trained XGBoost model by following supplementary code 6 (Supplementary File 1).
- Compute SHAP values for the test dataset to obtain feature contribution scores.
- Generate a global feature importance summary plot to visualize which features contribute most to predictions.
- Create an individual prediction explanation for a selected sample using the SHAP waterfall plot.
- Interpret the plots to identify key features influencing predictions. As shown in Table 4, critical features include TARGET_PATHWAY, DRUG_ID, CELL_LINE_NAME, TARGET protein, and Screen Medium, indicating that drug-specific and cell-specific properties significantly affect drug response predictions.
NOTE: SHAP values were computed using shap.TreeExplainer() for XGBoost models. Global feature importance was visualized using shap.summary_plot(), and per-sample explanations were generated with shap.dependence_plot() and shap.waterfall_plot() (SHAP v0.41.0) As shown in Table 4, the most influential features included TARGET_PATHWAY, DRUG_ID, and CELL_LINE_NAME, indicating that both drug-specific and cell-specific properties were critical in determining drug response. Additional key contributors were the TARGET protein and Screen Medium, further emphasizing the model's alignment with domain-relevant factors in cancer pharmacogenomics.
- Drug synergy and clustering
- Download synergy data
- Download drug combination synergy data from publicly available repositories:
DrugComb:https://drugcomb.fimm.fi
SynergyDB: https://synergy.bioinformatics.nl
- Download drug combination synergy data from publicly available repositories:
- Merge synergy data with predicted response.
- Use drug-cell line combinations as unique keys to merge downloaded synergy scores (ZIP, Bliss, Loewe, HSA) with predicted drug response values (LN_IC50).
- Ensure alignment of drug identifiers and cell line names between datasets before merging.
- Compute model-based synergy scores.
- For each drug pair, compute the combined predicted efficacy using the average of individual modelpredicted LN_IC50 values:
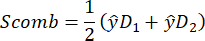
Where, Scomb denotes the combined predicted LN_IC50 score for a drug pair, is the predicted LN_IC50 for drug 1.
 - Rank drug combinations based on synergy scores.
- Identify top combinations (e.g., Bortezomib + Romidepsin, Vinblastine + Dactinomycin) that exhibit the lowest synergy scores, indicating higher predicted effectiveness.
NOTE: A lower synergy score reflects greater predicted therapeutic potential, making these drug pairs candidates for further experimental validation. Follow the steps given in Supplementary code 7A and Supplementary code 7B (Supplementary File 1).
- For each drug pair, compute the combined predicted efficacy using the average of individual modelpredicted LN_IC50 values:
- Download synergy data
- Synergy ranking and PCA-based clustering
- Rank drug pairs by synergy score.
- Merge synergy scores (ZIP, Bliss, Loewe, HSA) with predicted LN_IC50 values using drug-cell line combinations as unique keys.
- Compute synergy scores for each drug pair using the average predicted LN_IC50 values:
- Rank drug pairs based on computed synergy scores.
- Identify drug pairs with the lowest (most negative) scores as potential synergistic combinations (e.g., Bortezomib + Romidepsin, Vinblastine + Dactinomycin).
- Perform PCA on the drug response matrix.
- Construct a drug response matrix using predicted LN_IC50 values with drugs as rows and cell lines as columns, following the steps shown in Supplementary Code 8 (Supplementary File 1).
- Standardize the matrix using zscore normalization.
- Perform Principal Component Analysis (PCA) with two principal components (n_components = 2) to reduce dimensionality and capture major variance.
- Visualize PCA clusters
- Plot the two-dimensional PCA projection using Matplotlib or Seaborn.
- Confirm that drugs with similar mechanisms of action (e.g., Docetaxel and Paclitaxel) cluster together, validating the model's ability to capture biologically meaningful relationships.
- Model stability and feature balance
- Filter infrequent categorical variables during encoding to avoid sparsity issues.
- Tune autoencoder learning rates and include dropout layers to prevent convergence issues.
- Restrict SHAP analysis to the top 100 features to reduce memory overhead and ensure computational efficiency.
- Rank drug pairs by synergy score.
Access restricted. Please log in or start a trial to view this content.
Results
This study focused on optimizing drug selection and predicting combinatorial efficacy for breast cancer using advanced machine learning models. The dataset included a curated and filtered panel of breast cancer cell lines, drug sensitivity metrics (LN_IC50, AUC, Z-Score), and molecular descriptors such as CNA, methylation, gene expression, tissue descriptors, and drug targets. The primary objective was to predict the LN_IC50 (natural log of half-maximal inhibitory concentration) of individual drugs across cell lines, ide...
Access restricted. Please log in or start a trial to view this content.
Discussion
This study presents an integrated machine learning pipeline to adapt to the choice of the drug, predict synergistic combinations, and identify the possibilities of drug repurposing. Data from the GDSC database and synergy repositories (e.g., SynergyDB, DrugComb) were integrated to curate a comprehensive panel of drug-cell line interactions, encompassing molecular characteristics (e.g., gene expression, copy number alterations) and pharmacological responses31. The primary purpose here was to make a...
Access restricted. Please log in or start a trial to view this content.
Disclosures
The authors declare that there are no conflicts of interest related to this work. We confirm that large language model (LLM) technology (ChatGPT, developed by OpenAI) was used in a limited capacity during the early stages of manuscript preparation. Specifically, ChatGPT was employed for idea generation and preliminary brainstorming of conceptual frameworks, which were subsequently refined, validated, and fully rewritten by the authors. All core scientific content, data analysis, interpretation, and final drafting were performed exclusively by the authors. The outputs from ChatGPT were critically reviewed for accuracy, coherence, and integrity before inclusion, in compliance with the journal's transparency and ethical guidelines. All authors have reviewed and approved the final version of the manuscript and confirm that there are no financial, personal, or professional relationships that could be construed to influence the content of this publication.
Acknowledgements
The authors sincerely acknowledge the institutional support provided by the Department of Computer Science, Christ University, which facilitated the computational resources and academic environment necessary to conduct this research. We are also grateful for the collaborative guidance and encouragement extended by our colleagues and mentors throughout the course of this work.
AUTHOR CONTRIBUTION:
Dyuti Banerjee conceived the study, designed the methodology, and curated the dataset. Sivaneasan Bala Krishnan and Kamal Upreti implemented the machine learning models and performed the computational analysis. Sumegh Shrikant Tharewal and Uma Shankar contributed to data preprocessing, feature engineering, and validation of results. Pravin Kshirsagar conducted the synergy analysis and PCA-based clustering. Manoj Kumar assisted with the literature review, interpretation of findings, and manuscript drafting. All authors contributed to manuscript revision, approved the final version, and agree to be accountable for all aspects of the work.
Access restricted. Please log in or start a trial to view this content.
Materials
| Name | Company | Catalog Number | Comments |
|---|---|---|---|
| Autoencoder (Deep Learning Model) | TensorFlow (Google) | https://www.tensorflow.org | Dimensionality reduction and feature encoding for drug response modeling |
| Bortezomib | Selleck Chemicals | S1013 | Drug used in synergy analysis |
| Dactinomycin | Sigma-Aldrich | D1037 | Drug used in synergy analysis |
| Docetaxel | Sigma-Aldrich | D1080 | Drug used for mechanism-based clustering validation |
| Matplotlib Library | Python Package Index (PyPI) | https://matplotlib.org | Data visualization and plotting in Python |
| NumPy Library | Python Package Index (PyPI) | https://numpy.org | Numerical computing and matrix operations |
| Paclitaxel | Sigma-Aldrich | T7191 | Drug used for mechanism-based clustering validation |
| Pandas Library | Python Package Index (PyPI) | https://pandas.pydata.org | Data manipulation and processing |
| Python 3.10 | Python Software Foundation | https://www.python.org | Primary programming language |
| Romidepsin | Selleck Chemicals | S3020 | Drug used in synergy analysis |
| Scikit-learn Library | Python Package Index (PyPI) | https://scikit-learn.org | Machine learning modeling and preprocessing tools |
| Seaborn Library | Python Package Index (PyPI) | https://seaborn.pydata.org | Data visualization and statistical plotting |
| SHAP Library | Python Package Index (PyPI) | https://shap.readthedocs.io | Explainable AI model interpretability |
| Synergy Data (DrugComb) | FIMM, Finland | https://drugcomb.fimm.fi | Drug synergy reference dataset |
| Synergy Data (SynergyDB) | University of Groningen | https://synergy.bioinformatics.nl | Drug synergy reference dataset |
| TensorFlow 2.11 | https://www.tensorflow.org | Autoencoder deep learning model implementation | |
| Vinblastine | Sigma-Aldrich | V1377 | Drug used in synergy analysis |
| XGBoost Library | Python Package Index (PyPI) | https://xgboost.readthedocs.io | Gradient boosting regression modeling |
References
- Vamathevan, J., et al. Applications of machine learning in drug discovery and development. Nat Rev Drug Discov. 18 (6), 463-477 (2019).
- Dara, S., Dhamercherla, S., Jadav, S. S., Babu, C. M., Ahsan, M. J. Machine learning in drug discovery: a review. Artif Intell Rev. 55 (3), 1947-1999 (2022).
- Drug discovery for breast cancer based on big data analytics techniques. Constantine, R. M., Batouche, M. 5th International Conference on Information & Communication Technology and Accessibility (ICTA), Marrakech, Morocco, , (2015).
- Elbadawi, M., Gaisford, S., Basit, A. W. Advanced machine-learning techniques in drug discovery. Drug Discov Today. 26 (3), 769-777 (2021).
- Sarkar, C., et al. Artificial intelligence and machine learning technology-driven modern drug discovery and development. Int J Mol Sci. 24 (3), 2026(2026).
- Liao, M., et al. Small-molecule drug discovery in triple negative breast cancer: current situation and future directions. J Med Chem. 64 (5), 2382-2418 (2021).
- You, Y., et al. Artificial intelligence in cancer target identification and drug discovery. Signal Transduct Target Ther. 7 (1), 156(2022).
- Kolahi Azar, H., et al. The progressive trend of modeling and drug screening systems of breast cancer bone metastasis. J Bio Eng. 18 (1), 14(2024).
- Singh, A., et al. Coumarin as an elite scaffold in anti-breast cancer drug development: design strategies, mechanistic insights, and structure-activity relationships. Biomedicines. 12 (6), 1192(2024).
- Baptista, D., Ferreira, P. G., Rocha, M. Deep learning for drug response prediction in cancer. Brief Bioinform. 22 (1), 360-379 (2021).
- Priya, S., et al. Machine learning approaches and their applications in drug discovery and design. Chem Biol Drug Des. 100 (1), 136-153 (2022).
- Ferraro, E., et al. Accelerating drug development in breast cancer: new frontiers for ER inhibition. Cancer Treat Rev. 109, 102432(2022).
- Arvindekar, A., et al. Unveiling promising bioactives for breast cancer: a novel approach for herbal-based drug discovery. Phytochem Rev. 24, 3221-3264 (2024).
- Vatansever, S., et al. AI- and ML-aided drug discovery in CNS diseases: state-of-the-art and future directions. Med Res Rev. 41 (3), 1427-1473 (2021).
- Nayarisseri, A., et al. Artificial intelligence, big data, and machine learning approaches in precision medicine and drug discovery. Curr Drug Targets. 22 (6), 631-655 (2021).
- Eckhardt, B. L., et al. Strategies for the discovery and development of therapies for metastatic breast cancer. Nat Rev Drug Discov. 11 (6), 479-497 (2012).
- Optimizing drug discovery for breast cancer in a laboratory environment using machine learning. Borkhade, G., et al. 2024 International Conference on Wireless Communications Signal Processing and Networking (WiSPNET), Chennai, India, , (2024).
- Rakhshaninejad, M., et al. Refining breast cancer biomarker discovery and drug targeting through an advanced data-driven approach. BMC Bioinformatics. 25 (1), 33(2024).
- Nagaraj, B. S., et al. Vitamin D analog calcitriol for breast cancer therapy; an integrated drug discovery approach. J Biomol Struct Dyn. 41 (20), 11017-11043 (2023).
- Jernström, S., et al. Drug-screening and genomic analyses of HER2-positive breast cancer cell lines reveal predictors for treatment response. Breast Cancer Targets Ther. 9, 185-198 (2017).
- Witt, B. L., Tollefsbol, T. O. Molecular, cellular, and technical aspects of breast cancer cell lines as a foundational tool in cancer research. Life. 13 (12), 2311(2023).
- Gruener, R. F., et al. Facilitating drug discovery in breast cancer by virtually screening patients using in vitro drug response modeling. Cancers. 13 (4), 885(2021).
- Song, J., et al. The discovery of new drug-target interactions for breast cancer treatment. Molecules. 26 (24), 7474(2021).
- Costa, R., et al. Targeting EGFR in triple negative breast cancer: new discoveries and insights. Cancer Treat Rev. 53, 111-119 (2017).
- Cardoso, F., et al. Bortezomib (PS-341, Velcade) increases the efficacy of trastuzumab (Herceptin) in HER2-positive breast cancer cells synergistically. Mol Cancer Ther. 5 (12), 3042-3051 (2006).
- Santo, L., et al. Preclinical activity of a selective HDAC6 inhibitor, ACY-1215, in combination with bortezomib in multiple myeloma. Blood. 119 (11), 2579-2589 (2012).
- Martin, M., et al. Activity of docetaxel, carboplatin, and doxorubicin in patient-derived TNBC xenografts. Sci Rep. 11, 7064(2021).
- Iorio, F., et al. A landscape of pharmacogenomic interactions in cancer. Cell. 166 (3), 740-754 (2016).
- Kuenzi, B. M., et al. Predicting drug response and syn enhances antitumor efficacy in TNBC xenografts. Oncotarget. 10, 25184-25198 (2019).
- Kuenzi, B. M., et al. Predicting drug response and synergy using a deep learning model of human cancer cells. Cancer Cell. 38 (5), 672-684.e6 (2020).
- XGBoost: a scalable tree boosting system. Chen, T., et al. Proceedings of the 22nd ACM SIGKDD International Conference on Knowledge Discovery and Data Mining, San Francisco, California, USA, , (2016).
- A unified approach to interpreting model predictions. Lundberg, S. M., Lee, S. -I. 31st Conference on Neural Information Processing Systems (NIPS 2017), Long Beach, CA, USA, , (2017).
- Preuer, K., et al. DeepSynergy: predicting anti-cancer drug synergy with deep learning. Bioinformatics. 34 (9), 1538-1546 (2018).
- Contextualizing explainable machine learning for clinical end use. Tonekaboni, S., et al. Proceedings of the 4th Machine Learning for Healthcare Conference, Ann Arbor, Michigan, , (2019).
- Barretina, J., et al. The Cancer Cell Line Encyclopedia enables predictive modelling of anticancer drug sensitivity. Nature. 483, 603-607 (2012).
- Malyutina, A., et al. Drug combination sensitivity scoring facilitates discovery of synergistic drug combinations in cancer. PLoS Comput Biol. 15 (5), e1006752(2019).
- Menden, M. P., et al. Machine learning prediction of cancer cell sensitivity to drugs. PLoS One. 8 (4), e61318(2013).
Access restricted. Please log in or start a trial to view this content.