Guided implant placement is regularly utilized. The methodology describes the design steps for surgical guides. This work explores various potential reasons for implant placement complications. Muscle action and lack of posterior guide support presented in this work provide insight to the surgical and design team for surgical guides.
Method Article
Technical Design, Surgical Challenges, and Troubleshooting in a Fully Guided Implant Workflow
In This Article
Summary
Abstract
Optimal three-dimensional dental implant placement in the prosthetically driven position is essential to simplify a holistic prosthetic rehabilitation towards occlusion and aesthetics. The virtual design of the dental implant placement positions in relation to the patient's anatomical features can be planned and designed accordingly. The digital workflows from cone beam tomography (CBCT) dataset import, dental implant placement planning, surgical guide design with printing, guide sterilization, and dental implant surgery are described in this article. Firstly, the CBCT datasets were reconstructed with the dental implant planning and surgical guide design software. On the virtual complex tissue models of the maxilla, the positions of four dental implants (FDI numbering tooth position 15, 13, 22, and 25) were planned. Multiple guides are often required for complex dental implant surgeries. In this study, the first guide was designed to position the pilot holes for the 3 guide fixation pins. The teeth (namely FDI tooth position 12 and 23), soft tissue tuberosities, and fixation pins were to stabilize the second implant guide in the maxilla. The design of the second guide focuses on the correct height adjustment based on the surgical drills, and the implant drill guide sleeve heights were positioned to facilitate guided implant placement. The fully guided surgery success (for implants 13, 22, 25), challenges, and the complications experienced (with implant 15 placement and guide fixation pin microscope evaluation) are described. Additionally, considerations for future virtual guide design and material resin dimensional changes were considered due to the complication.
Introduction
The placement of dental implants can be completed by the surgeon through a conventional approach, freehand guided surgery1, and lately various computer-assisted implant surgery (CAIS) tools to improve the accuracy of implant positioning during surgery2. Cone beam tomography (CBCT), digital scanning systems, implant planning software, and computer-aided manufacturing (CAD/CAM) are technologies forming part of digital treatment workflows for implant dentistry3. The conventional approach relies entirely on the surgeon and the planning with the CBCT. The surgery and drill selection are entirely reliant on the skill and experience of the surgeon. Freehand guided surgery entails a computer-assisted treatment planning, together with CBCT and the utilization of customized surgical guides. This approach is established as an accurate method for planning and placing dental implants4. Patients requiring implants often present with a reduced periodontium, and the three-dimensional assessment of the potential bone augmentation and implant sites can be completed in commercial software. However, the use of open source software was successfully utilized to visualize periodontal and alveolar defect morphologies in three-dimensions. This was achieved with the implementation of radiographic image processing and free-form CAD modeling. This presents the restoring clinician and surgeon with an alternative method to guide the clinicians during the treatment planning stage5.
Factors affecting the accuracy of guided implant surgery arise from errors during various phases of the workflow. The critical error that can occur is during image acquisition and processing (CBCT acquisition, CBCT surface registration with Stereolithography or Standard Tessellation Language (STL) files, dental model registration). A study comparing the accuracy of CBCT acquisition and the registration with surface intra-oral scan of STL files indicated manual segmentation is more accurate than automatic segmentation, but still had a significant difference between operators in the accuracy of segmentation6. Errors during surgical procedures e.g., incorrect guide placement due to flap interference, errors relating to physical properties of the material, such as deforming after various sterilization procedures. Support of the surgical guide is an aspect where errors related to the stability and type of support (i.e., bone, mucosa, teeth) can occur. The literature suggests teeth are the preference for guide placement accuracy7. Errors related to the guide manufacturing process8, specifically the layer thicknesses of 170 µm was found to produce more inaccurate surgical guides compared to a print resolution of 17 and 25 µm9.
The multidisciplinary team has various techniques to evaluate the accuracy of the surgical guides and implant placement after surgery. The radiographic matching method, in which the stereolithography (STL) files of the planned implant positions are superimposed over DICOM files of a post-operative CBCT is a commonly reported technique. However, the use of a second CBCT exposure of the patient is controversial, considering the principles of "As low as reasonably achievable" (ALARA). Based on ALARA, a post-operative CBCT evaluation is recommended only for mobile implants, altered sensation, and when implant retrieval is anticipated10. The digital registration method of the scan bodies provides an accurate representation of the implant positions for the restorative prosthetic phase. This digital registration method could be used during implant placement by the surgeon to assess the accuracy of the implant position. STL files of the pre-operative planning and CBCT are superimposed on the STL files of the post-surgical digital scan body positions4. This technique could also assist the surgeon during implant placement as well, as when there is some anomaly occurring during surgery, the implant positions can be considered to achieve the alternate implant position. Another implant placement technique is with the use of CAIS tools. This technique uses dynamic navigation for dental implant placement, and the conclusion from the cited research was that high-precision for implant placement was achieved. The advantage of this novel system is that it does not require a labeled CBCT recording11.
This manuscript aims to demonstrate an implant placement complication associated with pitfalls that may occur during the various stages of guide design and use during implant surgery.This work highlights the various considerations the multi-disciplinary team needs to consider to avoid implant placement complications. Patient factors in and around the proposed implant site, e.g., muscle action and lack of posterior guide support, presented an inaccurate implant placement to the surgical team. The methodology describes the design steps for surgical guides and the essential steps to assist in minimizing complications associated with surgical guide design, manufacture, implant guide placement, and use during implant surgery.
Protocol
This manuscript was conducted in complete accordance with the Declaration of Helsinki. The patient provided and signed written informed consent. The patient granted permission to use everything related to the treatment for this manuscript.
1. Software for guided surgery design
- Open the dental implant planning and surgical guide design software.
2. Data Import and Patient Alignment
- Import the DICOM Data into the dental implant planning and surgical guide design software under the tab for New Case or Import Case.
- Select the patient's DICOM data (CBCT scan) and import the data.
- To use the AI Assistant, click Provide Data to AI Assistant.
- The New Plan window will appear, and then select the jaw where the implants should be placed. Add additional notes in the Comment section if additional notes are needed for the rest of the multidisciplinary team members.
- Icon number 2: This is the "Import model scan" icon. Select the surface scan from the storage location.
- The Import model scan window will appear.
NOTE: There are several icons located at the top part of the screen that are fixed shortcuts.
3. Align surface scan and DICOM data
- Select the Alignment options, including the use of the AI Assistant to align data based on the available teeth. Proceed to align regions on the digital model to the DICOM scan.
NOTE: The dental implant planning and surgical guide design software will typically attempt an automatic alignment. Manual alignment by using the Alignment tool becomes essential for accuracy. Sufficient time and attention are required at this step, as it is extremely important to achieve a high accuracy for the guide design for the intended implant positions. - Start with the Patient coordinate system and identify the corresponding anatomical landmarks in both the DICOM Data and the surface scan data of the model/intra-oral scan. Use the point-to-point alignment or surface-based alignment to refine the alignment match. A minimum of three regions are required for alignment. It is extremely important to confirm that the alignment is accurate in all three planes (axial, sagittal, coronal).
- Further define the alignment and STL registration with the mouse by moving the images on the screen to match the colored outline.
4. Define the Mandibular nerve canal
- In the Nerve Tracing module at icon number 3, trace the mandibular nerve if this was not used to align the surface data in the previous step.
- Additionally, ensure accuracy with the use of the cross-sectional views to accurately follow the nerve's path.
NOTE: To utilize the automatic nerve tracing tool, it is extremely important to always manually verify it.
5. Prosthetic-driven implant planning
- By selecting the green plus sign, a window appears. The software will add the crown on the digital model after the tooth number is clicked.
- By using the arrows next to the proposed crown, change the size (green arrow) and the angulation (blue arrow).
NOTE: It is possible to import the prosthetic aspects designed in other software. The prosthetic design must be in a STL or OBJ format. - In dental implant planning and surgical guide design software, the prosthetic planning uses the surface scan to create a virtual crown / restoration / superstructure in the desired location based on the adjacent and opposing teeth. Use the virtual prosthetic restoration to guide implant placement and position based on the virtual crown. Ensure the implants are positioned for optimal prosthetic support and screw access in the correct position on the prosthetic to ensure function and aesthetics when the screw access is closed. At this point, the virtual crown selection can be done to match the planned restoration.
- Commence the implant planning with the input from the surgeon by clicking the icon on the top number 4. Select the Implant System and Size at the Implant Planning module. Select the desired implant system and size from the library.
- Based on the prosthetically driven position of the crown/superstructure, use the 3D and cross-sectional views to determine the placement of the implants.
- Adjust the implant position, angulation, and depth according to the prosthetic plan, anatomical features, and the specifications of the specific brand/model of implant intended for placement.
NOTE: There are various aspects of implant placement according to the prosthetic plan that needs to be considered, for example: available bone volume around the implant; prosthetic emergence profile; inter-implant distance; implant angulation to avoid important anatomical structures, and access of the various tools to place the implant and prosthetic need to be considered. The restorative clinician, surgeon, and technician will collaborate to achieve the most predictable design.
6. Guide design icon number 7
- Go to the Guide Design module.
- Select the type of guide (e.g., bone-supported, mucosa-supported, tooth-supported).
- Move the digital model until the anterior vestibular side is visible in order to block out any undercuts.
- Choose the tooth numbers that will serve as the tooth support for the surgical guide.
- Move the red dot on each tooth to the middle of the tooth.
- Define the guide's boundaries and extension by viewing the digital model from the side. Use the scroll wheel to enlarge or decrease the guide extension over the occlusal aspects of the teeth.
- Ensure the guide is extended to the lowest part of the sleeve holder.
- Based on the specific material tolerances, the guide will be printed, which will determine the "offset" and "wall thickness".
NOTE: The offset determines the tightness of the surgical guide to the teeth, and the wall thickness is the thickness of the surgical guide walls. - Insert the Inspection windows in the areas of the desired teeth (to view the fit of the guide on the teeth), as well as the sleeves (to accommodate the implant placement handpiece), where the implant is to be placed.
- Add text labels.
- Use the software tools to define the guide's support pins, and any fixation features.
- Based on the implant system and implant diameter used, select the specific Drill sleeves by Define Drill Sleeves.
NOTE: Some dental implant planning and surgical guide design software will automatically place drill sleeves based on the implant positions. Verify the drill sleeve placement and adjust as needed. Based on the guide being designed (especially important in stackable guides), select the appropriate sleeve type (e.g., pilot drill sleeve, final drill sleeve). Other implant systems might have just one sleeve, since the drills have a design that accommodates the sleeve, irrespective of the drill size. Ensure the position of the sleeve inside the guide is positioned correctly based on the drill sequence that will be used.
7. Guide fixation pins
- Identify the positions of the guide fixation pins.
NOTE: Ensure there is sufficient clearance as a safety distance from the guide pin in relation to the body and apex of the implant. The safety clearance should be discussed in the team since there is a possibility of apical and angular deviation during placement.
8. Refine guide design
- Use the editing tools to smooth edges, add text, or make other modifications like adding additional support structures and strengthening to ensure the guide is 3-dimensionally rigid.
- Lastly, verify that the guide does not interfere with soft tissue and other anatomical structures of the patient, and the guide includes cross support that is thick enough to provide rigid stability against axial forces.
9. Export and fabrication
- In order to export guide data, the guide design would need to be in STL file format. Ensure the chosen export settings are compatible with the 3D printer or milling machine that will fabricate the surgical guide. Sterilize the surgical guide before use with the appropriate method as prescribed by the manufacturer of the guide resin.
10. Generate drill protocol
- Generate a drill protocol for the surgical team with the recommended drill sequence and depths for each implant.
NOTE: If the implant planning software does not generate this drill sequence, discuss with the surgeon how the drill sequence should be compiled for each intended implant. Ensure to use the latest version of the dental implant planning and surgical guide design software for optimal performance and implant libraries.
11. Fabrication of the surgical guide
- Print the surgical guide with a Dental 3D-printer. The main 3D-printer specification is an XY resolution of 52 µm, layer thickness capability: 0.01-0.30 mm, and a maximum printing speed: 80 mm/h.
NOTE: Surgical Guide Resin can be transparent, but should be a CE-certified Class Ia biocompatible and autoclavable resin with standard sterilization protocols.
Results
Guided implant placement procedure
An otherwise healthy, 67-year-old male was referred to the Department of Oral Medicine and Periodontics (University of the Western Cape, UWC, South Africa) for placement of implants for a planned maxillary implant-supported prosthesis. Clinical examination, CBCT analysis, and dental implant planning and surgical guide design software were performed for the manufacture of a fixed four-implant supported prosthesis. Planned implant sites were 15, 13, 22, and 25 (FDI tooth numbering of tooth position). The remaining teeth presented with significant clinical attachment loss and a grade II mobility after completion of periodontal treatment and recall. All treatment options, including full dentures, were discussed, and a shared decision and consent were reached for the implants with a superstructure. Multiple guides are often required to achieve the complex dental implant surgery. Two surgical guides were planned on the virtual complex tissue models of the maxilla, with the positions of four dental implants (FDI numbering tooth position 15, 13, 22, and 25). Two digitally designed surgical guides were manufactured; one for the placement of the three guide fixation pins supported on FDI tooth position 12, 21, and 23 (Figure 1) and a second guide for implant placement supported by two teeth (12 and 22), the tuberosities and three guide fixation pins (Figure 2). The first guide was utilized to prepare the guide fixation pin osteotomies. A systematic review on the accuracy of implant placement using digital prosthetically-driven surgical guides recommended that three guide fixation pins are recommended for mucosa-supported cases12. The second guide was placed and secured with three guide fixation pins, after the removal of tooth 23 and raising a full-thickness mucoperiosteal flap.
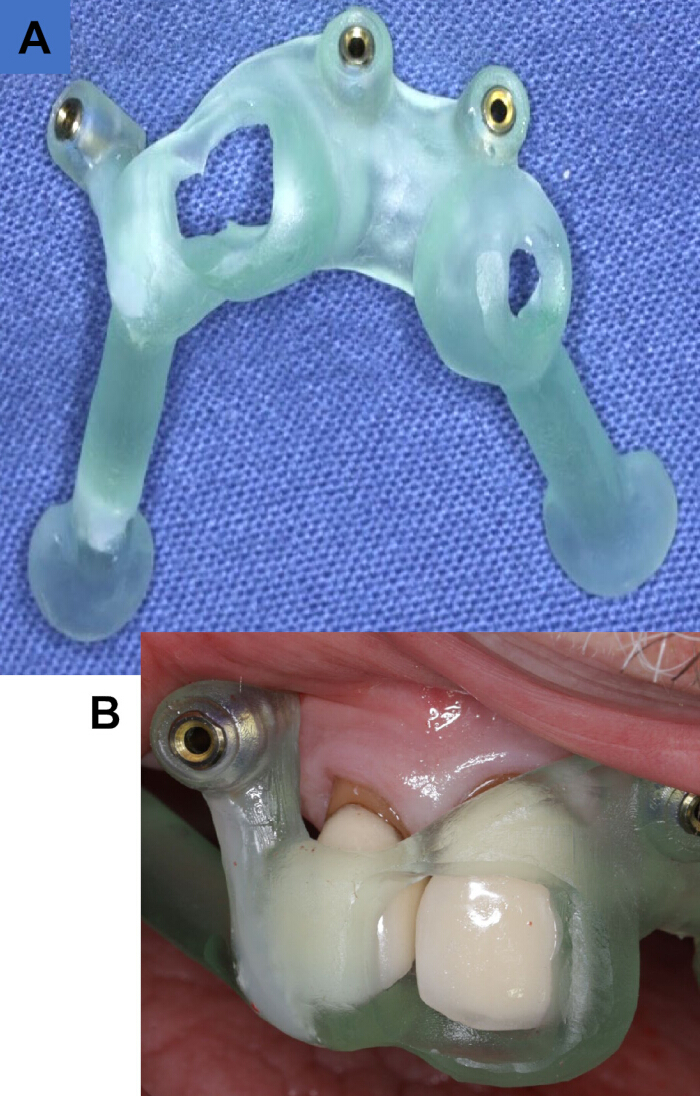
Figure 1: Guide to facilitate the fixation pin placement (Guide no.1). (A) Designed guide for three guide fixation pins placement from the occlusal aspect. (B) Guide for fixation pin placement positions placed on supported on teeth. Please click here to view a larger version of this figure.
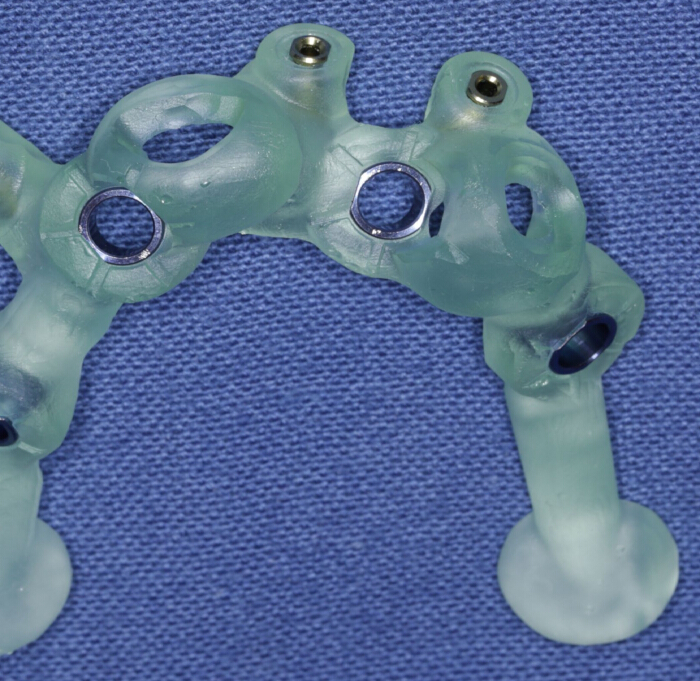
Figure 2: Implant placement guide supported on teeth and soft tissue (Guide no.2). Please click here to view a larger version of this figure.
Dental implants were placed with primary stability above 35 Ncm in the FDI tooth position 13, 22 and 25 implant sites (Figure 3).
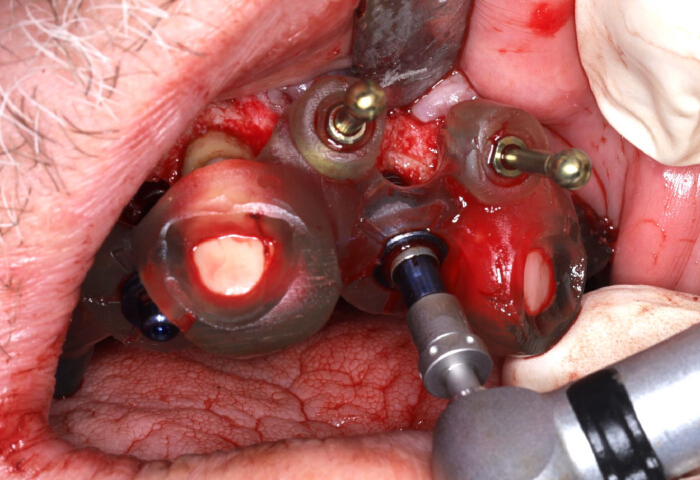
Figure 3: Implant placement represented in FDI tooth position 23 with guide no. 2. Please click here to view a larger version of this figure.
A complication presented upon placement of the implant at FDI tooth position 15. The torque value of 35 Ncm was not achieved. The surgeon decided to remove the FDI tooth position 15 implant and it was visually observed that the implant surface and thread was damaged (Figure 4).
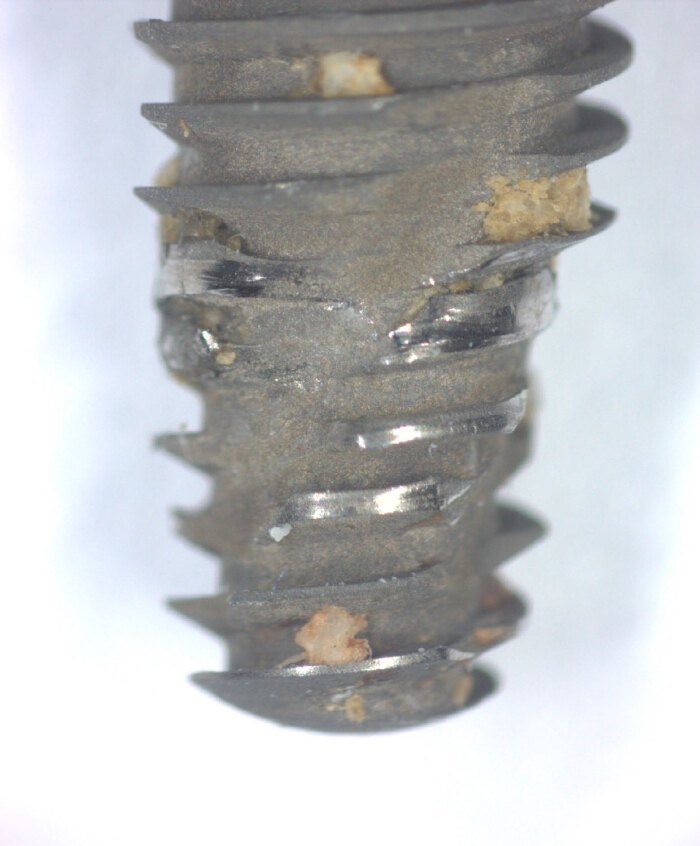
Figure 4: Implant damaged by third fixation pin in FDI tooth number position 15. Please click here to view a larger version of this figure.
The second implant surgical guide was removed, and it was clinically observed that the FDI tooth position 15 osteotomy site was more palatally positioned than planned placement according to the dental implant planning and surgical guide design software (Figure 5).
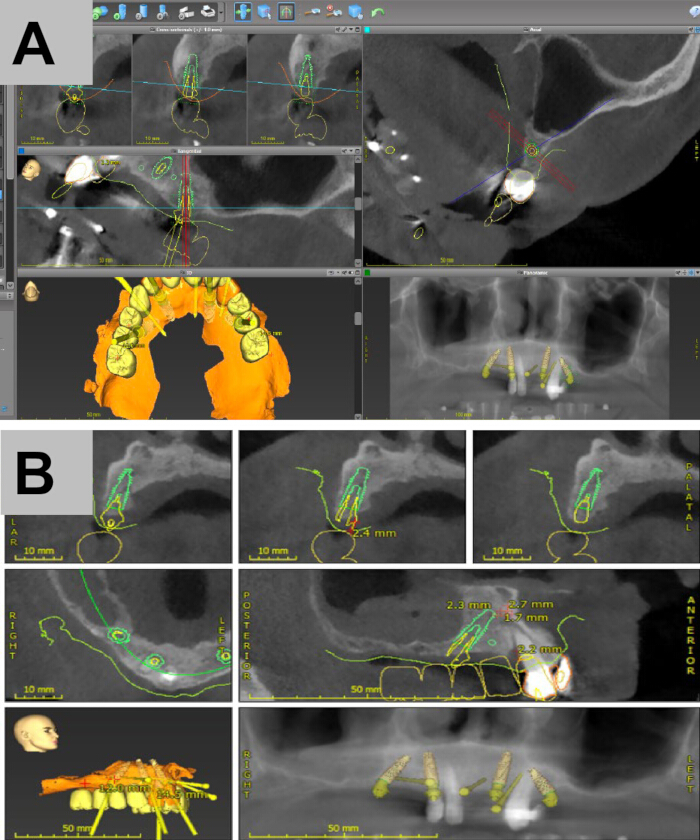
Figure 5: Planned implant and fixation pin placement. (A) Prosthetic guided tooth position, implants and fixation pins positions. (B) Intended implant of FDI tooth position 15. Please click here to view a larger version of this figure.
The FDI tooth position 15 implant position was then conventionally placed utilizing an analogue pilot-guided surgical guide (which is always additionally constructed with the virtual guides at the University) to a torque value of 35 Ncm. The four implants were immediately loaded with a provisional prosthesis after the remaining teeth were extracted (Figure 6). Initial sutures were performed to reposition the soft tissue after the full-thickness flap around the multi-unit abutments. Then the two teeth were removed, and management of the sockets and their soft tissue closure was perceived as easier to achieve primary closure.
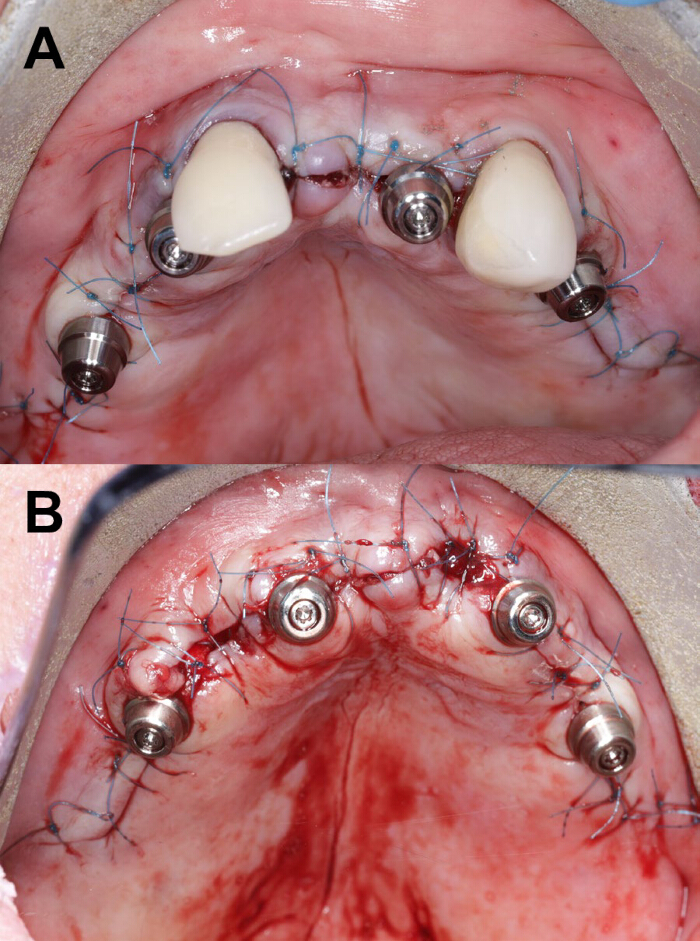
Figure 6: Completed implant placement. (A) Three implants placed with guide and one implant conventional freehand method.(B) Remaining teeth that supported the implant placement guide removed. Please click here to view a larger version of this figure.
The post-surgery assessment of the workflow was conducted by the multidisciplinary team to determine possible causes for the complications experienced of implant placement at FDI tooth position 15.
Surgical guide assessment
On the original date of the planned surgery, the surgical guides were ready for surgery less than seven days after construction. The patient was in a motor vehicle accident the morning of the planned surgery. The surgery was postponed and proceeded 4 weeks after the surgical guide production. The placement of four preceding implants went according to the digital plan, the last implant FDI tooth position 15 did not. The first hypothesis of the implant 15 complication was that the surgical guide could have undergone dimensional changes due to the delay in surgery of after autoclave sterilization at 121°C. It was considered that the dimensional changes occurred to the extent where the placement of FDI tooth position 15 was changed 3-dimensionally to the extent where this implant and the guide fixation pin intersected (Figure 7), damaging the dental implant (Figure 4). When the surgical guide was assessed under the microscope in the static position, the dental implant and the guide fixation pin did not touch one another with a generous safety zone. The team then hypothesized that external pressure from musculature could be the cause. The design of the guide did not include a cross bar. Once physical external compressive pressure was applied on the posterior parts (also where the tuberosity soft tissue support) was, at the labels no 2, 3, 4 (Figure 8) did the implant and the guide fixation pin intersected, causing damage to the implant surface and the guide fixation pin.
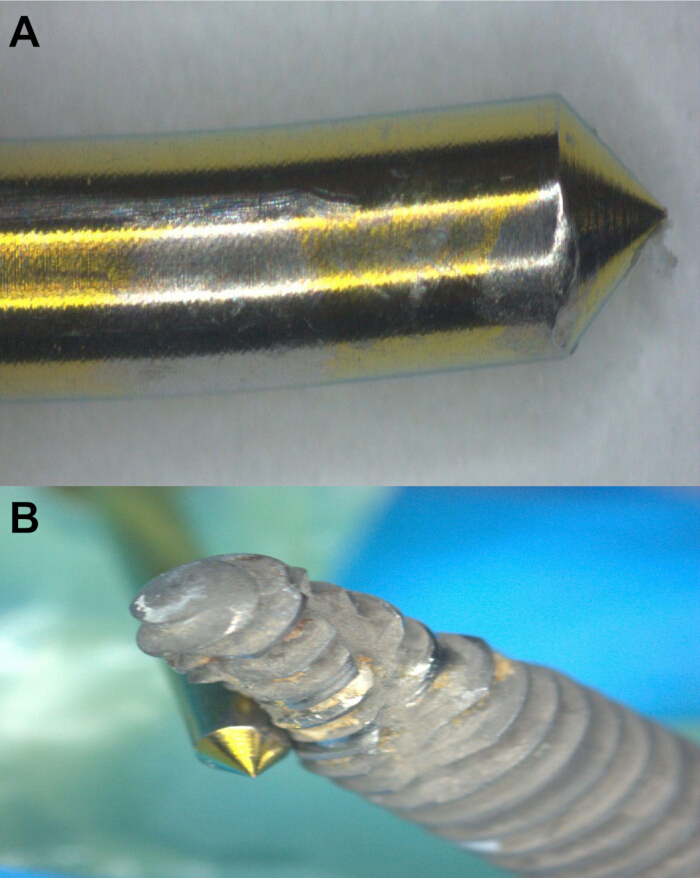
Figure 7: Post surgery evaluation of damaged components. (A) Fixation guide pin with damaged anodized surface. (B) Damaged implant Tooth position 15 and fixation pin intersection once pressure is applied to the surgical guide. Please click here to view a larger version of this figure.
To confirm that only external pressure on the surgical guide was the origin of the complication experienced during surgery with an implant in the FDI tooth position 15, the surgical guide was scanned to obtain an STL. The literature on a similar appearing surgical guide stored in a dark room temperature location reported at 4 weeks no significant difference between the resins assessed for the guide stability, accuracy and sleave location13.The original designed surgical guide CAD file (blue color) and the scanned surgical guide after surgery as an STL file (brown color) were overlaid with one another to view the "best fit" based on various landmarks like the sleeves that are the key components of digitally planned implant position. The color difference of where the deviation pattern is visible indicated a very limited deviation for the guide, with most of the color difference visible at the posterior section of the surgical guide. This posterior round areas on the guide were for soft tissue support on the tuberosities. Various landmarks were assessed with linear measurements to determine the dimensional trueness of the surgical guide between the manufacture from the CAD file and the resultant surgical guide STL after the surgery (Figure 8). The linear measurement results were analyzed statistically to assess for significance at a level of p > 0.05.
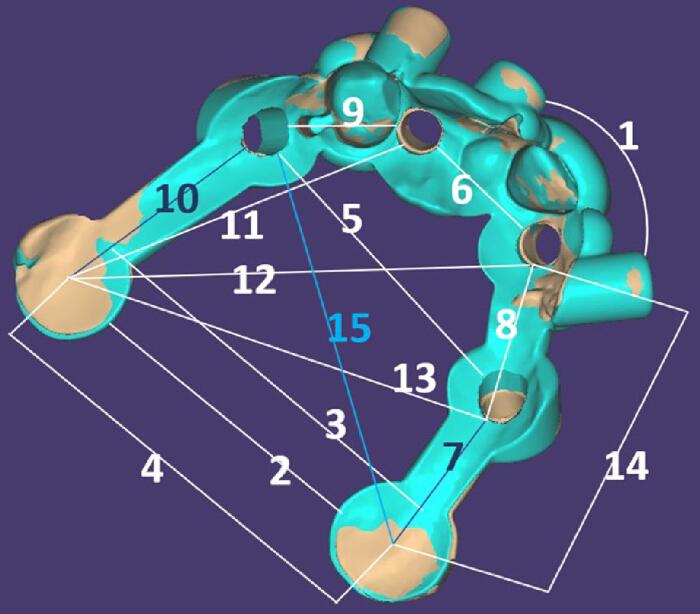
Figure 8: Color difference illustrates little difference between the original guide (blue) and the scanned guide after surgery (brown). Please click here to view a larger version of this figure.
| Measurement label | Original surgical guide designed (CAD file) (Blue) (mm) | Scanned surgical guide after surgery (STL) (Brown) (mm) | Difference (mm) | Statistical analysis |
| 1 | 19.108 | 19.124 | -0.016 | |
| 2 | 32.285 | 32.859 | -0.574 | |
| 3 | 43.357 | 44.14 | -0.783 | |
| 4 | 32.47 | 31.858 | 0.612 | |
| 5 | 38.469 | 37.777 | 0.692 | |
| 6 | 19.245 | 19.321 | -0.076 | |
| 7 | 14.948 | 14.482 | 0.466 | |
| 8 | 21.009 | 20.958 | 0.051 | p = 0.359131 |
| 9 | 20.999 | 20.889 | 0.11 | |
| 10 | 21.318 | 21.081 | 0.237 | |
| 11 | 39.718 | 39.857 | -0.139 | |
| 12 | 50.424 | 50.611 | -0.187 | |
| 13 | 47.01 | 46.82 | 0.19 | |
| 14 | 35.185 | 35.127 | 0.058 | |
| 15 | 47.349 | 46.469 | 0.88 |
Table 1: Comparative results of the original surgical guide design versus the surface scan of the used surgical guide.
The cumulative average of dimensional changes across the various landmarks in Figure 8 is 0.1014mm. The statistical analysis with the Wilcoxon Signed Rank Test was completed for paired data and there is no significance between the measurements of the landmarks on the digital original CAD surgical guide file versus the scanned surgical guide after surgery (p-value: 0.359131). The radiograph shows the implants, and the clinical photo represents the satisfied patient, the final prosthetic, and functional outcome (Figure 9)
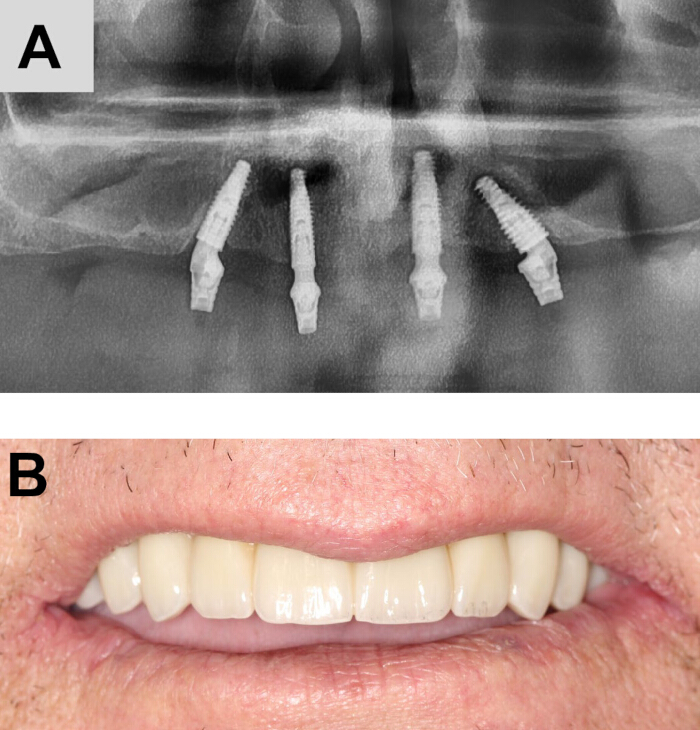
Figure 9: Final implant placement position. (A) Radiographic appearance of the implants.(B) Clinical appearance of the prosthesis. Please click here to view a larger version of this figure.
Discussion
Numerous studies have evaluated factors impacting the accuracy of computer-digital guided implant placement4. The performance of the Surgical guide design software is dependent upon the experience of the user to effectively apply the parameters of the prosthetic driven protocol and merge the surgical protocol. A limitation is the need for the multi-disciplinary approach to ensure all the parameters are accurately performed. Due to the fixation pins receiving a generous safety zone, the surgical team assumed there must have been a change in the guide's shape resulting in a variance between the actual surgical result and the initial digital implant position for FDI tooth number 15. The surgical case presented in this manuscript had tooth, bone, and soft tissue support for the surgical guide and three guide fixation pins in the bone. There is an inherent deviation of implant placement position with surgical guides based on a systematic review. The systematic review evaluated the deviations associated with surgical guide design measured by two techniques, namely the radiographic matching method and the digital registration method. The mean implant position deviations were recorded from the reviewed literature, and deviations were recorded for angular (2.49◦ to 5.08◦), coronal (0.71 mm to 1.60 mm), and apical deviations (0.77 mm to 1.65 mm). In this clinical scenario for FDI tooth number 15, these deviations were postulated to be sufficient to have an impact with the added musculature pressure on the guide. The systematic review concluded that, without external influence, the deviations are "not far from accurate"4and this is why the safety zone between implant and fixation pins is highlighted in the design protocol. The recorded apical deviation of free hand implant placements was recorded to range between 0.99 and 5.811 mm, which is significantly greater than guided surgery, where there is no undue impact from musculature on the guide1. The negative parts of the guide design led to the musculature interference, which was the large size of these tuberosity soft tissue support areas and the absence of a cross-support bar between quadrants. These negative design elements would then result in pressure from the oral musculature upon mouth opening to influence the implant placement position due to posterior guide repositioning.
The guide's dimensional stability due to autoclave sterilization was not initially in question as the primary reason, as the product used is indicated for autoclave sterilization, and the printer is a light-curing resin printer. The assessment represented in Table 1 was the first evaluation completed after the surgery to rule out the possibility of dimensional change of the guide due to the cumulative 4 week period since guide production. The literature suggest that types of resin and quality of printing are important aspects to consider for the sterilization of surgical guides. A study by Kebler, et al. (2022) demonstrated that these specific manufacturing techniques, the 3D printing device, the resin material, and the application of preoperative sterilization can all affect the accuracy of the postoperative implant position. In their study no significant difference was found between most of the surgical guides that were manufactured by 3D printing or milling. The aforementioned study showed that in their sample of surgical guide material, the implant position was not affected compared to the comparison with non-sterilized guides. However, another resin material in the study used in the SLA-printing device resulted in variation of the implant horizontal position at the crest and the vertical position. None of the final implant tip positions were displaced apically14. Even other forms of sterilization with hydrogen peroxide, glutaraldehyde, autoclave, plasma and iodoform all showed guide distortion to some extent with the guide resin assessed15.
Based on the statistical analysis presented in Table 1, it is important to consider the specific resin and printer used for the surgical guide manufacture, since there could be differences in the dimensional stability based on the chosen parameters. The results from another study, as an example of guide dimension deviation over time of 0.026 mm after 20 days, were found to be a significant change16. Therefore, the guide deviation over time due to the specific resin and printer used should not be generalized, but interpretations based on both the resin and printer parameters as paired data.
Based on the results obtained in terms of the resins' dimensional stability in Table 1 and the fact that implant placement of FDI tooth position 15 deviated to the degree of being displaced palatally of the intended osteotomy location, the surgical guide design was evaluated by the multidisciplinary team. Table 1 illustrates that in a static position, the surgical guide presented the desired and planned implant placement position (Figure 5). Soft tissue pressure from the muscles of mastication and cheek on the posterior part of the guide during surgery, illustrated in Figure 8 at labels 2, 3, 4, resulted in the deviation of the 15th implant tooth position (Figure 7). The guide design as a factor was considered through the comparison with an in vivo study17, which was reviewed to assess the value of a supporting cross-bar and implants in various osteotomy sites for surgical guides. The study evaluated two groups of surgical guide designs to assess whether greater stability of the surgical guide is possible. The test groups compared the results of the one surgical guide group (with 4-tooth support and no cross-bar) versus the other group (with 8-tooth support and an additional cross-bar). The study also concluded that surgical guide length, when combined with multiple edentulous spaces requiring implants, had an impact on the implant placement accuracy of implants placed in certain positions. Because longer surgical guides with multiple edentulous spaces requiring implants might bend more easily, it could reduce the accuracy of the implants in the FDI tooth positions of 12, 22. The study recommendation was for full arch surgical guide cases: i) the guide should (be supported by 8-tooth with a cross-bar) as it presented superior outcomes to a guide without a cross-bar and only 4-tooth support17. ii) Further results illustrated that tooth location in relation to implant placement position plays a large role in the implant placement accuracy. Shi et al. (2023) also found that bilateral tooth-supported surgical guides presented the highest accuracy7. The FDI tooth positions studied by Wu et al. (2022) of 15 and 25 presented no statistically significant difference in the "offset of implant base" nor "angle deviation of the implant" between the 4-tooth supported guide and the 8-tooth supported guide with a cross-bar17. Based on these results and the complications with implant placement of FDI tooth position 15, it can be concluded that the actual position of the four teeth that provide the surgical guide support is a very important aspect that should be considered. Based on the fulcrum, through a surgical guide, the location of the tooth support in the Wu et al. (2022) study provided cross support to resist movement of the guide through the fulcrum points17. With the case presented in the manuscript, the tooth-support was anterior and an additional cross-bar support for the surgical case could have provided more stability to the surgical guide to prevent the compressive action on the guide based on the muscles and the results in Figure 4, Figure 7, and Figure 8, since there were only 3-tooth anterior sextant support17. Figure 8 and Table 1 presented no significant difference in the CAD file and the scanned STL. There was no other literature available at the time of this manuscript for the resin and printer used for the guided surgery. Based on the results from a resin material, printing, sterilization and the time between printing and surgery as reasons for implant FDI tooth position 15 variation, these potential reasons were all rejected as possible contributors and the action of the soft tissue on the soft tissue tuberosity support and lack of a cross bar for rigidity accepted as the origin for complications of FDI tooth position 15.
The design of the guide towards adequate rigidity is essential, and looking towards the future of implant placement and the result obtained from a dynamic navigation dental implant placement, a retrospective view of the complications associated with FDI tooth position 15 the use of the dynamic navigation dental implant placement method and the recommended shorter surgical instruments for more posterior regions11 where patient factors influence guides as experienced in this FDI tooth position 15, a more controlled outcome might have been achieved. The patient was happy with the final outcome of the prosthetic appearance, as the implant placement was present in the prosthetically driven position (Figure 9).
Surgical guide design should include as many teeth for support as possible, with windows to ensure the appropriate guide seating. The printing and resin material used should be as stable as possible dimensionally, even after autoclave sterilization. The use of a single or multiple cross-bars becomes essential, and thicker guide wall designs of the guide, where the muscles of mastication could place undue compressive pressure in edentulous saddles with no distal tooth support, could increase the rigidity of the surgical guide.
Disclosures
The authors declare no conflicts of interest.
Acknowledgements
S Mulder van Staden: Planning of the surgical case, performing the surgery as the consultant, writing and editing the whole article, and editing and compiling the video methodology. C De Villiers: Planning of the surgical case, working with the laboratory for the guide design, performing the surgery as the registrar. R Mulder: Microscope evaluation of implant and guide fixation pin, overlay analysis and measurements of CAD vs STL, performing the statistical analysis and interpretation, writing and editing the results, editing the discussion, and type setting of the manuscript. T Bath: Planning of the surgical case from the laboratory side, Master Technician for the laboratory guide design and manufacture. H Coetzee: Scan of the used surgical guide, overlay with STL, actual measurements of CAD and STL from the landmarks.
Materials
| Name | Company | Catalog Number | Comments |
|---|---|---|---|
| 3Shape Dental Design System | 3Shape | https://www.3shape.com/en/software/dental-system | |
| coDiagnostiX software | Straumann | Dental Wings, https://codiagnostix.com/ | |
| Neodent GM Helix | Straumann | 109, https://shop.straumann.com/neodent/za/en_za/Implant-Lines/Grand-Morse/GM-Implants/GM-Helix-Acqua-Implant/p/base_neo_gmhelixacquaimplant/ | |
| One-Way Anova with post hoc Tukey HSD, version 2016 | Navendu Vasavada | https://astatsa.com/OneWay_Anova_with_TukeyHSD/ | |
| Sonic Mighty 4K | Phrozen Tech Co. Ltd. | https://phrozen3d.com/products/sonic-mighty-4k | |
| Surgical Guide Resin | Power Resins | https://powerresins.com/products/sg-resin |
References
- Dutta, D., et al. Comparison of accuracy of dental implant placement between freehand and guided implant surgery: a systematic review and meta-analysis. J Maxillofac Oral Surg. 24 (4), 865-876 (2025).
- Mahardawi, B., et al. The accuracy of dental implant placement with different methods of computer-assisted implant surgery: a network meta-analysis of clinical studies. Clin Oral Implants Res. 36 (1), 1-16 (2024).
- Chen, L., et al. Accuracy, reproducibility, and dimensional stability of additively manufactured surgical templates. J Prosthet Dent. 122 (3), 309-314 (2019).
- Khaohoen, A., et al. Accuracy of different systems of guided implant surgery and methods for quantification: a systematic review. Appl Sci (Basel). 14 (24), 11479-11494 (2024).
- Palkovics, D., Solyom, E., Molnar, B., Pinter, C., Windisch, P. Digital hybrid model preparation for virtual planning of reconstructive dentoalveolar surgical procedures. J Vis Exp. (174), e62743(2021).
- Flügge, T., et al. Registration of cone beam computed tomography data and intraoral surface scans: a prerequisite for guided implant surgery with CAD/CAM drilling guides. Clin Oral Implants Res. 28 (9), 1113-1118 (2017).
- Shi, Y., et al. A systematic review of the accuracy of digital surgical guides for dental implantation. Int J Implant Dent. 9 (1), 1-23 (2023).
- Marei, H. F., Abdel-Hady, A., Al-Khalifa, K., Al-Mahalawy, H. Influence of surgeon experience on the accuracy of implant placement via a partially computer-guided surgical protocol. Int J Oral Maxillofac Implants. 34 (5), 1177-1183 (2019).
- Juneja, M., et al. Accuracy in dental surgical guide fabrication using different 3D printing techniques. Addit Manuf. 22, 243-255 (2018).
- Tyndall, D. A., et al. American Academy of Oral and Maxillofacial Radiology position statement of the American Academy of Oral and Maxillofacial Radiology on selection criteria for the use of radiology in dental implantology with emphasis on cone beam computed tomography. Oral Surg Oral Med Oral Pathol Oral Radiol. 113 (6), 817-826 (2012).
- Pinter, G. T., Decker, R., Szenasi, G., Barabas, P., Huszar, T. Dynamic navigation for dental implant placement. J Vis Exp. (187), e63400(2022).
- Abad-Coronel, C., et al. Accuracy of implant placement using digital prosthetically derived surgical guides: a systematic review. Appl Sci (Basel). 14, 7422(2024).
- Ntovas, P., et al. Effect of storage conditions and time on the dimensional stability of 3D printed surgical guides: an in vitro study. Clin Oral Implants Res. 36 (1), 92-99 (2025).
- Keßler, A., Dosch, M., Reymus, M., Folwaczny, M. Influence of 3D-printing method, resin material, and sterilization on the accuracy of virtually designed surgical implant guides. J Prosthet Dent. 128 (2), 196-204 (2022).
- Li, R., Zhu, J., Wang, S., Li, X., Li, S. Effects of sterilization and disinfection methods on digitally designed surgical implant guide accuracy: an in vitro study. Clin Implant Dent Relat Res. 26 (5), 889-898 (2024).
- Lo Russo, L., et al. Three-dimensional printed surgical guides: effect of time on dimensional stability. J Prosthodont. 32 (5), 431-438 (2023).
- Wu, Y. T., et al. Accuracy of different surgical guide designs for static computer-assisted implant surgery: an in vitro study. J Oral Implantol. 48 (5), 351-357 (2022).