This protocol introduces X-ray-guided anatomy-based fitting (ABF) for cochlear implants to reduce frequency-to-place mismatch and potentially to improve patient outcomes.
Method Article
Cochlear Implantation: First Experience with X-Ray Guided Anatomy-Based Fitting
Asma Alahmadi1,2 , Yassin Abdelsamad3 , Ahmed Hafez3 , Medhat Yousef1 , Fida Almuhawas1,4 , Abdulrahman Hagr1
1King Abdullah Ear Specialist Center (KAESC), King Saud University Medical City, King Saud University, 2Department of Otolaryngology-Head and Neck Surgery, Western University, 3Research Department, MED-EL GmbH, 4Department of Otolaryngology-Head and Neck Surgery, College of Medicine, King Saud University
Opens in a new tab
In This Article
Summary
Loading...
$$\rightleftharpoonup{xx}$$
$$\longleftharp{xx}$$,
$$\longrightharp{xx}$$,
Abstract
Loading...
$$\rightleftharpoonup{xx}$$
$$\longleftharp{xx}$$,
$$\longrightharp{xx}$$,
This study presents a protocol for applying X-ray-guided anatomy-based fitting (ABF) in cochlear implant (CI) programming to reduce frequency-to-place mismatch. The goal is to improve alignment between the frequencies stimulated by each electrode and the natural tonotopic organization of the cochlea, thereby enhancing speech perception and auditory outcomes. Traditional default fitting (DF) methods don't account for individual variations in cochlear anatomy, leading to mismatches that can influence performance. In this prospective study, 16 ears from 12 CI users with normal cochlear anatomy were assessed using X-ray imaging to estimate angular insertion depth (AID) and guide the ABF protocol. Frequency assignments for each electrode were adjusted using OTOPLAN and MAESTRO software to match the cochlea's tonotopic map. Results showed that ABF significantly reduced the average frequency-to-place mismatch (2.6 ± 3.8 semitones) compared to DF (6.6 ± 5.6 semitones). ABF also showed a stronger correlation between AID and frequency shifts, with the most notable improvements in the mid-cochlear region. This protocol applies a low-radiation, accessible alternative to CT-guided ABF, particularly beneficial for pediatric or radiation-sensitive populations. X-ray-guided ABF demonstrates potential for more accurate CI programming and the potential to improve patient outcomes. Further studies with larger cohorts and longer follow-up periods are recommended to validate its clinical benefits.
Introduction
Loading...
$$\rightleftharpoonup{xx}$$
$$\longleftharp{xx}$$,
$$\longrightharp{xx}$$,
Cochlear implants (CIs) have become the standard of care in auditory rehabilitation, allowing individuals with severe to profound hearing impairment to significantly enhance their speech understanding, communication abilities, and overall quality of life1. However, various factors can influence the experiences of CI recipients, including sound processing delays, fitting methods, and volume disparities2.
Traditional default fitting (DF) center frequencies emphasize post-operative behavioral measures but often neglect the variability in cochlear anatomy and electrode contact positions among users. Additionally, these factors can be influenced by race, sex, or ethnicity3,4. Despite recent advancements in fitting strategies that have improved CI programming, DF mapping still needs revision due to challenges in considering the organ of Corti (OC) and cochlear duct length (CDL)5.
A major consequence in default frequency mapping is the "frequency-to-place mismatch," which occurs when the frequency delivered by a CI electrode differs from the tonotopic frequency of the cochlear region it stimulates6. This mismatch can arise from anatomical variability, surgical technique, and electrode array design, all of which influence its magnitude7. It may be further exacerbated by standard frequency-allocation schemes used in many CI systems, which often overlook individual cochlear anatomy and electrode placement. Recent studies suggest a significant correlation between frequency-to-place mismatch and poor monosyllable scores, poor speech perception, and reduced speech discrimination6,8.
To address the challenges of DF mapping, a personalized method for CI programming known as anatomy-based fitting (ABF) has been introduced9. ABF aims to align the CI's frequency map more accurately with an individual's natural cochlear anatomy by utilizing post-operative CT data. This integration allows for the assignment of patient-specific filter frequencies based on the anatomical location of each electrode contact10. The primary goal is to minimize tonotopic discrepancies and enhance alignment between stimulated frequencies and natural tonotopicity11. Notably, ABF has shown significant improvements in speech perception compared to DF9, improved speech recognition, and greater user acceptance12,13.
Despite the positive outcomes of ABF, its application is limited due to the need for post-operative CT scans, resulting in increased radiation exposure, which is concerning for children and sensitive groups14.
Multiple studies have demonstrated that advancements in imaging technology can substantially reduce radiation exposure while maintaining diagnostic quality. For example, in animal models, low-dose conventional CT scans have shown a 50% reduction in radiation dose with no loss of diagnostic efficacy15. Cone-beam CT delivers only 6%-16% of the radiation dose of standard multi-slice CT systems while providing comparable image quality, underscoring progress in dose-reduction strategies16. Collectively, these findings support the adoption of optimized imaging protocols to minimize radiation risk after cochlear implantation. A recent study proposed X-ray-guided ABF as a feasible alternative to address CT-associated radiation exposure17. Therefore, this study aims to investigate the first applicability of X-ray-guided ABF in CI recipients.
Protocol
Loading...
$$\rightleftharpoonup{xx}$$
$$\longleftharp{xx}$$,
$$\longrightharp{xx}$$,
This study was conducted in accordance with the ethical standards of the affiliated institution and received approval from the Institutional Review Board (Ref. No. 23/0605/IRB). Written informed consent was obtained from all participants prior to enrollment. Participant confidentiality and data security were ensured throughout the study. The software used is listed in the Table of Materials.
1. Participant recruitment
- Identify CI recipients with adequate post-operative X-ray images and complete audiological records. Ensure that all included CI recipients also underwent a pre-operative CT scan to calculate the CDL and assess cochlear anatomy prior to implantation.
- Confirm that participants have normal cochlear anatomy, defined as the absence of malformations and patent cochlear turns, as verified by pre-operative imaging and surgical notes.
- Review clinical files to confirm eligibility for the ABF. Post-operative imaging relies only on X-ray for electrode verification; additional post-operative CT scans are not required.
- Obtain consent.
- Clearly explain the study's aims and the X-ray guided ABF process to each participant or guardian.
- Secure written informed consent before beginning data collection.
2. Post-operative X-ray acquisition and image preparation
- Acquire X-ray images.
- Schedule a standardized transorbital (Modified Stenver's view) X-ray for each CI recipient at the radiology department.
- Position the head to ensure the full electrode array is visible.
- Prepare images.
- Save X-ray images in DICOM format.
- Upload images into the planning software (OTOPLAN in cooperation with MED-EL).
NOTE: According to MED-EL, the minimum insertion depth required to enable ABF occurs when the most apical electrode (E1) corresponds to a frequency near 340 Hz, which translates to an insertion angle of approximately 540°, or 1.5 cochlear turns. In smaller cochleae, the FLEX28 electrode array can support ABF by providing sufficient cochlear coverage to allow for precise frequency mapping. Meanwhile, the FLEXSOFT and STANDARD electrode arrays are generally regarded as optimal candidates for ABF, as they typically achieve near-complete cochlear coverage up to around 720°, with E1 frequencies ranging from roughly 100 to 185 Hz18.
3. Anatomical marking and electrode identification
- Mark anatomical landmarks.
- In the planning software, use the pointer tools to select the round window and cochlear center as anatomical reference points.
- Confirm that these landmarks are accurately placed before moving to electrode identification.
- Identify electrode contacts.
- Manually label each visible electrode contact in sequence (e.g., C.01-C.12) using the software's electrode mapping feature.
- Cross-check the order and positions with the manufacturer's documentation or surgical notes.
4. Cochlear parameter calculation and frequency allocation
- Generate anatomical parameters.
- Calculate CDL for each participant using pre-operative CT scans. Determine AID for each electrode contact using post-operative X-ray images and planning software by identifying key anatomical landmarks (modiolus, round window, and electrode contacts).
- Activate the Greenwood function in the software to derive the TF for each electrode contact.
- Export ABF dataset.
- Use the anatomical parameters calculated in step 4.1 (CDL and AID for each electrode contact), along with manually identified anatomical landmarks, the modiolus, round window, and electrode contact positions as input data for the OTOPLAN software. Apply the Greenwood function in OTOPLAN to estimate the cochlear place frequency for each electrode contact and generate individualized ABF maps for each patient.
- Export the resulting ABF frequency values as a compatible data file (e.g., CSV or Excel) for import into the CI programming software (MAESTRO).
- Import into programming software.
- Launch the CI programming software.
- Navigate to the frequency mapping or allocation section.
- Apply ABF mapping
- Upload the ABF frequency file to the patient's map, ensuring all channels match the calculated tonotopic targets.
- Save this setting as a new program.
NOTE: A pause may be taken here with resumption of reprogramming and device activation at the next clinic visit if needed.
5. Frequency-to-place mismatch calculation
- Compute the mismatch.
- Record the DF, ABF, and TF frequencies for each electrode contact.
- Calculate the semitone mismatch for both DF and ABF using the formula:
n = 12 × log2 (Programmed Frequency / TF)
- Prepare the dataset.
- Enter mismatch values, as well as demographic and anatomical data, into a spreadsheet for subsequent analysis.
6. Statistical analysis
- Assess data normality.
- Employ the Shapiro-Wilk test to evaluate the distribution of each dataset variable.
- Compare between DF and ABF.
- Use paired t-test for normal data, or Wilcoxon signed-rank test for non-normal data, to compare DF and ABF mismatch.
- Analyze insertion depth correlation.
- Calculate Pearson or Spearman correlation between AID and semitone mismatch.
- Visualize findings with scatter plots.
7. Safety and confidentiality
- Minimize radiation exposure.
- Use the lowest reasonable X-ray dose and provide thyroid and body shielding during imaging, especially for children.
- Protect data.
- Store all data securely on institution-approved servers.
- De-identify all patient information before analysis or sharing.
8. Troubleshooting
- Software import failure
- Confirm that exported files are compatible with the programming software's required format.
- Incomplete electrode visibility
- Adjust X-ray settings or acquire an additional view if needed for clarity.
Results
Loading...
$$\rightleftharpoonup{xx}$$
$$\longleftharp{xx}$$,
$$\longrightharp{xx}$$,
Participants were 4 bilateral CI users and 8 unilateral CI users, leading to a total of 16 ears. The mean age at implantation was 17.0 ± 16.7 years. See Table 1 for participant demographics. Figure 1A compares the center frequencies of ABF, DF, and TF across electrode contacts (C.01 to C.12). ABF frequencies closely match TF frequencies, except in the basal region, where there is a clear distinction between TF and DF. The ABF and TF show the closest alignment in the center frequency range.
Further analysis of the tonotopically based AID (Figure 1B) showed a constant decrease from the base of the cochlea toward the apex. This pattern is consistent with the anatomy of the cochlear spiral, where the basal region responds to higher frequencies, and the apical region to lower frequencies.
For the mean calculated central frequencies of each electrode contact, see Table 2. The average absolute frequency-to-place mismatch between the DF and the TF ranged from 2.7 to 15.9 semitones, with an average value of 6.6 ± 5.6. The ABF then decreased this semitonal difference: the average mismatch between ABF and TF was 2.6 ± 3.8 and ranged between 0.2 and 11.6 semitones. The statistical comparison between the mismatch between TF, ABF, and DF showed a significant difference (Figure 2A).
As Figure 2B shows, the graphical visualization of the semitonal difference revealed a more considerable mismatch between the DF and the TF compared to the mismatch between ABF and TF, considering that the TF is the reference. Both groups' differences were more significant in the apical electrode contacts and minor in the basal electrodes. The most significant mismatch was found in contacts C03 and C04. The reasons behind these mismatches, especially for electrodes C03 and C04 in certain patient cases, are mostly due to individual differences in cochlear anatomy, such as size and shape, which affect how deep and where the electrodes are placed. Surgical technique and electrode positioning also play a role, as slight variations can lead to shifts in frequency matching.
The correlation analysis showed strong, significant negative relationships between the AID of each group and its semitone shifts (ABF and DF). However, this association was much more robust with the DF, as Figure 3A shows. The Pearson correlation coefficient in the ABF group was (r= -0.68) compared to (r= -0.81) in the DF group. The relationship between both groups was linear, indicating that greater insertion depths correspond to fewer mismatches in the frequency placement.
The analysis of the differences in absolute frequency between the DF and the ABF in relation to the average TF at each electrode contact showed that the highest frequency range was from 1976 to 4779 Hz. This range corresponds to the central region of the cochlea. Moreover, this area demonstrated the greatest variability among different participants, as shown in Figure 3B. Examination of the frequency-to-place mismatch between the current map ABF and the DF map without considering the TF revealed a sizable decrease (in semitones) after switching participants to ABF. Furthermore, compared with the TF at each electrode contact, there was a greater mismatch with DF than with ABF. For ABF, the highest apparent mismatches were observed at the first and second turns: C3 (8.4 ± 3.9 semitones) and C4 (8.3 ± 3.3 semitones) (see Figure 4A). Analysis of the frequency-to-place semitones for each participant identified apparent mismatches in cases 7, 9, and 13 (Figure 4B).
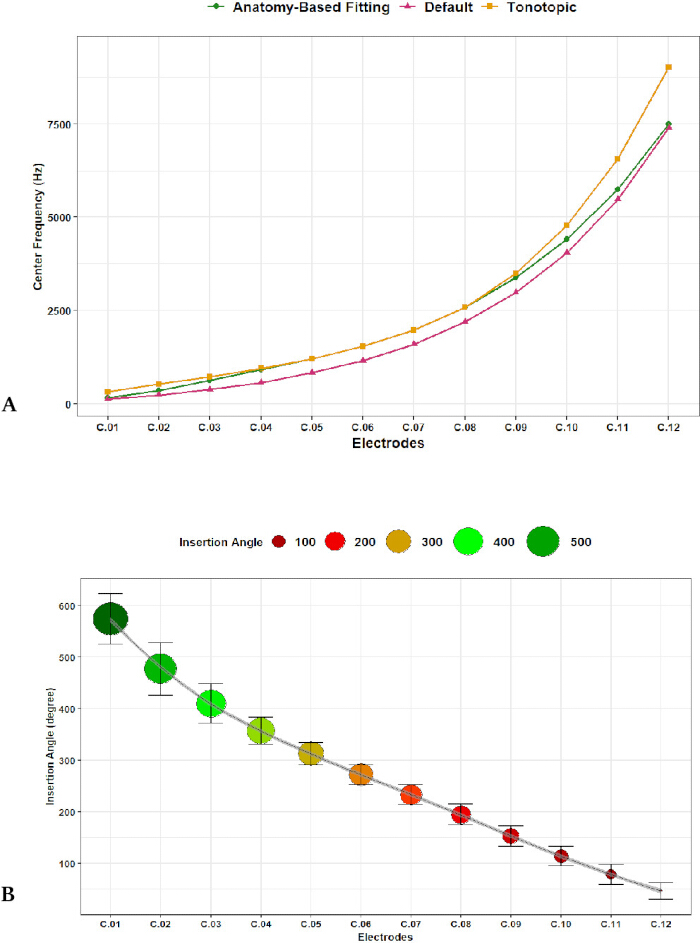
Figure 1: Comparison of frequency allocation and electrode insertion angles. (A) Center frequencies assigned by ABF, DF, and the tonotopic frequency (TF) are shown for each electrode contact (C01-C12). ABF demonstrates closer alignment to TF than DF across the electrode array. (B) Insertion angle measured for each electrode contact based on post-operative X-ray, illustrating angular progression from base to apex of the cochlea. Please click here to view a larger version of this figure.
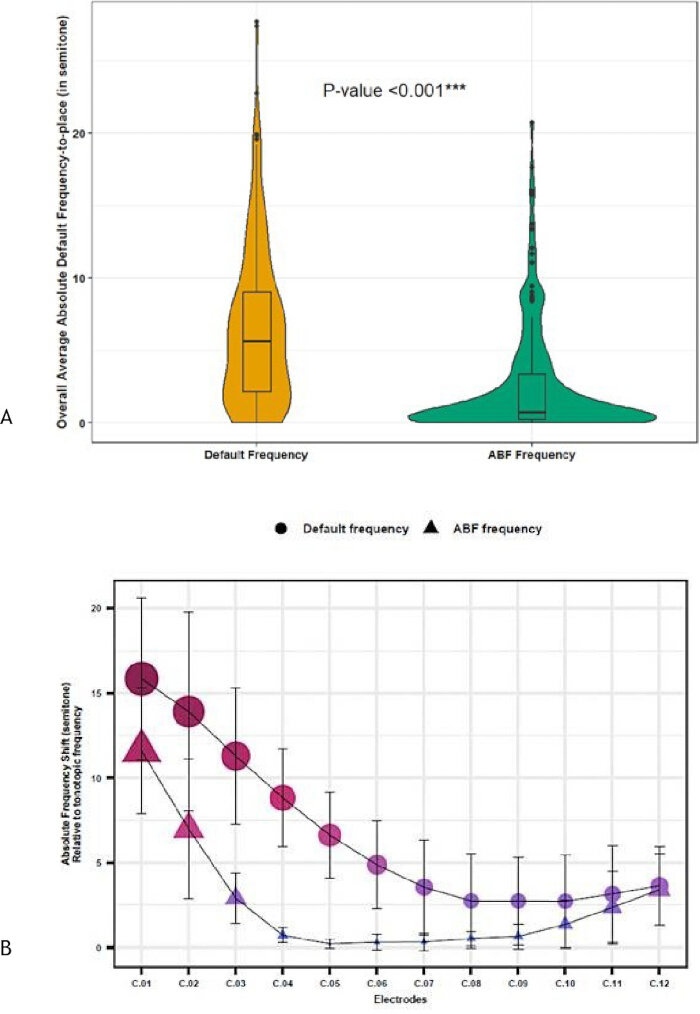
Figure 2: Frequency-to-place mismatch across fitting strategies. (A) Frequency-to-place mismatch values for DF and ABF are displayed across electrode contacts. ABF results in a lower mismatch than DF at most contacts.(B) Mismatch values for DF and ABF plotted with TF as reference. ABF shows reduced and more uniform mismatch relative to DF, particularly in apical contacts. Please click here to view a larger version of this figure.

Figure 3: Relationship between insertion depth and frequency mismatch. (A) Correlation between AID and semitone frequency shift for DF and ABF. Both methods reveal negative correlations, but ABF displays lower variability in mismatch.(B) Absolute differences between DF and ABF frequencies relative to the average TF for each contact. Individual ears are annotated by color, highlighting inter-patient variability. Please click here to view a larger version of this figure.

Figure 4: Case- and contact-based frequency-to-place mismatch. (A) Frequency-to-place mismatch values for DF and ABF shown for each electrode contact across the cohort.(B) Frequency-to-place semitone values for each case across the electrode array, illustrating individual variability in mismatch. Please click here to view a larger version of this figure.
Table 1: Participant demographics and baseline clinical features for all cochlear implant recipients (N = 16 ears). Please click here to download this Table.
Table 2: Comparative analysis between the frequency of placing mismatches for DF and ABF as compared to TF for all electrode contacts. ** for 0.01 > p ≥ 0.001, and, *** for p <0.001. Please click here to download this Table.
Discussion
Loading...
$$\rightleftharpoonup{xx}$$
$$\longleftharp{xx}$$,
$$\longrightharp{xx}$$,
The anatomical diversity of the cochlea and the variability in CI electrode array lengths can lead to frequency-to-place mismatch, negatively affecting speech recognition and CI performance19,20. Moreover, using ABF can effectively reduce frequency-to-place mismatch and improve speech recognition7,12. However, using ABF is limited by the need for high-resolution CT scans, which are costly, time-consuming, and expose the CI recipient to radiation10. The present study investigated whether X-ray-guided ABF effectively minimizes frequency-to-place mismatch and improves speech recognition. The results demonstrate that X-ray-guided ABF is more effective than DF at reducing frequency-to-place mismatches, with a significantly lower mean mismatch. The analysis also highlighted the importance of properly selecting electrode length to minimize mismatch across different electrode contacts.
One key finding of the study is that the mean frequency-to-place mismatch is significantly lower with ABF than with DF. ABF resulted in a significantly lower average absolute frequency-to-place mismatch (2.6 ± 3.8) than DF (6.6 ± 5.6). ABF frequencies were closer to the tonotopic frequency (TF) in the lower frequency range and nearly equivalent to the TF in the middle-frequency range. In contrast, frequencies for both DF and ABF were similar in the upper-frequency region. This finding indicates that ABF was more accurate than DF in matching the frequency components of incoming sound to the appropriate electrode contacts along the cochlea. These Findings align with previous research showing that CT-guided ABF improves the accuracy of cochlear implant programming. A previous study found that ABF substantially reduced frequency-to-place mismatch compared to DF, achieving a 20.7% decrease12. Similarly, another study reported that CT-guided ABF significantly reduced frequency-to-place mismatch. These findings suggest that X-ray-guided ABF is as effective as CT-based ABF11.
Such findings have direct clinical implications, as frequency-to-place mismatch can adversely affect CI performance. A study demonstrated a significant correlation between frequency-to-place mismatch at 1,500 Hz and the reduction in monosyllable scores up to 6 months post-implantation6. Similarly, another study found a significant correlation between frequency-to-place mismatch (ranging from 0.469 to 1.604 octaves) and speech discrimination in noise after 6 months of CI use. However, this effect diminished after 6-12 months8.
The semitonal difference reported in the present study may be deemed minor or not clinically significant at some frequencies in the examined sample. This could be related to pre-operative planning and the choice of electrode arrays that cover a proper portion of the cochlea. Previous research has emphasized the significance of cochlear coverage in reducing the frequency-to-place mismatch8. For example, a previous study found that longer electrode arrays were associated with better speech perception outcomes in quiet and noise, possibly due to increased cochlear coverage21.
The present study found that the insertion depth of the electrode array was a significant predictor of the frequency-to-place mismatch, with deeper insertions resulting in a smaller mismatch. The correlation analysis demonstrated strong negative correlations across all electrode contacts between each group's AID and semitone shifts (ABF and DF). This association was notably stronger with ABF. This finding aligns with earlier studies, which investigated the relationship between cochlear length, insertion angle, and tonotopic mismatch in 106 cochlear implant recipients22. According to the Greenwood map, they reported a tonotopic mismatch across all cochleae, ranging from -10 to -16 semitones, with less mismatch in small- and medium-sized cochleae than in large ones. The authors attributed this difference to the cochlea's length relative to the electrode length rather than the absolute length of the cochlea. Recent studies have reported similar findings, such as an increased insertion angle of the most apical electrode contact, associated with a lower difference between default and ABF mismatch12. However, within each participant, ABF maps showed lower mismatches than DF maps. It remains to be established which range of insertion depth ABF is most helpful. Nonetheless, these findings have important implications for CI programming and highlight the need for individualized fitting based on the recipient's cochlear anatomy. X-ray-guided ABF may be particularly beneficial in cases where electrode array insertion depth can help minimize the frequency-to-place mismatch and improve speech recognition outcomes.
The results of the present study showed that the frequency-to-place mismatch varied among different electrode contacts, with the most significant mismatch occurring in the apical electrodes, specifically in contacts C03 and C04. These findings align with a previous study that reported similar results for specific electrode contacts but differed from other contacts22. Variability was observed in the center frequencies estimated by the ABF method compared to the default frequencies used for different electrode contacts and participants. This highlights the need for individualized frequency allocation methods to improve cochlear implant fitting accuracy. Analysis of frequency differences between ABF and DF relative to the TF revealed a more significant difference between 1976 Hz and 4779 Hz. This suggests that ABF was more effective in this region, which is near the middle of the cochlea. It is also possible that the mismatch in this area is very high with DF, which could explain the more significant difference observed. Finally, examination of the ABF map and its deviation from the DF showed the most significant mismatch in electrode contacts 3 and 4. The location of these contacts within the cochlea, the AID, or the current default frequency-allocation method could explain this. Overall, these findings suggest there is room for improvement in CI fitting, particularly in reducing the frequency-to-place mismatch in the apical contacts.
While the study offers valuable insights into X-ray-guided ABF as an alternative to CT-guided ABF, its small sample size may limit the relevance of the results and reduce the statistical power to detect significant differences or associations. To address this, a post-hoc power analysis was performed. For the observed effect size (Cohen's d = 1.13) comparing the absolute overall frequency shift between default fitting (6.6 ± 5.6 semitones) and ABF (2.6 ± 3.8 semitones), the sample of 16 ears provided 98.8% power at a 5% significance level to detect a true difference. This indicates that, despite the small sample, the observed differences are likely to be statistically robust.
The focus was primarily on the impact of X-ray-guided ABF on frequency-to-place mismatch, without assessing other critical factors such as speech perception, sound quality, or patient-reported outcomes. Therefore, future studies with larger sample sizes incorporating both objective and subjective outcome measures are needed to explore X-ray-guided ABF further. Recent research suggests that in vivo tonotopic maps derived from electrocochleography may provide more precise frequency-to-place estimates than those generated using default cochlear mappings, and should be considered in future investigations23,24. Additionally, registration of post-operative X-ray with pre-operative CT could be explored to further enhance the accuracy of AID estimation25.
In conclusion, the present study demonstrated that X-ray-guided ABF could minimize the frequency-to-place mismatch in CI recipients/users. The results showed a significant decrease in the mean mismatch with ABF compared to the DF method. The analysis emphasized a significant discrepancy between frequency and placement in several electrode contacts, particularly in the basal electrodes. This suggests that ABF might be beneficial in this region. Further, the research highlighted the need to select the proper length for the electrode array to decrease the discrepancy. The regression models showed that the more profound the insertion, the lower the mismatch, indicating that a precise CDL estimation is crucial for optimal CI programming. However, further studies with larger sample sizes and long-term follow-ups are needed to confirm the benefits of X-ray-guided ABF in clinical practice.
Disclosures
Loading...
$$\rightleftharpoonup{xx}$$
$$\longleftharp{xx}$$,
$$\longrightharp{xx}$$,
Yassin Abdelsamad and Ahmed Hafez are employees of MED-EL GmbH, involved solely in scientific roles. All other authors declare no conflicts of interest.
Acknowledgements
Loading...
$$\rightleftharpoonup{xx}$$
$$\longleftharp{xx}$$,
$$\longrightharp{xx}$$,
The authors thank Michael Todd (MED-EL) for editing the manuscript and Rahma Sweedy for performing the statistical analysis.
Materials
| Name | Company | Catalog Number | Comments |
|---|---|---|---|
| Greenwood function | Mathematical model for cochlear tonotopic mapping | Integrated in OTOPLAN software | Transposed frequency (TF) calculation (Step 4.1.1) |
| MAESTRO software | Cochlear implant programming software | MED-EL GmbH (Innsbruck, Austria) | ABF frequency import and CI programming (Step 4.3–4.4) |
| MED-EL FLEX26 electrode array | 26 mm cochlear implant electrode | MED-EL GmbH (Innsbruck, Austria) | Cochlear implantation (Table 1) |
| MED-EL FLEX28 electrode array | 28 mm cochlear implant electrode | MED-EL GmbH (Innsbruck, Austria) | Cochlear implantation (Table 1) |
| OTOPLAN software | Surgical planning and electrode analysis software | CAScination AG (Bern, Switzerland) in cooperation with MED-EL (Innsbruck, Austria) | Anatomical marking, electrode identification, CDL and AID calculation, ABF map generation (Steps 3, 4) |
References
Loading...
$$\rightleftharpoonup{xx}$$
$$\longleftharp{xx}$$,
$$\longrightharp{xx}$$,
- Barker, F., Mackenzie, E., Elliott, L., Jones, S., de Lusignan, S. Interventions to improve hearing aid use in adult auditory rehabilitation. Cochrane Database Syst Rev. 8, CD010342(2016).
- Pieper, S. H., et al. Considerations for fitting cochlear implants bimodally and to the single-sided deaf. Trends Hear. 26, 233121652211082(2022).
- Finley, C. C., et al. Role of electrode placement as a contributor to variability in cochlear implant outcomes. Otol Neurotol. 29 (7), 920-928 (2008).
- Thong, J. F., et al. Cochlear duct length-one size fits all. Am J Otolaryngol. 38 (2), 218-221 (2017).
- Helpard, L., et al. Three-dimensional modeling and measurement of the human cochlear hook region: Considerations for tonotopic mapping. Otol Neurotol. 42 (6), E658-E665 (2021).
- Canfarotta, M. W., et al. Frequency-to-place mismatch: Characterizing variability and the influence on speech perception outcomes in cochlear implant recipients. Ear Hear. 41 (5), 1349-1361 (2020).
- Kurz, A., Herrmann, D., Hagen, R., Rak, K. Using anatomy-based fitting to reduce frequency-to-place mismatch in experienced bilateral cochlear implant users: A promising concept. J Pers Med. 13 (7), 1109(2023).
- Mertens, G., Van de Heyning, P., Vanderveken, O., Topsakal, V., Van Rompaey, V. The smaller the frequency-to-place mismatch, the better the hearing outcomes in cochlear implant recipients. Eur Arch Otorhinolaryngol. 279 (4), 1875-1883 (2022).
- Kurz, A., Müller-Graff, F. T., Hagen, R., Rak, K. One click is not enough: Anatomy-based fitting in experienced cochlear implant users. Otolaryngol Head Neck Surg. 43 (10), 1176-1180 (2022).
- Távora-Vieira, D., et al. Evaluation of the performance of OTOPLAN-based cochlear implant electrode array selection: A retrospective study. J Pers Med. 13 (8), 1276(2023).
- Lambriks, L., et al. Imaging-based frequency mapping for cochlear implants - evaluated using a daily randomized controlled trial. Front Neurosci. 17, 1119933(2023).
- Lassaletta, L., Calvino, M., Sánchez-Cuadrado, I., Gavilán, J. Does it make any sense to fit cochlear implants according to the anatomy-based fitting? Our experience with the first series of patients. Front Audiol Otol. 1, (2023).
- Di Maro, F., Carner, M., Sacchetto, A., Soloperto, D., Marchioni, D. Frequency reallocation based on cochlear place frequencies in cochlear implants: A pilot study. Eur Arch Otorhinolaryngol. 279 (10), 4719-4725 (2022).
- Yigit, O., Kalaycık Ertugay, C., Yasak, A. G., Araz, S. E. Which imaging modality in cochlear implant candidates. Eur Arch Otorhinolaryngol. 276 (5), 1307-1311 (2019).
- Weisstanner, C., et al. Radiation dose reduction in post-operative computed position control of cochlear implant electrodes in lambs - An experimental study. Int J Pediatr Otorhinolaryngol. 79 (12), 2348-2354 (2015).
- Theunisse, H. J., et al. Cone-beam CT versus multi-slice CT systems for post-operative imaging of cochlear implantation-A phantom study on image quality and radiation exposure using human temporal bones. Otol Neurotol. 36 (4), 592-599 (2014).
- Alahmadi, A., et al. Advancing cochlear implant programming: X-ray guided anatomy-based fitting. Otol Neurotol. 45 (2), 107-113 (2024).
- Anatomy-based fitting: A new tool for improving place-pitch match. MED-EL Professionals Blog. , Med-El. https://blog.medel.pro/audiology/anatomy-based-fitting-improving-place-pitch-match/ (2025).
- Sturm, J. J., Ma, C., McRackan, T. R., Schvartz-Lézac, K. C. Frequency-to-place mismatch impacts cochlear implant quality of life, but not speech recognition. Laryngoscope. 134 (6), 2898-2905 (2024).
- Dessard, L., et al. Cochlear implant: Analysis of the frequency-to-place mismatch with the table-based software OTOPLAN and its influence on hearing performance. Audiol Neurotol. 29 (3), 239-245 (2024).
- Wong, K., Ruckenstein, M. J. Triological best practice: Does cochlear implant electrode array length impact performance. Laryngoscope. 134 (8), 3421-3422 (2024).
- Dutrieux, N., Quatre, R., Peñ, V., Schmerber, S. Correlation between cochlear length, insertion angle, and tonotopic mismatch for MED-EL FLEX28 electrode arrays. Otol Neurotol. 43 (1), 48-55 (2022).
- Walia, A., et al. Electrocochleography-based tonotopic map: I. Place coding of the human cochlea with hearing loss. Ear Hear. 46 (1), 253-264 (2024).
- Walia, A., et al. Electrocochleography-based tonotopic map: II. Frequency-to-place mismatch impacts speech-perception outcomes in cochlear implant recipients. Ear Hear. 45 (6), 1406-1417 (2024).
- Liu, G. S., Cooperman, S. P., Neves, C. A., Blevins, N. H. Estimation of cochlear implant insertion depth using 2D-3D registration of post-operative X-ray and pre-operative CT images. Otol Neurotol. 45 (3), e156-e161 (2024).
Reprints and Permissions
Request permission to reuse the text or figures of this JoVE article
Request Permission