This article presents a protocol to identify the risk of handwriting difficulties (HD) in Japanese students using eye-tracking methods. Students at risk for HD in school settings can be identified by assessing the proportion of meaningless sentences in their stimulus observations, their writing fluency, and their motor coordination skills.
A subscription to JoVE is required to view this content. Sign in or start your free trial.
Method Article
Comparing Sentence Observation Ratios During Reading and Writing in Japanese Students with Handwriting Difficulties
In This Article
Summary
Abstract
Students with handwriting difficulties (HD) often show visual-motor challenges that affect sentence writing. However, few studies have compared the eye movements of HD and typically developing (TD) children when reading and writing. Recent studies have suggested that the proportion of time spent observing stimuli can help identify behavioral problems in children with developmental disabilities. This study compared the stimulus observation proportions between students with HD and TD peers. Japanese HD (n = 12) and TD participants (n = 15) were examined for differences in eye movement patterns when reading and writing Japanese sentences and compared reading and writing performance for meaningful and meaningless sentences. Eye movements were recorded while participants wrote several Japanese sentences. The results indicated that TD participants read and wrote sentences more fluently than HD peers, although no group differences were found for meaningful writing tasks. HD participants observed sentences more frequently in both reading and writing tasks than their TD peers and showed shorter observation spans and lower observation ratios during handwriting; however, their observation proportions during reading were comparable. Binary logistic regression revealed that letters per minute, the proportion of time spent on meaningless handwriting observations, and motor coordination scores were key indicators for identifying students with HD. These findings suggest that shorter observation spans and lower proportions of stimulus observation when writing reflect an HD student's tendency to merely glance at sentences rather than read them thoroughly.
Introduction
Handwriting is a complex behavior that requires the integration of visual, motor, and cognitive skills1,2,3,4,5. Recent studies have shown that handwriting difficulties (HD) can be detected by having participants write cycloid loops on paper from left to right2,3.In these studies, typically developing (TD) participants demonstrated similar visuomotor integration (VMI) skills for spatial and temporal arrangements regardless of whether their eyes were open or closed. However, students with HD showed better spatial and temporal arrangements but poorer writing performance when their eyes were closed. In contrast, despite poorer VMI skills, they wrote less accurately and fluently, with lower legibility, when their eyes were open. These results suggest that visual skill deficits interfere with fluent handwriting performance in students with HD1,2,3. However, Lopez and Vaivre-Douret2,3 did not directly measure visual performance data, such as eye-movement patterns, or compare the visual skills of HD and TD students. Therefore, comparing eye movement patterns during handwriting between TD and HD participants may help identify students at risk for HD in daily and school settings.
Few studies have examined eye-movement patterns in HD participants4,5, despite the importance of comparing such patterns during handwriting6. Omori6 analyzed eye movement patterns in TD college students during sentence writing. He divided participants into two groups based on their VMI skills and assessed them using a standardized visual-motor integration test7. The results indicated that students with lower VMI skills made more and longer fixations and looked back more frequently at the sentence and their hands than students with higher VMI skills. In other words, poor VMI skills are associated with poor observing skills during handwriting. Poor handwriting performance results in longer observing times, more fixations, and longer fixation durations2,3,6. Furthermore, when the number of looks back at one's hands and the stimuli increases, the stimulus observing ratio, defined as the total duration of stimulus observation relative to total handwriting duration, decreases. Consequently, HD participants spend a smaller proportion of their total writing time on actual handwriting, resulting in a lower observing ratio than TD participants2,3. TD students with lower VMI skills also looked back at their hand movements and target stimuli more frequently and showed difficulties integrating visuomotor skills7. However, previous studies have only evaluated fixation data, not gaze data, which includes both fixations and saccades6. To better capture stimulus observation during handwriting, it is advisable to consider both gaze data, which include visit duration and visit count, and fixation data, which include fixation duration and count. Therefore, examining the relationship between visit duration and target stimuli as an observing ratio may help elucidate the visuomotor integration difficulties associated with handwriting.
Sita and Taylor reported that TD adults had fewer fixations, shorter mean fixations, and shorter visit durations when reading compared to writing single words8. However, it remains unclear whether TD and HD students show similar eye movement patterns when reading and writing sentences. Furthermore, most prior studies have focused on alphabetic languages1,2,3,4,5,8, whereas only one study has investigated Japanese writing6. Therefore, the present study compared eye movement patterns in TD and HD students when reading and writing Japanese sentences. Because recent work has shown that students with reading difficulties can be identified through nonword reading9,10, meaningless stimuli were included in this study in addition to meaningful ones. Steacy et al. reported that meaningless word reading skills are strongly associated with the subsequent development of meaningful word reading10. Although the response modalities differ, comparing meaningful and meaningless sentence writing may similarly help detect students with HD. Therefore, both stimulus types were prepared.
Writing Chinese characters or Japanese Kanji is expected to cause greater handwriting difficulty than writing Roman letters11. Tse et al. compared Chinese and English handwriting development in TD and HD children and found greater difficulty in Chinese, reflecting problems with stroke formation11. They also reported poorer VMI, poorer visual perception (VP), and poorer fine motor skills in HD than TD children, with no group differences in reading performance11. In Japan, approximately 10% of elementary school students in mainstream classes have writing difficulties12. Kono, Hirabayashi, and Nakamura demonstrated that students' writing fluency increased from 13.08 letters per minute (LPM) in 1st grade to 31.26 LPM in 6th grade13, whereas their reading fluency increased from 202.50 LPM in 1st grade to 461.90 LPM in 6th grade14. Another study using a digital pen reported longer continuous writing spans and fewer downward glances at the paper as handwriting skills developed15. Noda et al. found that Japanese students with developmental disabilities, including HD, have poorer fine motor skills and poorer sustained writing attention16. Taken together, these findings11,13,15,16 suggest that Japanese students with HD exhibit slower writing LPM, shorter continuous writing spans, and more frequent looks back to the stimuli and their hands than TD peers13. Although the continuous writing span is typically measured using a digital pen, it can also be estimated from eye tracking by counting fixations. Calculating letters per fixation (L/FX) from eye movement data indicates how often individuals need to fixate on each letter, and the frequency of looking back can be indexed as an observing ratio using total visit duration to the stimuli relative to total writing duration. Therefore, I used an eye tracker to compare L/FX as the observing span and %VD as the observing ratio between HD and TD students.
To investigate eye movement differences when reading and writing Japanese sentences, and to compare performance for meaningful and meaningless sentences between HD and TD students, participants read and wrote several Japanese sentences while their eye movements were recorded. I predicted that HD students would exhibit lower reading and writing LPM13, fewer observation spans with shorter fixation durations6, and a lower proportion of stimulus observation when reading and writing compared to TD students2,3,6. I expected distinct eye movement patterns, reduced observing spans, and lower observing ratios in HD relative to TD students.
Access restricted. Please log in or start a trial to view this content.
Protocol
Written informed consent was obtained from participants and their parents or guardians before participation. The Institutional Review Board of Waseda University (No. 2020-176) approved this study.
1. Participants
- Install the software on a computer from the website (see Table of Materials) to determine the sample size by power analysis.
- Click on the software to open it.
- In the Test family tab, select F test, and in the Statistical test tab, select ANOVA: Repeated measures, within-between interactions. Under Type of power analysis, choose A priori: Compute required sample size, given α , power, and effect size.
- Click Determine, then select Direct in the pop-up window. Enter the partial η2 from the chosen previous study (0.20 in this study)6. Click Calculate, then Calculate and transfer to main window. Ensure that Effect size f in the Input parameters panel has been updated.
- Enter 2 for Number of groups and 4 for Number of measurements for this study. Click Calculate on the main page and confirm that the Total sample size is 12 for this study.
NOTE: Based on the previously reported effect sizes from time-course analyses6, the power analysis indicated that at least 12 participants are required to detect a partial η2 of 0.20 or higher with a three-way mixed ANOVA at p = 0.05 and 95% power.
- Recruit school-aged students and confirm that all are enrolled in mainstream classes at public elementary, junior high, or high schools. In this study, 31 students (chronological age [CA] range, 7-17 years) participated.
- Present Japanese words referencing "cat[neko]," "dog [inu]," and "bird[tori]", and instruct participants to write them. Confirm that participants can write the presented words correctly; otherwise, exclude them from the study.
- Exclude any participant who cannot complete the assessments. Based on these criteria, four participants were excluded. Finally, 27 participants (16 boys, 11 girls) participated in this study.
- Ask participants or their parents about their academic history, especially their reading and writing skills. Request disclosure of any diagnoses, if available, and ensure that diagnoses were made by a pediatrician using clinical criteria17.
- Divide participants into two groups based on academic history and clinical criteria: HD (n = 12; 7 with LD and 5 with LD and autism spectrum disorder (ASD)) and TD (n = 15). Ensure that TD participants report no reading or writing problems and have not been diagnosed with any developmental disabilities.
- Ask participants (or parents) to provide standardized scores, such as intelligence quotient (IQ) or developmental quotient (DQ), previously measured at hospitals or educational institutions, if available. Leave these fields blank if unavailable. In this study, all participants with HD had prior IQ or DQ scores (mean full-scale IQ = 97.80, SD = 24.32). TD participants did not have prior IQ scores; leave these fields blank.
2. Stimulus and apparatus
- Prepare an eye tracker to record eye movements. Verify that the eye tracker has a measurement performance of 120 Hz or higher.
- Use a display with 1920 × 1080 resolution and a laptop computer to present and control the stimuli. Ensure the laptop includes software to compute eye-movement coordinates and perform statistical analyses.
- Instruct participants to sit approximately 70 cm from the eye tracker during recording. Perform a 5-point calibration before presenting the stimulus. This procedure is performed to establish measurement standards for the display and eye tracker. Click the calibration button and observe the colored dots on the display. When a dot has been fixated sufficiently, it will disappear, and a new dot will appear at a random location, such as the corner or center. Repeat the calibration until acceptable results are obtained in the eye-tracking software.
- Prepare 12 sentences in Hiragana and Kanji, each two to four lines and 32-79 characters. Of these, use eight meaningful sentences describing daily-life content (e.g., Fish ecology, Train delay) and four meaningless sentences written only in Hiragana. Create meaningful sentences with age-appropriate vocabulary, particles, and Kanji at the 2nd-3rd grade level; include three to four Kanji characters per sentence. Create meaningless sentences by combining strings of three or four Hiragana characters. Present all sentences in 28-point font, spanning a single slide. Prepare a blank black slide. Prepare two A4 sheets with four horizontal lines for the writing test for each participant.
- Convert the 12-sentence slides and the black slide to individual JPEG files. Figure 1 shows example sentence stimuli: panel A is a meaningful sentence, and panel B is a meaningless one. Open the eye-tracking software. In the console, create a new project and name it.
- Open Design mode. Select Timeline 1 and set the calibration to the default 5-point mode. Add two meaningful sentence slides and one meaningless slide. Then set the proceed mode to key press so the experimenter can advance with the space bar. Insert the blank black slides before, between, and after the sentence slides, also set to key press. Prepare four timelines in the same manner, each with different sentence slides. In Timelines 1 and 3, present the meaningful sentence first, followed by the meaningless sentence; in Timelines 2 and 4, reverse the order.
- Implement Hiragana-only short-sentence timelines for participants under 10 years of age. For older participants, use mixed Hiragana-Kanji sentence timelines.
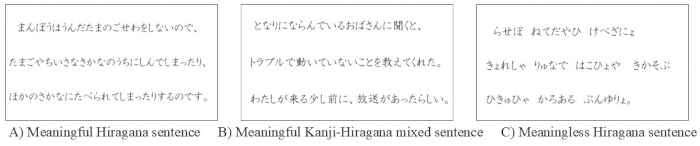
Figure 1: Examples of sentence stimuli for reading and writing tasks. (A) A meaningful sentence stimulus, and (B) a meaningless sentence stimulus. Please click here to view a larger version of this figure.
3. Pre-Assessment: PVT-R
- Sit face-to-face with the participant. Ask their date of birth; if they cannot respond accurately, ask their parents.
- Present the PVT-R booklet to the participant. The booklet consists of 15 pages, each featuring four visual stimuli. Instruct the participant to listen to the spoken stimulus and touch the corresponding visual stimulus from the four choices.
- Present each spoken stimulus once according to the instructions and have the participant select the corresponding visual stimulus from the four choices. Record the selection on the sheet, then present the next spoken stimulus. Each page includes six spoken-stimulus presentations.
- Count the number of correct responses on each page and proceed to the next page until the participant makes three or more errors on two pages. The errors need not be consecutive; do not advance if this criterion is met. Alternatively, stop the assessment if the participant completes page 15 without meeting the error criterion.
- Count the total number of correct and incorrect responses in the booklet, then calculate the adjusted score, standard score, and verbal age according to the manual.
4. Pre-assessment: Beery-VMI VI
- Sit face-to-face with the participant. Ask which hand is dominant.
- Present the VP booklet. Instruct participants to observe the sample geometric figure at the top of the page, then the choice figures at the bottom. Have them select the figure identical to the sample. Repeat this process until the participant has completed all 30 items, then proceed to the next task. Count the number of correct responses.
- Present the motor coordination (MC) booklet. For the first 20 items, instruct participants to connect the darker dots to the lighter dots to form geometric figures. Instruct the participants to trace lines within the shapes without touching the outlines for the last 10 items. Inform them that the MC task must be completed within 5 min. Then, count the number of correctly connected figures and correctly traced shapes.
- Count the total number of correct responses in the VP and MC booklets and calculate the standard score for visuomotor integration according to the manual.
5. Eye movement measurement
- Attach the magnetic mounting bracket to the center of the display's bottom edge.
- Connect the eye tracker to the display with a USB cable. Attach the eye tracker to the bottom of the display using the included magnetic bracket. Ensure the bracket and eye tracker are securely fastened.
- Open the configuration software. Select the attached eye tracker and display. Click the calibration button and select the stimulus presentation display. Seat the participant in front of the display and adjust their position to an appropriate distance. Ensure the pre-calibration indicator turns green, confirming approximately 70 cm distance; adjust the seating as needed.
- Click the calibration button and observe the colored dots on the display. When a dot has been fixated sufficiently, it will disappear, and a new dot will appear at a random location, such as the corner or center. Continue until all seven dots have been completed, then click Accept to finish calibration. Close the configuration software.
- Open the eye-tracking software and the named project. Select the Recording mode and choose the recording eye tracker from the upper-left menu. Select the stimulus presentation display and enter the participant's name in the Participant tab. Select one of the four timelines and counterbalance the test order (reading vs. writing). For example, for Participant 1, start with reading in Timeline 1 and writing in Timeline 3; for Participant 2, begin with writing in Timeline 4 and reading in Timeline 2. Ensure both tests are completed for each participant. Wait for the participant to be seated in front of the display.
- Instruct participants to sit approximately 70 cm from the eye tracker. Press Recording to proceed to calibration. Verify the appropriate distance by confirming the eye-tracker status indicator turns green.
- Click Start calibration to proceed. Instruct participants to follow the white moving dots on the display. If calibration is acceptable, press Start to present the sentence slide for the reading or writing task; otherwise, click Recalibrate and repeat until successful.
- Start the reading tests (see Figure 2A for details). Select Timeline 1 or 2.
- Complete steps 5.5 through 5.7. Instruct participants to read the presented sentence slide aloud as quickly as possible.
- Press the space bar to present a blank black slide. Prepare the participant for reading, then press the space bar to present the first sentence slide. Listen carefully and count the number of reading errors on the slide. When the participant finishes the final character, press the space bar to advance to the next blank black slide.
- Prepare the participant, then press the space bar to present the second sentence slide. Listen carefully and count the number of reading errors. When the participant finishes the final character, press the space bar to continue. Repeat for the third slide to complete the reading test. Recording stops automatically after the final key press.
- Click Save recording in the pop-up window to save the eye-movement data and return to the project home.
- Prepare for the writing test by selecting another timeline or finish the session if both tests are completed.
- Start the writing tests (see Figure 2B for details). Select Timeline 3 or 4.
- Complete steps 5.5 through 5.7. Instruct participants to handwrite the presented sentence(s) onto an A4 sheet with four horizontal lines as quickly as possible.
- Press the space bar to present a black blank slide. Prepare the participant for writing; then, press the space bar to present the first sentence slide. Observe the writing and count the errors on the slide. Instruct participants to rewrite incorrect words, erasing the previous response with double lines. When the participant finishes the final character, press the space bar to advance to the next black blank slide.
- Collect the completed sheet and provide a new sheet to the participant.
- Prepare the participant, then press the space bar to present the second sentence slide. Observe the writing and count errors on the slide. Instruct participants to rewrite incorrect words, erasing the previous response with double lines. When the participant finishes the final character, press the space bar to continue. Repeat for the third slide to complete the writing test. Recording stops automatically after the final key press.
- Click Save recording in the pop-up window to save the eye-movement data and return to the project home.
- Prepare for the reading test by selecting another timeline or finish the eye-movement measurement if both tests are completed.
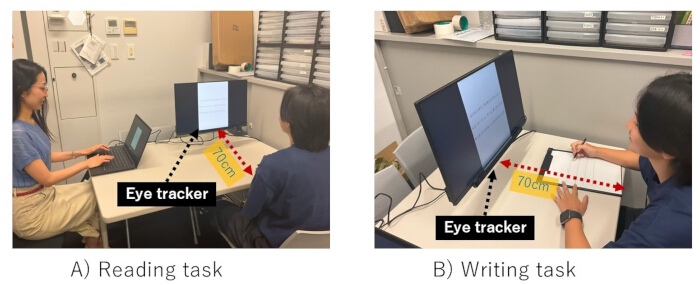
Figure 2: Eye movement measurements during reading and writing tasks. (A) A reading task trial, and (B) a writing task trial. Please click here to view a larger version of this figure.
6. Exporting eye movement data
- After collecting the data from all the participants, open the eye-tracking software and go to the project home.
- Choose the Analyze tab and select the AOI Tool.
- Select the rectangle tool to draw an area of interest (AOI) on the stimulus image. Adjust the rectangle to cover the entire text region. Eye-movement data will be calculated within the AOI. Name each AOI "MF_R_##" for meaningful reading, "ML_R_##" for meaningless reading, "MF_W_##" for meaningful writing, or "ML_W_##" for meaningless writing, replacing "##" with the appropriate numbers.
- Repeat this process to create and name AOIs for all stimuli used.
- Choose the Analyze tab and select Metrics export.
- Observe the settings panel on the right side of the page.
- Select Excel report under Export format, and ensure I-VT filter and Noise reduction are selected for Gaze filter and Pupil diameter filter, respectively.
- Select the checkboxes for All recordings in the Recording section, Entire recordings in the Time of interest section, and All areas of interest in the Area of interest section.
- On the left side of the window, open Select metrics for report.
- Check Select all, then click Export.
- Open the exported Excel file and verify all exported data.
- Conduct statistical analyses using the exported data.
7. Data analysis
- Set dependent variables for analysis.
- Score the PVT-R to obtain standard scores according to the manual.
- Score the Beery-VMI 6 to obtain ability scores for VP and MC according to the manual.
- Open the exported Excel file and select the Interval duration tab. Note that interval duration is defined as the time from pressing the space bar to present a sentence stimulus until the final character is produced and the space bar is pressed to advance to the next slide.
- Calculate letters per minute (LPM) as a behavioral performance measure. Divide the number of letters in the sentence by the response time, then multiply by 60 (e.g., 60 letters ÷ 15 s × 60 = 240 LPM). Note that higher LPM indicates better performance.
- Open the Average fixation duration tab. Multiply by 1,000 to express FD in milliseconds. Organize the data in an Excel sheet by participant, test (reading vs. writing), and sentence condition.
- Open the Fixation count tab. Organize the data in an Excel sheet by participant, test (reading vs. writing), and sentence condition. Calculate letters per fixation (L/FX) as the observing span: divide the number of letters in the sentence by the fixation count (e.g., 60 ÷ 15 = 4.00 L/FX). Note that a longer observing span corresponds to a larger L/FX.
- Open the Total visit duration tab. Organize the data in an Excel sheet by participant, test (reading vs. writing), and sentence condition. Reuse the interval duration for the next step. Calculate percentage visit duration (%VD) as the observing ratio: divide total visit duration by interval duration within the same condition and multiply by 100 (e.g., 15 s ÷ 30 s × 100 = 50%). Note that a higher percentage of VD indicates a greater observing ratio.
- Statistical analysis
- Open the software on the computer to analyze the data.
- Arrange the data format to prepare for statistical analysis.
- Conduct independent t-tests to evaluate participants' verbal abilities and visuomotor integration abilities.
- Conduct mixed factorial ANOVAs on reading and writing LPM and on eye-movement measures (mean FD, L/FX, %VD) using a 2 (group: HD vs. TD; between-subjects) × 2 (test: reading vs. writing; within-subjects) × 2 (sentence: meaningful vs. meaningless; within-subjects) design.
- Conduct binary logistic regression analyses to examine whether screening measures and eye-movement patterns predict HD risk across all participants.
Access restricted. Please log in or start a trial to view this content.
Results
Participant's profile analysis
Table 1 shows the participants' verbal abilities and visuo-motor integration skills. The mean chronological age of HD participants was 11.11 years (range: 8.33-14.83 years) and 11.97 years for TD participants (range: 7.67 - 17.50 years). The PVT-R [18] indicated that HD participants had lower standardized scores than TD participants (8.92 vs. 12.75 [t (18) = 2.25, p = 0.03, Cohen's d = 5.00]). VP and MC scores [8] of the two g...
Access restricted. Please log in or start a trial to view this content.
Discussion
This study examined differential eye-movement patterns in 12 HD and 15 TD participants when reading and writing meaningful and meaningless Japanese sentences. As shown in Figure 3A, HD participants had slower LPM scores for reading and writing compared to TD participants, suggesting that HD participants experience greater difficulty in these tasks. HD participants often also have reading difficulties21. Therefore, future studies should use reading materials matched to...
Access restricted. Please log in or start a trial to view this content.
Disclosures
The author declares no intellectual, financial, or biomedical conflicts of interest.
Acknowledgements
This work was supported in part by JSPS KAKENHI (Grant No. 22K13739)." Portions of the data were previously presented, in Japanese, as a poster at the Annual Meeting of the Japanese Association of Special Education. All procedures involving human participants conformed to the ethical standards of the 1964 Helsinki Declaration and its later amendments or comparable ethical standards. The study was approved by the Institutional Review Board of Waseda University (No. 2020-176). Written and oral informed consent was obtained from all participants and their parents.
Access restricted. Please log in or start a trial to view this content.
Materials
| Name | Company | Catalog Number | Comments |
|---|---|---|---|
| Beery VMI-6 | Pearson | https://www.pearsonassessments. com/en-us/Store/Professional- Assessments/Motor-Sensory /Beery-Buktenica-Developmental -Test-of-Visual-Motor-Integration -%7C-Sixth-Edition/p/100000663 ?srsltid=AfmBOooTl4STWGQhq ArZwKdX_mSiV0nHgJWPfjddJ 9z0erbWm7Qq6H9v | Standardized test to assess visuo-motor integration skills |
| Computer display | Dell | P2419H | resolution 1920×1080 |
| Eye tracker | Tobii Technology Japan | X3-120 | Portable eye tracker |
| G*Power | Heinrich-Heine-Universität Düsseldorf | https://www.psychologie.hhu.de /arbeitsgruppen/allgemeine- psychologie-und-arbeitspsychologie/gpower | G*Power analysis software |
| IBM SPSS statistics | IBM | IBM SPSS statistics | version 29.0.2.0 |
| Laptop computer | Dell | Precision 5540 | Windows 11 |
| PVT-R | Nihon Bunkakagakusya | https://www.nichibun.co.jp/seek/kensa/pvt_r.html | Standardized test to assess verbal age |
| Tobii Pro Lab | Tobii Technology Japan | Tobii Pro Lab | Eye movement analysis software |
References
- Beery, K. E., Buktenica, N. A., Beery, N. A. The Beery-Buktenica Developmental Test of Visual-Motor Integration. , Modern Curriculum Press, Parsippany, NJ. Parsippany, NJ. (1997).
- Lopez, C., Vaivre-Douret, L. Influence of visual control on the quality of graphic gesture in children with handwriting disorders. Sci Rep. 11, 23537(2021).
- Lopez, C., Vaivre-Douret, L. Exploratory investigation of handwriting disorders in school-aged children from first to fifth grade. Children. 10 (9), 1512(2023).
- Memisevic, H., Djordjevic, M. Visual-motor integration in children with mild intellectual disability: a meta-analysis. Percept Mot Skills. 125 (4), 696-717 (2018).
- Prunty, M., Barnett, A. L., Wilmut, K., Plumb, M. S. Handwriting speed in children with developmental coordination disorder: are they really slower. Res Dev Disabil. 34 (9), 2927-2936 (2013).
- Omori, M. Eye movements during writing in female college students and graduate students. Gakuen: Bull Showa Women's Univ. 940, 12-21 (2019).
- Sita, J. C., Taylor, K. A. Eye movements during the handwriting of words: individually and within sentences. Hum Mov Sci. 43, 229-238 (2015).
- Beery, K., Beery, N. The Beery-Buktenica Developmental Test of Visual-Motor Integration. , 6th ed, Pearson. San Antonio. (2010).
- Zhang, Z., Peng, P. Reading real words versus pseudowords: a meta-analysis of research in developmental dyslexia. Dev Psychol. 58 (6), 1035-1050 (2022).
- Steacy, L. M., Edwards, A. A., Rueckl, J. G., Petscher, Y., Compton, D. L. Modeling and visualizing the codevelopment of word and nonword reading in children from first through fourth grade: informing developmental trajectories of children with dyslexia. Child Dev. 92 (3), e252-e269 (2021).
- Tse, L. F., Siu, A. M., Li-Tsang, C. W. Developmental skills between kindergarten children with handwriting difficulties in Chinese and/or English. Aust Occup Ther J. 66, 292-303 (2019).
- Doyama, A., Hashimoto, S., Hayashi, A. Learning of handwriting in elementary school children with writing difficulties and support in a regular class: focus on difficulties in input, output, and processing. Jpn J Dev Disabil Res (JDDR). 36 (4), 369-379 (2014).
- Kono, T., Hirabayashi, R., Nakamura, K. Handwriting speed of primary school students in Japan. Jpn J Spec Educ. 46 (4), 223-230 (2008).
- Takahashi, M., Iwabuchi, M., Kono, T., Nakamura, K. Development of audio-visual learning support system "Touch & Read": how it can compensate reading difficulties. Cogn Stud. 18 (3), 521-533 (2011).
- Hirabayashi, R., Kono, T., Nakamura, K. Developmental changes in handwriting patterns among elementary school children using digital pens. Jpn J Dev Psychol. 24 (1), 13-21 (2013).
- Noda, W., et al. Examining the relationships between attention deficit/hyperactivity disorder and developmental coordination disorder symptoms and writing performance in Japanese second grade students. Res Dev Disabil. 34 (9), 2909-2916 (2013).
- Diagnostic and Statistical Manual of Mental Disorders. , 5th ed, American Psychiatric Association. Washington, DC. (2010).
- Wechsler, D. Wechsler Intelligence Scale for Children. , 4th ed, Psychological Corporation. San Antonio. (2010).
- Ikuzawa, M., Matsushita, Y., Nakase, A. Kyoto Scale of Psychological Development 2001. , Kyoto International Social Welfare Exchange Centre. Kyoto. (2001).
- Ueno, K., Nagoshi, N., Konuki, S. Picture Vocabulary Test-Revised. , Nihon Bunka Kagakusha. Tokyo. (2008).
- Nation, K., Clarke, P., Wright, B. J., Williams, C. Patterns of reading ability in students with autism spectrum disorder. J Autism Dev Disord. 36 (7), 911-919 (2006).
- Guilbert, J., Alamargot, D., Morin, M. F. Handwriting on a tablet screen: role of visual and proprioceptive feedback in the control of movement by children and adults. Hum Mov Sci. 65, 30-41 (2019).
Access restricted. Please log in or start a trial to view this content.
Reprints and Permissions
This article has been published
Video Coming Soon