Augmented reality (AR) enhances science teaching by integrating educational games, improving interactivity, and enhancing learning outcomes. Experiments show that AR boosts increase scores by 28 points, with freshmen/seniors gaining 22/30 points. Game indicators (playability and applicability) reach 84%-87%, and user satisfaction exceeds 94%. AR significantly improves performance and classroom effectiveness.
A subscription to JoVE is required to view this content. Sign in or start your free trial.
Research Article
Augmented Reality Educational Game Applications in Science Teaching
In This Article
Summary
Abstract
With the deep integration of information technology and education, augmented reality (AR) has become a trend in science teaching, combining virtual reality and real-time interaction. This study designs and develops a science teaching system based on AR technology, integrated with educational game mechanisms, to overcome the problems of difficulty in understanding abstract content and low student participation in traditional science teaching. The system is guided by the theories of experiential learning and constructivism, and it integrates algorithms such as feature point tracking, image correction, and regression training. These algorithms improve the accuracy and stability of virtual models in real environments. Finally, a 12-month comparative experiment is conducted in a science and engineering major at a certain university. Experimental results showed that the average score for the science teaching method using AR technology improved significantly, by 20.11 points, compared with the traditional teaching method. The grade of Freshmen in the teaching system increased by 22.36 points, and the average score of seniors in the teaching system increased by 29.97 points. In the science teaching system, the indicators of educational games, playability, and applicability increased to 84, 87, and 86, respectively. Users' satisfaction with the system's usability, content accuracy, responsiveness, and clarity of indicators could reach 97%, 96%, 94%, and 98%, respectively. In summary, the science teaching system using an AR technology educational game has a significant improvement in students' performance and a strong practical effect in the science classroom.
Introduction
Augmented reality (AR) technology has become a necessity, helping people to experience, detect, and inspire, so as to improve life experience1. This brings heuristic significance to the education and teaching of abstract content. Given the very abstract and difficult-to-observe nature of VR and AR technologies, they can be used2 to enhance the effectiveness of education and teaching, so that students' learning potential can be tapped and developed3. Virtual reality technology has interactivity, immersion, and autonomy, which meet the needs of contemporary education. It can be integrated into practical teaching to build a teaching platform combining virtual and real teaching, and meet the current teaching needs4. According to the science teaching curriculum standards, the interactive features of AR technology are used to support teaching. The interactive art teaching system has profound significance for science teaching5. The research focuses on image extraction, feature matching, and object tracking algorithms. By analyzing the needs of science teaching, AR educational games have been designed to develop AR in science education, with the aim of using AR to improve teaching quality6,7. Compared with existing AR teaching systems, the innovation of this research mainly lies in the fact that it does not simply use AR models for content display, but deeply integrates specific computer vision algorithms and educational game mechanisms. This study integrates real-time tracking and matching based on feature points and image grayscale stretching correction. It also uses ridge and nonlinear regression training models. Additionally, the study combines long-term comparative experiments and multidimensional evaluation index systems. These methods improve the registration accuracy, tracking stability, and environmental adaptability of virtual objects in real environments.
This study focuses on five sections. The first section explains the background and research significance of AR technology in science education, and highlights its potential to enhance learning motivation and understanding of abstract concepts. The second reviews the current application status of educational games and the research progress of AR education systems. The third section analyzes the needs in the teaching process and designs a scientific teaching system based on AR technology educational games. The next section verifies the performance of the proposed teaching system. The final section is a summary and outlook on the research methods and results.
Related works
Educational games are teaching tools that combine learning objectives with game mechanisms, aiming to enhance learning outcomes through fun interactions. With the deep integration of educational games and intelligent technology, the education system is undergoing profound changes. Yang et al. proposed a collaborative filtering recommendation algorithm that combines coverage coarse-grained layer clustering and K-means clustering to address the poor performance in educational game recommendations. The results showed that the accuracy and F1 score of the proposed algorithm were 0.880 and 0.826, respectively, which were better than the slope model8. Sun et al. reported a meta-analysis of 22 empirical studies to determine the effectiveness of educational games in improving students' computational thinking skills. Educational games could improve students' computational thinking skills9. Udeozor et al. reviewed learning practices based on digital games. This study pointed out that people's interest in and demand for experiential learning tools enhanced by technology, such as virtual laboratories and digital games, was gradually increasing. They also emphasized the future trend of digital game learning in engineering education10. Martinez et al. conducted a systematic review of 49 relevant studies in order to better understand the value of educational game practice in the classroom. Ultimately, it was discovered that educational games can become an effective educational tool, beneficial for almost all subjects11. Gordillo et al. used a quasi-experimental design to compare the effectiveness of video-based learning and game-based learning in online software engineering education. The results indicated that using educational games for learning was more effective than traditional video-based learning12.
AR technology has been widely used in industry, medical treatment, information, education, and other fields due to its combination of virtual and real-time interaction. Lytvynova et al. stated that the integration of virtual reality and AR in educational environments opened up new possibilities for participatory and immersive learning experiences. An educational project that utilized virtual and AR was implemented. The results indicated that virtual reality and AR technology in the educational process provided rich teaching and learning resources, which could enhance the learning experience13. Álvarez Marín et al. addressed the limited research on AR-based educational methods, discussed the types of educational activities that utilize AR, and evaluated its impact on students and teachers. The results indicated that in most studies, AR-based educational methods helped improve academic performance14. De Moraes Rossetto et al. stated that the application of AR and virtual reality became a transformative approach in the field of education. Therefore, this study developed an application consisting of AR and virtual reality and evaluated its impact on the teaching process. The results indicated that both AR and virtual reality showed promise in supporting the teaching process15. Radu et al. proposed an AR system based on HoloLens to improve physics learning performance. The results indicated that the AR system helped students learn spatial content and structural relationships, but also hindered their understanding of kinesthetic content16. Kleftotimos et al. proposed two location-based educational AR applications to improve learner satisfaction and engagement, and invited 129 students for preliminary evaluation. The results indicated that AR applications score high in usability, student satisfaction, and perceived educational usefulness17.
To sum up, the interactive nature of AR technology provides a more natural learning experience for both teachers and learners and enhances exploration awareness. However, existing AR teaching systems mostly focus on model display and simple interaction, lacking deep integration with educational game mechanisms and higher-order learning objectives. There is insufficient long-term tracking research, and the adaptability and tracking stability of the system environment also need to be improved. Therefore, this study aims to develop a scientific teaching system that integrates AR technology and educational game mechanisms. The focus is on addressing issues such as registration accuracy, tracking stability, and the adaptability of virtual objects in real environments. Through long-term comparative experiments and multidimensional evaluation systems, its effectiveness in improving students' learning outcomes and experiences is verified.
Access restricted. Please log in or start a trial to view this content.
Protocol
This study has undergone rigorous review and approval by the relevant ethics review committee, and the entire research process strictly adheres to the Declaration of Helsinki and applicable academic research ethics standards, fully safeguarding the legitimate rights and interests, physical and mental well-being, and personal privacy of the participants.
The recruitment process for research participants complies with ethical requirements, and all participants signed a written informed consent form prior to participation in the study. The informed consent form is clear and easy to understand and explicitly describes the scope of data collection (including academic performance, system evaluation data, and user satisfaction), the purpose of data use (solely for academic analysis in this study), and the measures taken to ensure data confidentiality. Participation was entirely voluntary, and all participants provided informed consent without any coercion or inducement. The equipment used is listed in the Table of Materials.
1. Participants, study design, and evaluation framework
200 undergraduate students (106 males and 94 females, with an average age of 20.4 ± 1.2 years) and 100 teachers (52 males and 48 females, with an average teaching experience of 8.6 ± 4.3 years) are randomly recruited from the science and engineering majors of a certain university as participants. Participants are randomly divided into an experimental group and a control group using a stratified random sampling method, with 150 people in each group. The basic knowledge test before the experiment confirms that there is no statistically significant difference (p > 0.05) in the initial knowledge level between the two groups. The experimental group uses an AR technology-based teaching system, while the control group uses traditional teaching methods. Traditional teaching methods refer to the widely adopted standardized teaching process centered around teachers and textbooks. This includes teacher lectures, textbook and static chart learning, and theoretical calculations, and does not involve any 3D interactive simulation or AR technology. The inclusion criteria are: undergraduate students must have completed the prerequisite course of Materials Mechanics, and teachers must have relevant teaching experience in the course. The exclusion criteria are: those with a history of severe visual impairment or motion sickness. All participants sign informed consent forms and are informed that they can withdraw from the experiment at any time. The experimental period is 12 months, and academic performance and system evaluation data are collected before the start of the experiment, at the 6th month, and at the 12th month. The evaluation tool adopts a self-developed "Educational Game Evaluation Index System" (in Table 1) to evaluate the system's effectiveness from three dimensions: educational, gaming, and applicability, with a total of 15 indicators. User satisfaction data are collected, covering four aspects: ease of operation, accuracy of content, timeliness of response, and clarity of indicators.
2. Experimental system configuration, procedures, and data analysis
The hardware equipment includes an AR display device (Microsoft HoloLens 2), a built-in depth camera and RGB camera, a computer equipped with an Intel Core i9-11950H processor, 32GB RAM, and an A2000 graphics card. The operating system uses Windows 11, the development engine uses Unity 2021, the computer vision library uses OpenCV 4.13.0, and the integrated development environment is Visual Studio 2022. When there is a significant change in the lighting of the experimental environment or when the equipment is used for the first time in that physical space, camera calibration needs to be performed. It runs the built-in calibration script CalibrationScript. cs and capture at least 15 checkerboard images from different angles and positions using the HoloLens camera. The script automatically calculates the camera intrinsic parameters and distortion coefficients. The standard for successful calibration is that the average reprojection error is less than 0.5 pixels. If the standard is not met, the system will prompt to re-capture the image. After successful calibration, calibration parameters are output for subsequent 3D registration module calls.
The experiment is conducted indoors, with ambient light maintained at 300 ± 50 lux. The experimental card with specific AR markings is placed in the center of the table, and the edge of the card is parallel to the edge of the table. The observation position is set to be approximately 60 cm from the center of the card with both eyes, and the HoloLens 2 camera is initially focused on the plane of the card. The gesture interaction adopts the "hand ray" and "air click" gestures preset by HoloLens 2. Its index finger is extended, and the other fingers are retracted, pointing at the virtual specimen, and maintaining a stable gesture for more than 0.5 s to select the object. Subsequently, force is applied by quickly pushing the index finger forward, with a default force value of 50N applied by the system along the axis of the virtual specimen. The expected successful operation time for completing a complete gesture interaction is 1–2 s. The system computer vision parameters are set as follows: call the aruco.detectMarkers function of OpenCV in Unity to detect the threshold (adaptiveThreshWinSizeMin=3, adaptiveThreshWinSizeMax=23). The marker detection checkpoint is that the system needs to stably recognize the same marker (confidence>0.95) in a continuous 30-frame video stream before triggering virtual object rendering. When the detection is successful, the marked edge on the screen will display a green border and be accompanied by a brief vibration feedback. The camera calibration uses the built-in CalibrationScript. cs script, which requires a chessboard pattern with 9 × 6 internal corner points and a side length of 2.5 cm. At least 15 frames of the pattern must be presented from different angles within the camera's field of view. The successful calibration standard is an average reprojection error of less than 0.5 pixels. The calibration process should be completed within 2 min. After success, the "Calibration Succeeded" log should be output in the Unity editor console, and the calibrated camera cone should be visualized in the scene. The virtual object rendering adopts Unity's real-time rendering pipeline, with a Standard material shader and lighting model consistent with ambient light.
The experimental procedure mainly includes four steps. First, it wears and adjusts the HoloLens 2 device properly. Second, it places the experimental card with specific AR markings on the desktop. The system camera continuously captures video streams. It calls the aruco.detectMarkers function in OpenCV for tag detection and recognition. Third, after successfully identifying the mark, the system renders the virtual material specimen in the real world according to equations (1)–(4). The coordinate system of the virtual environment ζηξ and the coordinate system of the real environment xyz can be transformed, and the transformation equation is shown in equation (1).
[ xyz1] = [ζηξ1] A (1)
In equation (1), A represents the transformation matrix between two systems, where the real environment xyz and the camera x'y'z' can also be transformed. The change equation is shown in equation (2).
[ x'y'z'1] = [ζηξ1] AB (2)
In equation (2), B represents the transformation matrix between the two coordinate systems. x'y'z' projects the tracked virtual objects into the uv two-dimensional coordinate system, so as to realize the accurate registration of the virtual environment in the real environment. The transformation between the screen coordinates and camera coordinates x'y'z' of the fusion projection of virtual objects and real environments is shown in equation (3).
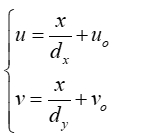 (3)
(3)
In equation (3), dx represents the number of pixels in the axial direction x. dy is the number of pixels in the axial direction y. The geometric relationship between the camera and the image coordinate system projected by the fusion of virtual object and real environment is shown in equation (4) using the similar triangle equation.
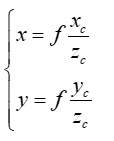 (4)
(4)
By applying force to the virtual specimen through predefined gestures, the system calculates and visualizes the stress distribution and deformation of the specimen in real-time based on equations (5)–(7). The internal force per unit area is stress, as shown in equation (5).
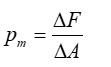 (5)
(5)
In equation (5), F refers to force, A is cross-sectional area, and pm is stress per unit area. The total stress is shown in equation (6).
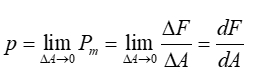 (6)
(6)
In equation (6), p represents the stress component of the total stress, σ is the normal stress, the stress component perpendicular to the section, and τ is the shear stress and the stress component tangent to the section. The normal stress is shown in equation (7).
 (7)
(7)
In equation (7), FN is the axial force and A is the cross-sectional area. Fourthly, data recording and report generation. The key data generated during the experiment is automatically saved in CSV format. It generates a PDF-format experimental report after the experiment, including stress-strain curves and key data summaries. All files are exported to the local directory and named in the format of experiment date+experiment type. The protocol termination steps include data-saving confirmation, device shutdown, software shutdown, and a system status check. After the experiment, the study confirms the end of the application via the "Exit System" button on the main menu, removes the HoloLens 2 device, and shuts it down in accordance with standard operating procedures. Finally, on the development machine, the running mode of the Unity editor is stopped, and all related software windows are closed.
SPSS 26.0 is used for data analysis. Before applying the paired-samples t-test, the normality of the performance improvement differences is first evaluated. The Shapiro-Wilk test is used to analyze all relevant variables. Moreover, the results show that the p-values for all variables are greater than 0.05, indicating that the data conform to a normal distribution and meet the prerequisite for the t-test. The paired-samples t-test is used to compare performance improvement between the experimental and control groups for repeated-measures data, such as satisfaction. Repeated-measures analysis of variance is used to evaluate changes over time. The significance level is set to p<0.05. In addition, to evaluate the magnitude of the effect, Cohen's d value is calculated, where d>0.8 indicates a large effect.
3. Science teaching system construction based on AR technology teaching game
In line with scientific teaching standards, the interactive features of AR technology and teaching systems are used to introduce it into education and unleash its greater potential. AR technology is highly significant in science teaching. First of all, it can concretize and visualize the abstract learning content. The second is to enhance learners' learning experience, so that they have a better sense of participation and concentration. Therefore, it is of great significance to combine the teaching system with a classroom for education. This study's system design is guided by experiential learning and constructivist principles. It aims to transform abstract concepts into tangible, observable visual objects through AR interaction mechanisms and to encourage students to actively construct knowledge. Meanwhile, the technology acceptance model is introduced to evaluate the perceived usefulness and ease of use of the system, thereby measuring its practical application potential.
3.1 Integration of educational games and augmented reality technology
AR technology integrates the virtual and real environments, providing users with a new sensory experience. AR technology first tracks and collects feature points from real scenes, then performs image recognition. The second is to track the picture at the position of the marking map. The angle of the camera and other information are important18. Finally, by perceiving the camera's sensitivity to the environment and overlaying the model, the fusion of virtual and reality can be achieved, achieving an immersive effect. The implementation of AR technology is shown in Figure 1.
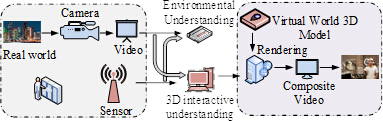
Figure 1: Implementation steps of AR technology. Please click here to view a larger version of this figure.
Educational game is a computer game software integrating the educational function and the entertainment function. It can cultivate the intelligence, skills, knowledge, attitude, and values of game users, and its impact on learners should not be underestimated. AR technology has three basic significant features. First, it accurately integrates virtual and reality, integrates the created three-dimensional scene with the real environment, triggers all the senses of the user, and lets the user experience the real world19. The second is to use modern intelligent devices to achieve intelligent interaction between people and devices. Finally, the computer-generated 3D environment is registered with the actual target in 3D. Users can continue to track real objects without losing them and maintain accurate tracking at all times. The principle of 3D registration technology is shown in Figure 2.
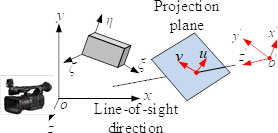
Figure 2: Schematic diagram of 3D registration. Please click here to view a larger version of this figure.
The three-dimensional registration schematic diagram shown in Figure 2, where x'y'z' is camera coordinates, xyz is the specific coordinates of the real environment, ζηξ is the coordinates of the virtual environment, uv is the screen coordinates of the fusion projection of the virtual object and the real environment, and '' o'z' is the direction of the user's line of sight. After homogenization and combination, the calculation is shown in equation (4). The educational significance of 3D registration technology (equations (1)–(4)) lies in its ability to transform abstract virtual coordinate systems into stable and accurate visual overlays on student screens. This technology ensures that virtual models can be effectively attached to real-world marker cards, and the model will not drift or shake when students move their perspective. The direct educational value of this technology lies in its ability to provide students with a stable and trustworthy observation environment. This environment enables students to observe and think about virtual mechanical specimens from any angle. As a result, students cultivate spatial imagination and multi-angle observation ability.
3.2 Demand analysis of science educational games based on AR technology
To achieve the teaching objectives of science, learners need to systematically acquire knowledge, skills, and behavioral experiences. When designing AR educational games, it is necessary to correctly analyze the teaching content20. Selecting appropriate teaching content, integrating it with AR technology, and innovating teaching methods can effectively help learners build a coherent knowledge system. The research object of material mechanics is various materials with different shapes of parts. It mainly studies the strength, stiffness, and stability under different forces. To enhance learners' intuitive visual experience and interactive sense of participation. Therefore, the combination of AR technology and the education system is used to analyze the needs of AR technology in science education games, taking stress-strain analysis as an example. The system provides experimental preparation and simulation for the knowledge points of stress and strain in mechanics, and assists teachers in teaching experiments. The system's users mainly include visitors, students, teachers, and administrators, while its functions include experiment management, experiment upload, interactive experiments, and data visualization. The system is shown in Figure 3.
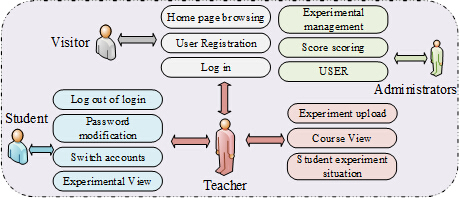
Figure 3: Use case diagram of experimental course completion scoring system. Please click here to view a larger version of this figure.
The integration of AR technology and the education system is shown in Figure 3. This system can ensure that teachers are adequately prepared before the course, master experiments, and manage students during the course. After the experiment, teachers can view and rate students' progress, help manage course data, improve students' experiment completion rates, and assist administrators in managing data on students' experiment results. Therefore, the AR technology teaching system is built on the model-view-controller (MVC) architecture. The data processing mode of this mode is shown in equation (8).
V(s) =max sim(s →f(s)) (8)
In equation (8), V(s) represents the data content displayed by the view layer according to user requirements,sis teaching resources, and f(s) is user information. The operation mode of real-time interaction between diversified teaching system and users is shown in equation (9).
K(s) = si ∩ [f(s1), f(s2),...,ff(sn)] (9)
In equation (9), K(s) represents the business rule of the mode,s1 represents the characteristic parameter of data objects, and f(sn) represents the characteristic parameter of user demand information. Based on the interactive relationship between the AR technology science teaching system and users, the operation mode is shown in equation (10).
g(x) = max K(s) → f(s) (10)
In equation (10), g(x) represents the request object, f(x) is the source of user requirements, and max K(s) is the maximum value of feature similarity. MVC mode consists of five main components: business, controller, persistence, view, and database. The view layer connects users and data through web pages, enabling interaction, and provides the functionality to display web pages. The data layer stores and processes data from the upper layer. The service layer is responsible for meeting user needs and implementing service logic. The AR science teaching system based on MVC mode is shown in Figure 4.
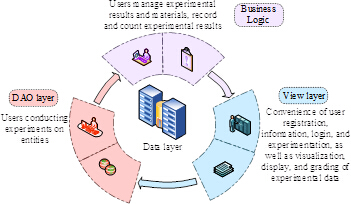
Figure 4: Technical architecture diagram of the science teaching system. Please click here to view a larger version of this figure.
Interacting with the database, the data operation information obtained at the business logic layer is mapped through the persistence layer. The view layer is responsible for displaying the main front-end interface, uploading experimental data, displaying experimental results, and grading experimental reports. The business logic layer is divided into a business layer and a controller, which receives user requests and forwards them to the business logic layer's processor for processing. The technology layer builds the common blocks of multiple objects into separate modules, enabling direct references to the system.
3.3 Teaching system architecture design based on AR technology and science educational game
Science teaching is a two-way process of teaching and learning. To achieve teaching goals, the design of AR educational games should follow the five principles of interactivity, interest, science, easy operation, and education21. Interactivity is the biggest feature of AR technology. The educational game should highlight the advantages of AR technology, enabling learners to have a rich, interactive experience in experiments that activate the classroom atmosphere and improve teaching effectiveness. Educational games are designed with clear teaching objectives and key teaching points to achieve both teaching and learning objectives. Therefore, the teaching system based on AR technology mainly includes six modules, as shown in Figure 5.
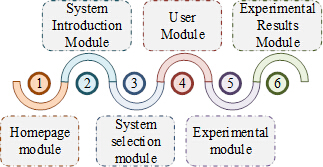
Figure 5: Science Teaching AR teaching system module diagram. Please click here to view a larger version of this figure.
The teaching system module is mainly composed of the system introduction module, user module, experiment module, experiment selection module, home page module, and result statistics module. The experiment introduction module can easily inform users and provide instructions for using the teaching system, including classroom experiment requirements and experimental report requirements. The user module manages users, including account registration, account switching, account logout, and password modification. The experimental selection module uses the touch screen to select the experimental parts. The experimental module performs feature point recognition and feature analysis on the imported experimental pictures. It also adjusts the light difference appropriately for real-world display. The design of the teaching system based on AR technology is closely centered around educational goals. Specifically, the core educational functions of the experimental module and the experimental selection module are to empower students. They can explore independently. The educational significance of the results statistics module lies in providing an objective basis for teachers. Teachers can use it to evaluate learning outcomes. Due to AR's characteristics, it requires use in scenes with appropriate, stable lighting. The gray stretching method can be used to make them evenly distributed, as shown in equation (11).
g(x,y) = [(255 - c)/ b - a] f(x,y) + c (11)
In equation (11), c represents the gray level starting point after correction. a and b respectively represents the gray level starting point and end before correction. In the feature-based tracking method, the core equation is shown in equation (12).
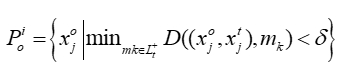 (12)
(12)
In the tracking process, a ridge regression model is selected for linear regression, and a nonlinear regression model is used for training. The Gaussian function is shown in equation (13).
 (13)
(13)
The administrator is in the user scoring module. Under this system, the scoring standard of the experimental course is managed and evaluated by the administrator. Students can view the experimental results and data through the experimental results module. The home page module in the system includes the system introduction, experiment introduction, exit system, and other content. Figure 6 shows the overall system framework.
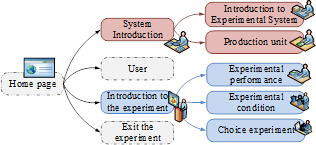
Figure 6: Science teaching AR teaching system architecture homepage module. Please click here to view a larger version of this figure.
The system process in the teaching system is mainly composed of four parts, including the preparation of drawing materials, interactive test optimization, data query and sorting, and the implementation system. It is embodied in the card registration and identification, as well as the identification of the displayed part model. Finally, the stress-strain analysis image of the experimental data is presented, and the mechanical characteristics of materials with different properties in the stress-strain analysis can be obtained. After the experiment, the final experimental report basis can be presented. Therefore, the experimental process of the system is shown in Figure 7.
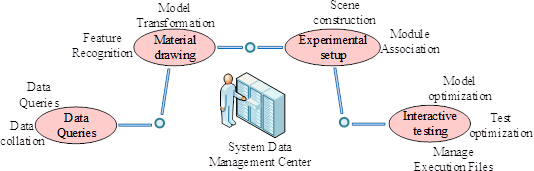
Figure 7: Flow chart of AR teaching system implementation for science teaching. Please click here to view a larger version of this figure.
The overall system architecture includes design technology architecture and the functional modules. The teaching system can help learners improve their self-awareness and exploration, and help educators organize teaching experiments through educational games. Due to the interactivity of the teaching system, learners can utilize the AR teaching system. In the science teaching supported by AR technology, the needs of educators can be met, so that the curriculum teaching of educators can develop teaching content with strong applicability for learners22. Therefore, the teaching content can be optimized, and learners' enthusiasm and creativity in the course can be enhanced to improve the teaching effect.
Access restricted. Please log in or start a trial to view this content.
Results
Evaluation results of educational game experience and learning effectiveness
To verify the scientificity and practicability of the teaching system, the science teaching system developed through an educational game using AR technology is analyzed. To quantify the core performance of the system, technical indicator data is synchronously collected during the experimental process. Under standard experimental conditions (illumination of 300 ± 50 lux), the average tracking success r...
Access restricted. Please log in or start a trial to view this content.
Discussion
With the development of science and technology, the impact of information technology on people's daily lives spans many fields, and the state also makes every effort to promote the deep integration of information technology with education and teaching. AR technology, with real-time interaction and the combination of virtual and real, is popular in the education industry. Tulgar et al. found, through extensive bibliometric analysis, that AR-based mobile learning and gamification have become the focus of recent research
Access restricted. Please log in or start a trial to view this content.
Materials
| Name | Company | Catalog Number | Comments |
|---|---|---|---|
| AR display device | Microsoft | HoloLens 2 | https://www.microsoft.com/en-us/hololens/hardware |
| Computer Vision Library | OpenCV Team | OpenC 4.13.0 | https://opencv.org/releases/ |
| Development engine | Unity Technologies | Unity 2021 LTS | https://unity.com/releases/2021-lts |
| Graphics card | NVIDIA | RTX A2000 | https://www.nvidia.com/content/dam/en-zz/Solutions/design-visualization/rtx-a2000/rtx-a2000-datasheet-us-nvidia-1520552-r3-web.pdf |
| Integrated Development Environment | Microsoft | Visual Studio 2022 | https://visualstudio.microsoft.com/vs/ |
| Operating system | Microsoft | Windows 11 | https://www.microsoft.com/en-us/windows/windows-11 |
| Processor | Intel | Core i9-11950H | https://www.intel.com/content/www/us/en/products/sku/213800/intel-core-i911950h-processor-24m-cache-up-to-5-00-ghz/specifications.html |
References
- John, Y. M., Sanusi, A., Yusuf, I. Reliability analysis of multi-hardware-software system with failure interaction. JCCE. 2 (1), 38-46 (2023).
- Amin, S. N., Shivakumara, P., Jun, T. X. An augmented reality-based approach for designing interactive food menu of restaurant using Android. AIA. 1 (1), 26-34 (2023).
- Bontchev, B. P., Terzieva, V., Paunova-Hubenova, E. Personalization of serious games for learning. Interact Technol SMA. 18 (1), 50-68 (2021).
- Hooshyar, D., Huang, Y. M., Yang, Y. GameDKT: Deep knowledge tracing in educational games. Expert Syst Appl. 196 (6), 2-16 (2022).
- Rahimi, S., et al. The use and effects of incentive systems on learning and performance in educational games. Comput Educ. 165 (2), 2-17 (2021).
- Fan, J., Yang, X., Lu, R., Li, W., Huang, Y. Long-term visual tracking algorithm for UAVs based on kernel correlation filtering and SURF features. Visual Comput. 39 (1), 319-333 (2023).
- Mathews, A., Sejal, N., Venugopal, K. R. Analysis of content based image retrieval using deep feature extraction and similarity matching. IJACSA. 13 (12), 646-655 (2022).
- Yang, M., Li, D. Personalized intelligent recommendation model for educational games based on data mining. Inf Technol Control. 54 (1), 64-83 (2025).
- Sun, L., Guo, Z., Hu, L. Educational games promote the development of students' computational thinking: A meta-analytic review. Interact Learn Envir. 31 (6), 3476-3490 (2023).
- Udeozor, C., Toyoda, R., Russo Abegão, F., Glassey, J. Digital games in engineering education: Systematic review and future trends. Eur J Eng Educ. 48 (2), 321-339 (2023).
- Martinez, L., Gimenes, M., Lambert, E. Entertainment video games for academic learning: A systematic review. J Educ Comput Res. 60 (5), 1083-1109 (2022).
- Gordillo, A., López-Fernández, D., Tovar, E. Comparing the effectiveness of video-based learning and game-based learning using teacher-authored video games for online software engineering education. IEEE T Educ. 65 (4), 524-532 (2022).
- Lytvynova, S. H., Soroko, N. V. Interaction in an educational environment with virtual and augmented reality. Inf Technol Learn To. 98 (6), 13-30 (2023).
- lvarez-Marín, A., Velazquez-Iturbide, J. A. Augmented reality and engineering education: A systematic review. IEEE T Learn Technol. 14 (6), 817-831 (2022).
- de Moraes Rossetto, A. G., et al. An analysis of the use of augmented reality and virtual reality as educational resources. Comput Appl Eng Educ. 31 (6), 1761-1775 (2023).
- Radu, I., Schneider, B. How augmented reality (AR) can help and hinder collaborative learning: A study of AR in electromagnetism education. IEEE T Vis Comput Gr. 29 (9), 3734-3745 (2022).
- Kleftodimos, A., Moustaka, M., Evagelou, A. Location-based augmented reality for cultural heritage education: Creating educational, gamified location-based AR applications for the prehistoric lake settlement of Dispilio. Digital. 3 (1), 18-45 (2023).
- Cheng, C. K., et al. PROBE2.0: A systematic framework for routability assessment from technology to design in advanced nodes. IEEE TCAD. 41 (5), 1495-1508 (2022).
- Syama, S., Mohanan, P. V. Microfluidic-based human-on-a-chip: A revolutionary technology in scientific research. Trends Food Sci Tech. 110 (4), 711-728 (2021).
- Fan, W. Development path of basic education based on 5G technology and multimedia embedded system. Microprocess Microsy. 82 (8), 2-7 (2021).
- Almousa, O., et al. Virtual reality technology and remote digital application for tele-simulation and global medical education: An innovative hybrid system for clinical training. Simulat Gaming. 52 (5), 614-634 (2021).
- Usman, A. M., Abdullah, M. K. An assessment of building energy consumption characteristics using analytical energy and carbon footprint assessment model. GLCE. 1 (1), 28-40 (2023).
- Tulgar, A. T., Yılmaz, R. M., Topu, F. B. Research trends on the use of augmented reality technology in teaching English as a foreign language. Per. 9 (5), 76-104 (2022).
- Nikimaleki, M., Rahimi, M. Effects of a collaborative AR-enhanced learning environment on learning gains and technology implementation beliefs: Evidence from a graduate teacher training course. J Comput Assist Learn. 38 (3), 758-769 (2022).
Access restricted. Please log in or start a trial to view this content.