PreventativeTestPro is an AI-driven testing framework that utilizes observability data and large language models to automate root cause analysis, test generation, and continuous validation, with the objective of improving software reliability and optimizing quality assurance for both frontend and backend systems to facilitate more efficient support ticket management.
A subscription to JoVE is required to view this content. Sign in or start your free trial.
Research Article
PreventativeTestPro: A Scalable Hybrid Testing Framework Utilizing Observability and Generative AI for Proactive Software Quality Engineering
In This Article
Summary
Abstract
This paper introduces a sophisticated, scalable testing system that integrates observability-driven automation with AI-augmented proactive quality engineering to tackle contemporary software delivery difficulties. The suggested system enhances PreventativeTestPro, an open-source, hybrid testing platform that combines black-box and white-box methodologies, by incorporating an innovative observability-based test orchestration layer. The platform utilizes logs, metrics, events, and traces alongside browser and server-side monitoring to promptly identify anomalies, enhance test case selection, and automate the creation of functional, performance, and security test suites. A distinctive characteristic is the incorporation of large language models (LLMs) to provide root cause insights and autonomously construct new test cases based on production behaviors and identified abnormalities, thus providing adaptive regression coverage and intelligent remediation.
The system facilitates concurrent test execution with instantaneous AI-driven log analysis, fostering a continuous feedback loop between operations and testing. It has been validated in several enterprise scenarios, including microservices-based SaaS platforms and SAP BTP ecosystems. Empirical findings from four production deployments and a beta group of 49 engineers indicate a decrease of up to 30% in mean time to resolution, over 95% compliance with SLAs, and substantial improvements in both test coverage and defect traceability. The effortless connection with industry-standard tools illustrates its plug-and-play capability.
This research presents a comprehensive, tool-independent, and forward-looking quality engineering methodology consistent with agile and DevOps principles. Future endeavors encompass dynamic anomaly classification through machine learning, extension to mobile and user experience-oriented systems, and augmented large language model capabilities for domain-specific test development and failure forecasting.
Introduction
The increasing popularity of the agile paradigm in software businesses has led to a growing interest in continuous integration environments. The advantages of such systems encompass the seamless integration of regular program modifications, resulting in accelerated and cost-effective software evolution. Consequently, it will efficiently manage duties like building procedures, test execution, and test result reporting. Software testing has been implemented since the inception of software engineering. The practice of software testing was implemented to assess the quality of software1. Testing encompasses a range of actions aimed at detecting and resolving any potential errors in software prior to its deployment to end-users. Software testing is a costly stage in development process2. The cost of software testing and debugging accounts for more than 50 percent of the total development cost3,4. The expense associated with regression testing is contingent upon the intricacy of the application and the magnitude of the test suite5.
Agile methodology leads to rapid changes being implemented in production, which in turn results in a high number of support issues due to feedback. Managing support difficulties is a very significant and critical responsibility, as evidenced by the fact that 68% of consumers express their willingness to pay a premium for products and services from a business renowned for providing excellent customer service6. According to a study, 86% of customers who receive outstanding customer service are more likely to become loyal advocates for the business in the long run7. According to a study, 89% of buyers are more inclined to make repeat purchases if they had a favorable customer service experience8. According to a study, 93% of customers are inclined to make repeat purchases with firms that provide exceptional customer service9. To provide excellent customer service, it is essential to promptly and effectively resolve support requests with a high level of quality. The quality element is crucial when aiming for speedier delivery, as the cost of resolving support issues rises with time and escalation level10.
To get high quality, it is necessary to locate and address support problems while ensuring comprehensive test coverage for regression testing on the ticket. This duty is intricate and has resulted in an increase in operational difficulties, namely in promptly detecting and resolving support issues. Support difficulties, encompassing a wide variety of problems such as decreased system performance or unforeseen malfunctions, frequently arise during the operational stage of software systems. If these difficulties are not swiftly discovered and rectified, they can result in substantial periods of inactivity, consumer discontent, and financial setbacks. The current methods of utilizing observability information for testing needs are frequently constrained by manual procedures, responsive rather than proactive tactics, and a deficiency in integrating anomaly detection with test execution. There is a clear lack in the proactive detection of support issues using real-time observability data and the automatic execution of appropriate test cases to prevent probable failures in advance.
The absence of a comprehensive, unified solution results in many detrimental consequences for software maintenance and dependability. These factors encompass extended periods of system inactivity caused by the delayed identification of problems, heightened manual labor in locating pertinent test cases, and diminished trust in the system's reliability. Moreover, the failure to accurately associate identified abnormalities with test cases leads to deficiencies in test coverage, which may result in unresolved important problems.
The fundamental reason for this disparity may be attributed to the fragmented structure of existing monitoring and testing systems. Many current systems lack the capacity to smoothly integrate observability data analysis with the execution of pertinent test cases. Moreover, the dependence on fixed regulations and human procedures for associating irregularities with test cases obstructs the capability to promptly and precisely resolve new problems.
To get insight into how the industry handles support issues and conducts preventative testing, we conducted a descriptive research study by interviewing professionals in the field11. Based on the interview data, it has been emphasized that the greatest obstacle encountered during the implementation of any solution is the insufficient time to guarantee quality. During the interview, several concerns were noted, including upskilling of individuals, maintenance expense, low return on investment, and tool selection and integration11. This information has also been verified in Katalon's "The State of Quality Report 2024"12.. Prior to providing any solutions for the issues mentioned in the interviews, we conducted a comparative assessment of tools to see whether there are existing tools or algorithms that address the noted concerns13,14. We now lack the necessary tools or algorithms specifically designed to address the difficulties discussed in the interviews.
This work introduces an innovative method that utilizes observability data to detect support issues at an early stage (even before they are reported) and perform appropriate test cases, thus improving the dependability and robustness of software systems. This strategy is based on utilizing observability data to identify abnormalities, establish connections with probable problems, and initiate the execution of targeted test cases that are highly likely to reveal the underlying cause of the issue. The suggested solution intends to close the divide between software operations and testing, allowing for a proactive and fast response to support concerns. The proposed solution allows the creation of new test cases if the test cases are missing from the suite, thus improving the test coverage. The suggested strategy also aims to address the concerns raised in the interviews and in the report by Katalon11,12,13,14.
Observability, in the context of control theory, refers to the extent to which the internal states of a system may be deduced from its exterior outputs. In the field of software engineering, the idea of observability refers to the capability of monitoring and comprehending the condition of a software system by utilizing outputs such as logs, metrics, traces, and events15,16,17. Our literature analysis includes an examination of observability and its use in software testing. However, we found limited available literature on this topic. Therefore, we have also included discussions on innovative preventative tests and related research. Our literature review is further categorized into 3 different groups.
Bogatinovski et al.18 present CLog, a context-aware neural network and clustering technique designed to address unstable log data and insufficient failure coverage by identifying significant subprocesses and detecting failures amid sudden context transitions. Busby et al.19 propose a log-based methodology for generating anonymized test cases, predicting user sequences for replication devoid of personal data; however, concurrency and logger level variations persist as significant constraints. Lee and Kang20 suggest implementing a test architecture for software product line testing to improve observability and controllability in the presence of variability mechanisms. The QEX model21 combines data from different testing sources to give clear, useful information while tests are being made. Lal and Kumar22 stress the importance of being able to see and control intelligent testing. They suggest using AI-powered automation to make testing faster, more efficient, and more thorough. Briand et al.23 illustrate the application of aspect-oriented programming in Java for the effective instrumentation of contracts and invariants, whereas Baral and Offutt24 emphasize the problem of erroneous test assertions that result in "blind tests," which do not identify incorrect behavior.
Rott25 discusses that the modern analyses and visualizations within Teamscale emphasize the software testing process by allowing the testers to access the processed artifacts specific to the issues and situation required. Collins and Lucena26 stress the importance of running a lot of tests in the CI pipeline before deploying to production. They say that layered testing is a good way to make sure the product is of high quality and cut down on support issues.
BugSwarm27 offers a method for examining CI test failures by correlating root causes with their respective solutions. Dudila and Letia28 examine white-box and black-box testing methodologies, suggesting a cohesive strategy to mitigate debugging efforts during the development process. Fushihara et al.29 investigated "test smells" in Python applications, analyzing their progression through code modifications to enhance test code management. SUPERNOVA30 is a system for selecting tests and preventing faults that use data, automation, and machine learning to improve quality assurance. Araujo31 proposes a maintenance strategy focused on software aging. This strategy uses corrective maintenance when code changes are possible and preventative strategies when changes could cause system downtime, which lowers the number of service failures. Andrew et al.32 investigate parallelized mutation testing, a process in which classes are repeatedly mutated, tested, and reloaded until all variants have been assessed. Dunn et al.33 propose security vulnerability metrics that allocate weights to components to emphasize the importance of thorough testing. Lastly, Huo et al.34 use a sequential set index to find defect locations and confirm problems. This shows that root causes are often linked to most of the failed test cases in software applications.
Access restricted. Please log in or start a trial to view this content.
Protocol
System architecture and prototype summary:
This research presents an improved and adaptable prototype system, PreventativeTestPro, that exemplifies a proactive quality engineering approach utilizing observability data and large language models (LLMs) to further improve support issue resolution. The system seeks to tackle modern software delivery issues by automating anomaly detection, root cause analysis, and the intelligent execution and development of test cases for unaddressed coverage using synthetic monitoring, observability data, and GenAI integration. The architecture is modular and comprises three core components: Observability Data Collector and Analyzer, GenAI-Driven Intelligence Layer, and Test Orchestration and Execution Engine, as specified in detail in Figure 1.
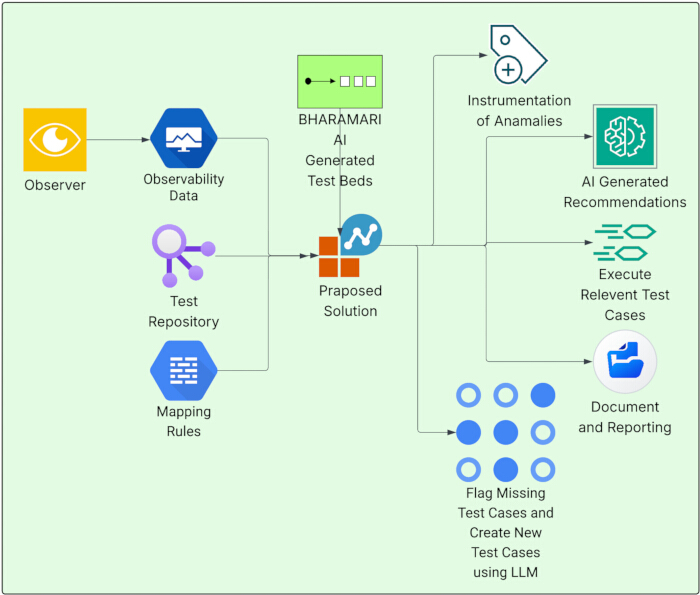
Figure 1: The input-output of the proposed system. Observability data, along with observer output, test repository, and mapping rules, are provided as input alongside BHRAMARI test beds, which construct AI-driven test beds to enhance the robustness of test cases. The proposed system generates instrumentation of anomalies, AI-generated recommendations, execution of pertinent test cases, documentation and reporting, as well as the identification and creation of missing test cases. Please click here to view a larger version of this figure.
Figure 2 displays the architecture of the suggested approach. The figure illustrates the input, processing, and output of the system. It also provides a comprehensive depiction of the system, which is then translated into an explanation to enhance comprehension of the underlying features.
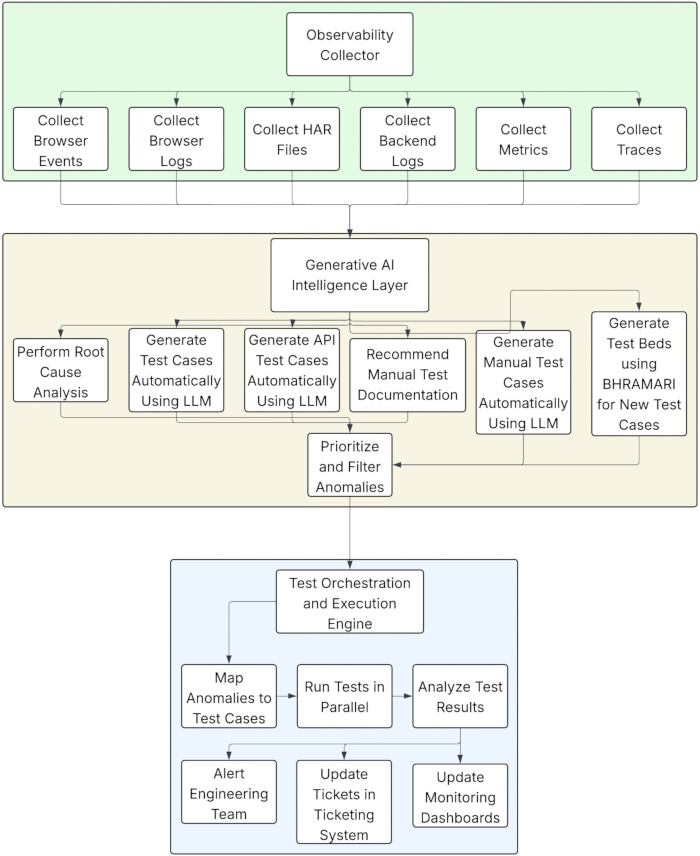
Figure 2: System architecture of the proposed system with observability data collector and analyzer, GenAI-driven intelligence layer, and test orchestration and execution engine. This figure illustrates the internal architecture of the PreventativeTestPro system, segmented into three layers: The Observability Collector Layer aggregates data from multiple sources, including browser events, logs, HAR files, backend logs, metrics, and traces.The Generative AI Intelligence Layer utilizes this data to perform root cause analysis, prioritize anomalies, and autonomously create test cases (UI, API, manual) and documentation through the usage of LLMs. The BHARAMARI module also establishes new test beds. Test Orchestration and Execution Engine maps discrepancies to test cases, executes tests concurrently, evaluates outcomes, and informs engineering teams, ticketing systems, and dashboards for real-time oversight and resolution monitoring. Please click here to view a larger version of this figure.
The Observability Data Collector and Analyzer module serves as a sensory system of the platform, continuously gathering data of the application under assessment on a large scale, with multiple aspects. In the case of frontend monitoring, synthetic monitoring agents are deployed to monitor browser-side events, such as Document Object Model (DOM) structures, user actions, such as clicks, hovers, and inputs, and HAR files capturing network and API request and response information. PreventativeTestPro is also built in with OBSERVER to increase the capability of browsers. Backend monitoring targets log analysis, in which server-side observability information is requested and processed, which includes application logs, error, informational, and debug messages, stack trace and exception logs, performance metrics such as response times, and tracing using technologies like OpenTelemetry or New Relic. The system will work with synthetic agents that simulate user traffic and interaction, and log collectors condense incoming real-time data. The gathered data are then normalized to structured formats and handed to other processing units to be further analyzed.
The essence of PreventativeTestPro is a GenAI-Driven Intelligence Layer that uses Large Language Models (LLMs) such as GPT to read and analyze observability data and contextualize and generate responses. The module undertakes root cause analysis: the process of interpreting root cause logs and traces to explain technical faults in terms that can be understood, such as a NullPointerException on a particular line of code and the assumed cause of the issue, such as an uninitialized variable. In test case generation, the system uses auto-tests that are generated by converting exception patterns or a sequence of events into executable test scripts, e.g., Selenium or API tests, but also produces human-readable test procedures that Quality Assurance staff can run. The API tests have evolved via the transformation of HAR and trace logs into a sequence of API requests with the expected assertions, and all of the generated test cases are further enhanced with effective test beds by integrating with BHRAMARI. Further improvements, test coverage enhancements, and CI/CD integration opportunities are suggested in the recommendation system, depending on the analyzed system behavior. The AI Engine uses structured observability data via prompt engineering and context enrichment to present log context with prompt templates that pass structured queries to the LLM, and finally generates output in functional form, such as code snippets, test case specifications, and natural language documentation.
The Test Orchestration and Execution Engine module handles test priority, scheduling, and execution, enabling automated validation based on code change coverage details, tags, and anomaly mapping. The mapping and selection of the test involves associating anomalies in maps or instrumentation patterns with known test cases using a Mapping Rules Engine, and then running the test cases in accordance with the established mapping. The features of concurrent test execution allow running numerous types of tests simultaneously, such as functional, performance, or security tests in different environments and coordinating the use of Selenium, JMeter, and ZAP as instruments in the automation pipelines. The feedback loop implementation makes sure that the results of executions are logged, and in case of test failure, changes are communicated to support systems, including Jira and Azure DevOps, to track and resolve them.
Hypothesis:
H1 (Operational Efficiency): It is posited that the amalgamation of observability data and AI-driven intelligence will enhance operational metrics, particularly by decreasing mean time to resolve (H1a), mean time to analyze (H1b), mean time to detect production issues (H1c), and mean time to deploy fixes in production (H1d). These changes should make it easier to meet Service Level Agreement (SLA) requirements (H1e) by speeding up detection, analysis, and deployment while keeping system downtime to a minimum.
H2 (Testing Effectiveness): It is also believed that the effectiveness of software testing will improve with more test coverage (H2a), running test cases in parallel (H2b), and smart test prioritization (H2c). AI-generated recommendations (H2d) are also expected to help with both testing and operational workflows. This will help find bugs faster, speed up feedback loops, and support quality assurance practices that are preventative and long-lasting.
Scope and audience:
This prototype shows the overall system design, the main idea, and how to set up and run the PreventativeTestPro framework step by step. It also goes into detail about how to set up the right test beds/sample inputs and gives tips on how to fix problems. The content is for software quality engineers who already know the basics of Java and want to learn how to use preventative testing to make software more reliable and efficient.
Environment setup:
Supplementary File 1 contains a step-by-step description and program required in communicating with the PreventativeTestPro. This includes instructions for installing the necessary environment, how to start and stop the tool's services, and a clear explanation of the tool's fundamental usage. To obtain a more detailed documentation, along with instructions on how to use advanced tools, setup instructions, and other organizational details, refer to the official GitHub sources dedicated to the project: the specific Wiki page at the location of the https://github.com/sohambpatel/PreventativeTests/wiki and the main README at https://github.com/sohambpatel/PreventativeTests?tab=readme-ov-file/readme.
Sample inputs:
The sample input files can be found in the GitHub repository: https://github.com/sohambpatel/PreventativeTests/tree/main/preventativetestframework/Inputs. The framework can run these files' pre-set test cases and datasets right away. They are used as reference inputs to check the environment setup and to get the same results that are described in this protocol.
Sample outputs:
The GitHub repository (https://github.com/sohambpatel/PreventativeTests/tree/main/preventativetestframework/SampleOutputs) contains concrete samples of the preventative test framework's output data in raw format. Through these files, users can view the layout and details of the generated reports and metrics directly, demonstrating the outcomes the tool achieved during its operation. This guide is relevant to knowing the data pipeline and confirming the anticipated framework behavior under recreating the experimental process.
Execution prototype:
This section gives a detailed, step-by-step guide on how to use the PreventativeTestPro framework. To help users reproduce the workflow, each stage is described in order. This section presents the execution steps in a structured format to make it easier to reproduce results, point out important checkpoints, and ensure that the PreventativeTestPro framework can be used consistently across different experimental or operational settings.
In this step, PreventativeTestPro GUI can be used to choose the best preventative testing workflow. Figure 3 shows five choices, each of which stands for a different step in the testing process: running tests in parallel, creating the test suite from monitoring output by prioritizing existing test cases, creating manual test cases, creating automated test cases, and finding the root cause. When the user makes a choice, the designated workflow starts. After that, additional modes (such as AI-driven test case generation or root cause analysis) can be added in later stages. This well-organized interface provides a way to do preventative testing studies that can be repeated and broken down into smaller parts.
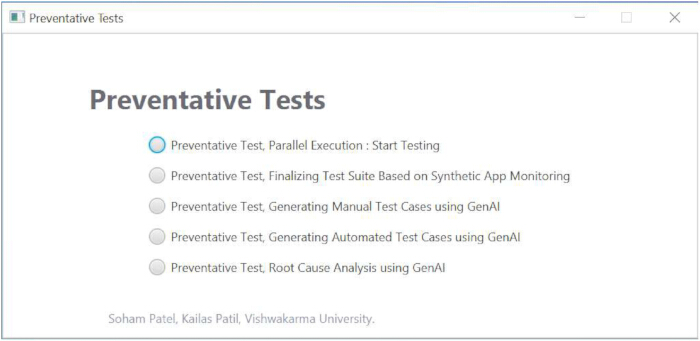
Figure 3: User interface 1 of the system. This figure shows the PreventativeTestPro user interface, which lets one choose from five different ways to do preventative testing: 1. Preventative Test, Parallel Execution: Start Testing, 2. Preventative Test, Finalizing Test Suite Based on Synthetic App Monitoring, 3. Preventative Test, Generating Manual Test Cases using GenAI, 4. Preventative Test, Generating Automated Test Cases using GenAI, 5. Preventative Test, Root Cause Analysis using GenAI. Only one option can be chosen at a time. The modular design makes it easier to do preventative testing and adds AI-powered test creation and diagnostics. Please click here to view a larger version of this figure.
Figure 4 shows the framework's Parallel Execution interface. In this step, the user enters the URL of the application they want to test and the absolute path to the properties file that has the configuration settings. After the inputs are set, the user can start running tests at the same time by clicking the Start Testing button, which also monitors the website under test and generates the security, performance, console, and JavaScript logs. One can stop the ongoing execution by clicking the Stop Testing button. The Get Recommendation button lets one get AI-driven insights from the logs recorded. This design makes sure that multiple test categories (functional, performance, and security) run at the same time, which makes it easier to find problems more quickly.
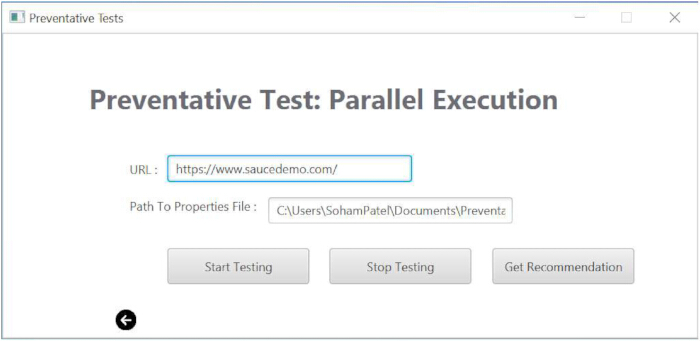
Figure 4: User interface 2 of the system. This figure shows the Parallel Execution mode of the PreventativeTestPro framework. The user specifies the target application URL and the path to a properties file containing configuration details. Options include Start Testing (to run functional, security, and performance tests in parallel and record the logs), Stop Testing (to stop execution), and Get Recommendation (to get AI-driven insights from logs and metrics). Please click here to view a larger version of this figure.
Figure 5 shows the Monitoring based Test Finalization interface of the PreventativeTestPro framework. In this step, the user sets the path for the monitoring output file, the JSON path query to get error or exception nodes, and the test repository path to save the cases that were created. After the inputs are set, the user can first get the names of the class and method that go with them and then sort the test cases from the test pull based on the class and method that were found. This step of prioritization shows how to use monitoring data to effectively rank the test cases.
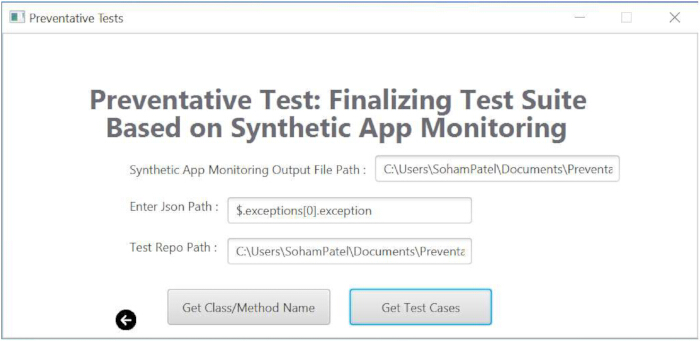
Figure 5: User interface 3 of the system. This figure shows how to prioritize a test suite in the PreventativeTestPro framework using synthetic monitoring outputs. The user types in the path to the monitoring output file, the JSON path to get exceptions/errors, and the path to the test repository(offline). The Get Class/Method Name and Get Test Cases options can be used to turn mapping anomalies into test cases that one can run. This makes sure that runtime problems are included in the testing process. Please click here to view a larger version of this figure.
Figure 6 shows the Manual Test Case Generation interface of PreventativeTestPro. In this step, the user tells the program where to find the stack trace file that shows the anomaly by providing the absolute path to the stack trace file and the path to the configuration properties file. Once the inputs are set, one can run the Generate Test Cases option, which will turn the anomaly into structured manual test cases. This makes sure that runtime errors that have happened before are always included in the testing process. The framework makes it easier to create test cases by automating the process. This cuts down on manual work, improves test coverage and makes tests more reliable, and stops the same problem from happening again. This step is a very important link between finding problems and making sure quality is good before it happens.
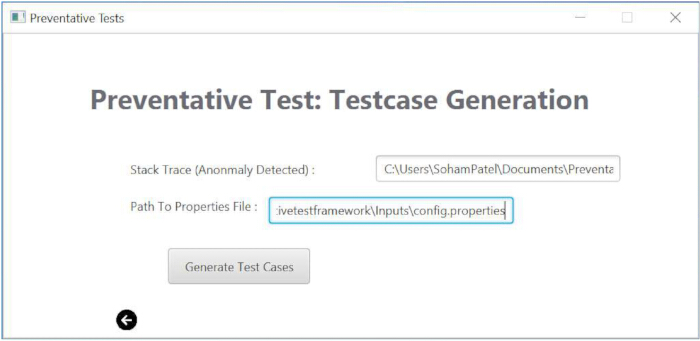
Figure 6: user interface 3 of the system. This figure shows the test case generation interface of PreventativeTestPro. It turns anomaly stack traces into manual test cases in the Behavior Driven Development (BDD) that can be used. The user gives the paths to the stack trace file and the properties file and then clicks "Generate Test Cases" to automatically make cases that match the failure that was found. This makes sure that runtime problems are always turned into regression tests that can be repeated. Please click here to view a larger version of this figure.
Figure 7 shows PreventativeTestPro's Automated Test Case Generation interface. In this step, the user gives the absolute path to the observability JSON output file and the path to the property's configuration file. When the Generate Automated Test Cases button is clicked, the system processes the monitoring data and makes test cases that can be run to show the same problems that were seen.
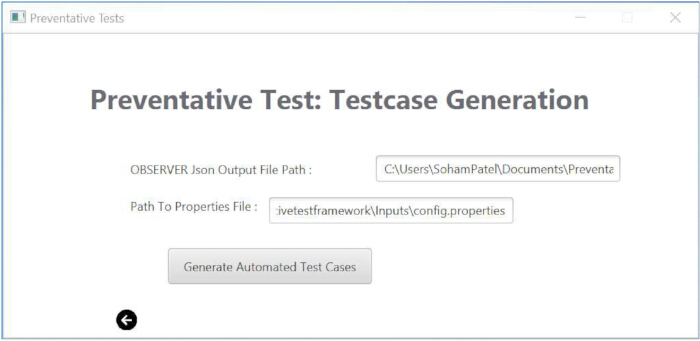
Figure 7: User interface 4 of the system. This figure shows the automated test case generation interface of PreventativeTestPro, which makes tests that can be run using observability data. The user gives the path to the properties file and the observability JSON output file. Then, they click "Generate Automated Test Cases" to make scripts that can be run (in Selenium and TestNG format). Please click here to view a larger version of this figure.
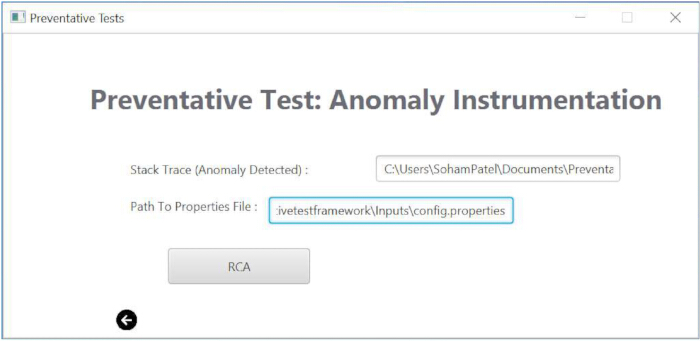
Figure 8: User interface 5 of the system. This figure shows the anomaly instrumentation interface of PreventativeTestPro for Root Cause Analysis (RCA). The user gives the path to the properties file and the stack trace file, then chooses RCA to start AI-driven analysis. This step changes detected anomalies into structured diagnostic insights, which ensures that faults can be fixed in a way that can be repeated and is specific to the problem. Please click here to view a larger version of this figure.
Troubleshooting:
Table 1 shows the most important troubleshooting points that are only about the application code. These points are a quick way to remember how to fix code-level issues that arise when running the PreventativeTestPro framework. The project documentation provides more information and step-by-step instructions for readers who want more help troubleshooting issues affecting the application's overall functionality. The full resource can be obtained from the link: https://github.com/sohambpatel/PreventativeTests/wiki/How-to-use%3F. This extra reference ensures that users not only fix coding problems but also learn how to troubleshoot functions, enabling them to use the framework more effectively.
| Error Behavior | Root Cause | How to Fix? |
| Application is not starting | Java Path is not set | In the Environment variable, set the JAVA_HOME |
| Server fails on startup | Port 8080/9090 in use (Specifically while using Docker) | Update Docker port mapping |
| GenAI content is null | Token may have expired | Generate the token and update the config.properties before you provide that as an input |
| Browser instance generated by the framework is not connecting to the network | Either ZAP server is not running or ZAP credentials are incorrect | Turn ON the ZAP before running the application, in case it is running and problem still persist, update the ZAP credentials in the config.properties before you provide that as an input |
Table 1: Common proposed system errors and quick fixes. This table shows the common application-specific errors, troubleshooting, and quick fixes that can be applied to fix the issues.
Access restricted. Please log in or start a trial to view this content.
Results
Initially, we shared the outcomes derived from the case studies conducted in collaboration with various industries in real-time. Furthermore, we have provided the outcomes derived from the beta testers who have utilized this framework and algorithm, together with the final observations on potential risks to the validity of the results.
Industry case study results:
Based on our research, which focuses on practical applications and addresses support c...
Access restricted. Please log in or start a trial to view this content.
Discussion
This research presents PreventativeTestPro, a comprehensive testing and observability platform that integrates synthetic monitoring, observability data, and generative AI-driven automation to improve software quality assurance. The system consists of three fundamental modules: an observability data collector and analyzer, a generative AI-driven intelligence layer, and a test orchestration and execution engine. Collectively, these components establish a feedback loop in which real-time system behaviors guide test case pro...
Access restricted. Please log in or start a trial to view this content.
Disclosures
The authors declare that they have no known competing financial interests or personal relationships that could have appeared to influence the work reported in this paper. We attest that Gemini was only applied regarding grammatical polishing and re-wording of sentences to make them easier to read. To be correct and ethically right, the authors carefully revised all the changes suggested by AI to preserve the original scientific connotation.
Acknowledgements
The author expresses gratitude for the significant support and collaboration provided by the following organizations throughout this research. The collaborative experimental case studies with these companies were crucial in substantiating the proposed tool and method. Gratitude is extended to GazonTech, Lopa Engineering, Afour Technologies, QJ Technologies, and SecureLayer7 for granting access to practical surroundings, technical insights, and valuable input during the experimental phase. Their active involvement greatly enhanced the practical significance and usability of the research findings. The author expresses profound gratitude for their readiness to participate in academic research and their dedication to innovation and ongoing enhancement in the fields of software engineering and cybersecurity.
Access restricted. Please log in or start a trial to view this content.
Materials
| Name | Company | Catalog Number | Comments |
|---|---|---|---|
| Apache Maven | Apache Software Foundation | 3.9.6 | Dependency and project management tool for Java projects |
| ChatGPT (GPT-3.5 Turbo API) | OpenAI | https://platform.openai.com/api-keys | For generating AI-based test recommendations from logs, generating the manual test cases, generating the automated test cases and getting the root cause analysis |
| Computer (Development/Test Machine) | Standard Desktop/Laptop | - | Used for developing, executing, and testing PreventativeTestPro |
| Disk Space | - | - | At least 10 GB of free disk space recommended for logs, reports, and test artifacts |
| Docker | Docker Inc. | 27 (https://docs.docker.com/desktop/setup/install/windows-install/) | Used for containerization to ensure reproducibility across environments |
| Git | Git SCM | git version 2.45.2.windows.1 | Version control system used for development and collaboration |
| GitHub Repository | GitHub | https://github.com/sohambpatel/PreventativeTests | Public repository containing source code, documentation, datasets, and examples |
| Google Chrome | 140.0.7339.128 | Primary browser used for synthetic monitoring and testing | |
| Java | Oracle / OpenJDK | 21.0.2 | Used for software development and execution of PreventativeTestPro |
| Operating System | Platform Independent | - | Tool works on any OS with Java and Maven installed (Windows, Linux, macOS) |
| OWASP ZAP | OWASP Foundation | 2.14.0 | Security scanning and vulnerability detection tool |
| Processor | - | - | Intel i5 or higher (or equivalent) recommended for parallel execution and AI processing |
| RAM | - | - | Minimum 8 GB RAM recommended for running tests and browser-based monitoring |
References
- A novel approach to multiple criteria based test case prioritization. Abid, R., Nadeem, A. 2017 13th International Conference on Emerging Technologies (ICET), Islamabad, Pakistan, , (2017).
- Khatibsyarbini, M., Isa, M. A., Jawawi, D. N., Tumeng, R. Test case prioritization approaches in regression testing: A systematic literature review. Inf Softw Technol. 93, 74-93 (2017).
- Enhanced weighted method for test case prioritization in regression testing using unique priority value. Ammar, A., Baharom, S., Ghani, A. A. A., Din, J. 2016 International Conference on Information Science and Security (ICISS), Pattaya, Thailand, , (1109).
- Using artificial bee colony for code coverage based test suite prioritization. Konsaard, P., Ramingwong, L. 2015 2nd International Conference on Information Science and Security (ICISS), Seoul, Korea, 10, Forthcoming.
- Rosero, R. H., Gómez, O. S., Rodríguez, G. Regression testing of database applications under an incremental software development setting. IEEE Access. 5, 18419-18428 (2017).
- Customer Service Expectations 2018. , Gladly. Available at: https://www.gladly.com/blog/2018-customer-service-expectations-survey/ (2018).
- Must-Know Customer Service Statistics. , Khoros. Available at: https://khoros.com/blog/must-know-customer-service-statistics (2025).
- State of the Connected Customer, 4th Ed. , Salesforce. Available at: https://c1.sfdcstatic.com/content/dam/web/en_us/www/documents/research/salesforce-state-of-the-connected-customer-4th-ed.pdf (2025).
- Customer Acquisition Study. , HubSpot. Available at: https://blog.hubspot.com/service/customer-acquisition-study (2025).
- IT Ticket Handling Best Practices. , Ivanti. Available at: https://www.ivanti.com/blog/it-ticket-handling-best-practices (2025).
- Patel, S., Patil, K., Chumchu, P. Quantitative data set on test prioritization and preventative tests. Mendeley Data. V2, (2023).
- State of Software Quality Report 2024. , Katalon. Available at: https://katalon.info/hubfs/download-content/ebook/State%20of%20Software%20Quality%20Report%202024.pdf (2025).
- Patel, S., Patil, K., Chumchu, P. OBSERVER: Observing Browser Synthetic Environments for Robotization, Verification, Efficiency, and Resilience. Softw Impacts. 24, 100752(2025).
- Patel, S., Patil, K., Chumchu, P. Comparative analysis of software solutions for preventative testing and test prioritization. Mendeley Data. V2, (2024).
- Intro to Synthetic Monitoring . , New Relic. Available at: https://docs.newrelic.com/docs/synthetics/synthetic-monitoring/using-monitors/intro-synthetic-monitoring (2025).
- Observability Glossary. , SolarWinds. Available at: https://www.solarwinds.com/resources/it-glossary/observability (2025).
- Patel, S., Patil, K., Chumchu, P. BHRAMARI: Bug driven highly reusable automated model for automated test bed generation and integration. Softw Impacts. 21, 100687(2024).
- Failure identification from unstable log data using deep learning. Bogatinovski, J., Nedelkoski, S., Wu, L., Cardoso, J., Kao, O. 2022 22nd IEEE International Symposium on Cluster, Cloud and Internet Computing (CCGrid), Taormina, Italy, , (2022).
- Creating test cases for testing software using anonymized log data. U.S. Patent. , US11709764B2. USPTO (2023).
- Towards test architecture based software product line testing. Lee, J., Kang, S. 2014 IEEE 38th Annual Computer Software and Applications Conference (COMPSAC), Vasteras, Sweden, , (2014).
- QEX: Automated testing observability and QA developer experience framework. Locke, H. L., Ting Keshia, Y. K., Yu, J. C. K., Chua, H. Y. 2023 IEEE Conference on Software Testing, Verification and Validation (ICST), Dublin, Ireland, , (1109).
- Intelligent testing in software industry. Lal, A., Kumar, G. 2021 12th International Conference on Computing Communication and Networking Technologies (ICCCNT), Kharagpur, India, , (2021).
- Instrumenting contracts with aspect-oriented programming to increase observability and support debugging. Briand, L. C., Dzidek, W. J., Labiche, Y. 2005 21st IEEE International Conference on Software Maintenance (ICSM), Budapest, Hungary, , (1109).
- An empirical analysis of blind tests. Baral, K., Offutt, J. 2020 IEEE 13th International Conference on Software Testing, Validation and Verification (ICST), Porto, Portugal, , (1109).
- Rott, J. Test intelligence: How modern analyses and visualizations in Teamscale support software testing. 2022 1st International Workshop on Visualization in Testing of Hardware, Software, and Manufacturing (TestVis), Oklahoma City, OK, USA, , (2022).
- Collins, E. F., de Lucena, V. F. Software test automation practices in agile development environment: An industry experience report. 2012 7th International Workshop on Automation of Software Test (AST), Zurich, Switzerland, , (2012).
- BugSwarm: Mining and continuously growing a dataset of reproducible failures and fixes. Tomassi, D. A., Dmeiri, N., Wang, Y., Bhowmick, A., Liu, Y. C., Devan, P. T. 2019 IEEE/ACM International Conference on Software Engineering (ICSE), Montreal, Canada, , (2019).
- Towards combining functional requirements tests and unit tests as a preventive practice against software defects. Dudila, R., Letia, I. A. 2013 International Conference on Control Systems and Computer Science (ICCP), Sinaia, Romania, , (2013).
- Fushihara, Y., Aman, H., Amasaki, S., Yokogawa, T., Kawahara, M. A trend analysis of test smells in Python test code over commit history. 2023 49th Euromicro Conference on Software Engineering and Advanced Applications (SEAA), Durres, Albania, , (2023).
- SUPERNOVA: Automating test selection and defect prevention in AAA video games using risk-based testing and machine learning. Senchenko, A., Patterson, N., Samuel, H., Ispir, D. 2022 IEEE Conference on Software Testing, Verification and Validation (ICST), Valencia, Spain, , (2022).
- A software maintenance methodology: An approach applied to software aging. Araujo, J., Melo, C., Oliveira, F., Pereira, P., Matos, R. 2021 IEEE International Systems Conference (SysCon), Vancouver, BC, Canada, , Forthcoming.
- Mutual Automobile Insurance Company. Mutation Testing in Parallel Threads. U.S. Patent. , US11163675B1. USPTO (2021).
- Machine learning-based decision-making for autonomous systems communication. U.S. Patent. , US11366748B1. USPTO (2022).
- Use sequential set index for root cause location and problem detection. U.S. Patent. Huo, Z. P., et al. , US11645142B1. USPTO (2023).
- Selenium WebDriver. , Selenium. https://www.selenium.dev (2025).
- The Katalon Platform. , Katalon. Available from: https://katalon.com (2025).
- Apache JMeter. , Apache Software Foundation. Available from: https://jmeter.apache.org (2024).
- OWASP ZAP (Zed Attack Proxy). , OWASP Foundation. Available from: https://www.zaproxy.org/ (2025).
- Xray by Xpand IT. Xray - Test Management for Jira. , Xray. Available from: https://www.getxray.app (2025).
- Tricentis Copilot. , Tricentis. Available from: https://www.tricentis.com/products/copilot/ (2025).
- SmartQ Tech Products. , SmartQ Technologies. Available from: https://www.thesmartq.com/smartq-tech-products/ (2025).
Access restricted. Please log in or start a trial to view this content.