The protocol describes equations for estimating vitamin A total body stores (TBS) using retinol isotope dilution methodology, and a brief overview is presented on the use of model-based compartmental analysis with a super-subject study design for estimating group and individual TBS.
Method Article
Use of Equations for Estimating Vitamin A Total Body Stores using Stable Isotope Methods
In This Article
Summary
Abstract
Stable isotope methods for estimating vitamin A total body stores (TBS) quantitatively are based on the principle of isotope dilution. Briefly, a single oral dose 2H- or 13C-labeled vitamin A is administered to an individual, and plasma concentrations of labeled and unlabeled retinol are measured by mass spectrometry at a pre-specified time after dosing, usually 14-21 days. TBS is calculated using the retinol isotope dilution (RID) equation or the mass balance equation. The RID and mass balance equations require information on retinol specific activity in plasma (SAp; i.e., tracer-to-tracee ratio), which is obtained from mass spectrometry measurements. Both equations require values for coefficients to account for absorption and storage of the oral dose of stable isotope-labeled retinol at the time of TBS estimation. Published values for the coefficients can be used in the equations. Alternatively, TBS can be determined by model-based compartmental analysis of plasma retinol kinetic data using WinSAAM Simulation, Analysis, and Modeling software. Briefly, a super-subject study design with model-based compartmental analysis of plasma retinol kinetic data can be used to determine group TBS and population-specific values for the composite coefficient (FaS), which is subsequently used in the RID equation to determine individual TBS. The super-subject design requires an estimate of mean dietary vitamin A intake for the group of participants, and blood sampling at ~11-16 time points over ~28-91 d, with 5-7 participants/time point, but each participant provides only 2-3 blood samples. Liver vitamin A concentration can be estimated from TBS, using an assumption for the proportion of TBS found in liver and an estimate of liver weight. Vitamin A status is assessed by comparing estimated liver vitamin A concentration with proposed cutoff values for categorizing status across the full continuum, from deficient to excess vitamin A stores.
Introduction
Stable isotope methods provide a quantitative estimate of vitamin A total body stores (TBS), and can be used to assess the vitamin A status of children and adults in community settings1. Because they provide a quantitative estimate of TBS across the full continuum of status, from deficient to excess stores, they are considered to be the best indirect methods for assessing vitamin A status in humans1. In contrast, serum concentrations of retinol or retinol binding protein are commonly used to assess status; however, they do not reflect vitamin A body stores, unless stores are very low, because serum retinol is under homeostatic control; moreover, they decrease transiently during inflammation, complicating the interpretation of results in populations with high infection rates2. The modified relative dose response (MRDR) test provides an estimate of the adequacy of liver vitamin A reserves, but does not provide a quantitative estimate of liver vitamin A concentration2. Generally, stable isotope methods are used to study vitamin A metabolism and to estimate the impact of vitamin A interventions in populations at risk of deficiency3,4,5,6,7,8,9,10. They are also useful for assessing the risk of excessive vitamin A stores in populations exposed to multiple sources of vitamin A, such as fortified foods, high-dose vitamin A supplements, and/or micronutrient powders1,11. These applications are important for better understanding vitamin A metabolism throughout the lifecycle, refining vitamin A requirements, and assessing the efficacy and safety of vitamin A interventions that aim to improve nutrition and health outcomes among children and women of reproductive age in resource-poor communities. TBS is estimated using retinol isotope dilution (RID) methodology and either the RID equation or the mass balance equation. Alternatively, TBS can be estimated by model-based compartmental analysis of plasma retinol kinetic data using WinSAAM Simulation, Analysis, and Modeling software (www.winsaam.org) with a super-subject design12. Briefly, these methods require 1) administration of a single oral dose of stable isotope labeled vitamin A to participants, 2) collection of 1-2 blood samples ~14-21 days after isotope administration for RID methods, (or collection of 2-3 blood samples per participant during 28-91 days, and an estimate of the group mean dietary vitamin A intake for model-based compartmental analysis), and 3) access to an appropriate mass spectrometer (GC-C-IRMS, GC/MS, LC/MS/MS) to measure plasma concentrations of labeled and unlabeled retinol.
This protocol is intended to provide guidance for new users of RID methodology on how to calculate TBS using either the RID equation or the mass balance equation. In addition, a brief overview is presented on the use of model-based compartmental analysis with a super-subject study design to estimate TBS for a group of study participants and for individual participants; however, details on conducting compartmental modeling of plasma retinol kinetic data are beyond the scope of this manuscript (for more information on this approach, see Green et al.12). For an overview of vitamin A stable isotope methods, see Lietz et al.1.
RID equation for estimating TBS
The RID equation is used when an oral dose of stable isotope-labeled vitamin A is administered to an individual, and LC/MS/MS or GC/MS is used to measure labeled and unlabeled retinol in plasma to obtain retinol specific activity in plasma (SAp) (i.e., tracer-to-tracee ratio in plasma)13,14. A single blood sample at ~14-21 days after isotope dosing is required to estimate TBS using the RID equation. The RID equation shown below is used to estimate TBS in adults and children 15:
TBS = Fa × S × (1/SAp)
where TBS is µmol of vitamin A, Fa is the fraction of the oral tracer dose of vitamin A that is absorbed and found in body stores at time t, and S is the ratio of retinol specific activity in plasma (SAp) to that in stores (SAs) at time t. SAp is plasma retinol specific activity, expressed as a fraction of dose in plasma: (labeled retinol / unlabeled + labeled retinol) in plasma / oral dose of labeled retinol (µmol))12. Note that the contribution of unlabeled retinol to total retinol in the denominator is negligible 14-21 days after isotope dosing when TBS is usually estimated. For a detailed discussion of the RID equation, see Green et al.12.
Because the coefficients Fa and S are multiplied in the RID equation, they are commonly referred to as the composite coefficient FaS. Published values for the composite coefficient FaS, based on theoretical adults and children with a wide range of TBS, are available at multiple times after isotope dosing (Table 1; adapted from Green and Green15). These values can be used in the RID equation to calculate the TBS of individuals from similar populations15. Alternatively, model-based compartmental analysis of plasma retinol kinetic data can be used to determine population-specific values for the composite coefficient FaS12,16.
Mass balance equation for estimating TBS:
The mass balance equation is used to calculate TBS when an oral dose of 13C-labeled vitamin A is administered to an individual, and GC-C-IRMS is used to measure 13C enrichment (13C/total C) in serum10,17. The mass balance equation requires two blood samples: a baseline sample to measure the natural abundance of 13C in serum, and a second sample 14 days after dosing for measurement of 13C-enrichment in serum. However, if an investigator is interested in estimating mean TBS for a group of individuals, baseline blood sampling can be done in 5-6 participants, and the mean 13C abundance for those individuals can be used as an estimate of baseline 13C abundance in serum for individuals in the group. The natural abundance of 13C is ~1.1%, but because this can vary with diet, it should be measured accurately in serum at baseline to correct the post-dose 13C abundance, as shown in an example below10. The mass balance equation requires measurements of isotope abundance (13C/total C) for: 1) the dose of 13C-labeled vitamin A (Fa), 2) baseline serum retinol (Fb), and 3) post-dose serum retinol (Fc). The isotope abundance measurements are used to calculate the tracer-to-tracee ratio, and subsequently TBS. Additional factors are included in the equation to account for absorption and storage of the dose of 13C-labeled vitamin A at the time of TBS assessment. For a detailed discussion of the mass balance equation, see Gannon and Tanumihardjo10.
The mass balance equation shown below is used to estimate TBS in adults or children:
TBS = a x (1/TTR) x (factor for absorption x factor for storage)
where TTR is the serum tracer-to-tracee ratio. The factor a accounts for loss of the 13C-labeled vitamin A tracer between the time of dosing and blood sampling, and is calculated as e-kt, where k = ln(2)/half-life of retinol, and t = days since dosing10. The factor for absorption of the tracer dose is assumed to be 0.8-1.0 (80%-100%) for adults, or 0.75-0.9 (75%-90%) for children10. The factor for storage (the ratio of TTR in serum to stores) is assumed to be 0.8 when dietary vitamin A intake is not controlled during the 14 day period between dosing and blood sampling, or 1.0 when dietary vitamin A intake is low and controlled10.
Estimation of liver vitamin A concentration
The total liver reserve of vitamin A can be estimated based on the proportion of TBS that is found in the liver. It is assumed that ~50% of TBS is in the liver when vitamin A status is low and ~80% when vitamin A status is adequate; these assumptions are based on limited data that show that liver vitamin A as a percent of total body vitamin A is dependent on vitamin A status and can range from ~40%-90%18,19. More data are needed to determine how to better estimate liver vitamin A as a percent of total body vitamin A. Until then, the information in Table 2 can be useful for estimating the vitamin A status of a study population to determine whether to assume a value of 50% or 80%. Also, if the prevalence of serum retinol concentrations <0.7 µmol/L is ≤10% among children 6-59 months of age, vitamin A status of the population is assumed to be adequate; note that this cutoff overlaps with the WHO category of vitamin A deficiency as a mild public health problem (Table 2)20,21. Liver vitamin A concentration is calculated from total liver reserves based on liver weight, which can be estimated as 3% of body weight for children and 2.4% of body weight for adults22. Alternatively, liver weight can be estimated using body surface area (BSA) and a prediction equation23.
Overview of model-based compartmental analysis with a super-subject design to estimate group and individual TBS
Model-based compartmental analysis can be used to study individual retinol kinetics with frequent sampling, but has proven especially useful in populations where frequent sampling is not feasible, such as young and preschool age children, and potentially, pregnant and lactating women, in resource-poor community settings11,24,25,26,27. Model-based compartmental analysis is used with a super-subject study design to predict TBS for the group of study participants, and to estimate population-specific values for the composite coefficient FaS, which can then be used to determine TBS of individual study participants with the RID equation12,24. The super-subject design is used in community settings to minimize the number of blood samples collected from each individual12,24,26. An example of the design is shown in Table 3 for a 91-day study with 105 subjects and 16 blood sampling times. In this example, each subject ingests a single oral dose of stable isotope labeled vitamin A, and provides a blood sample at 14 days after dosing for estimation of each individual's TBS using the RID equation with the model-derived FaS value at 14 days; and a second blood sample at one of the remaining 15 times to obtain the plasma retinol kinetic data that is required for model-based compartmental analysis. In this design, there are 7 individuals assigned to each of the 15 additional blood sampling times. Generally, 5 participants per time is considered sufficient, but because some participants may miss an assigned blood sampling time, ~7 individuals per time is recommended. Plasma is analyzed by mass spectrometry to obtain measurements of labeled and non-labeled retinol, and the fraction of the vitamin A isotope dose in plasma (FDp) is calculated. Briefly, geometric mean FDp versus time is plotted and fit to a compartmental model using WinSAAM software12,24,26. An example of an 8-compartment model for whole-body vitamin A metabolism is shown in Figure 115. The model includes compartments that represent plasma vitamin A (compartment 5), and two exchangeable vitamin A storage pools (compartments 6 (large) and 7 (small)). The sum of the mass of vitamin A in the two exchangeable storage compartments is used as the estimate of TBS:
TBS (µmol) = M(6) + M(7)
where M(I) is µmol vitamin A in compartment I
Population-specific values for the coefficients Fa and S can be calculated at any time (t) over the duration of a super-subject study using the following equations12,24:
Fat = F(6)t + F(7)t
St = SApt / SAst = [F(5)t / M(5)] / {[F(6)t + F(7)t] / [M(6) + M(7)]}
where Fat is the fraction of the ingested tracer dose absorbed and found in stores at time t; F(I)t is fraction of the tracer dose present in compartment I at time t; St is specific activity in plasma compared to stores at time t; SA is retinol specific activity in either plasma (p) or stores (s) at time t; and M(I) is µmol vitamin A in compartment I. See Green et al.12 for a detailed discussion of model-based compartmental analysis.
Protocol
The data are hypothetical; no human participants were involved in this study.
1. TBS estimation using the RID equation
- To estimate TBS using the RID equation, use the following hypothetical participant data:
Age: 25 years
Labeled retinol concentration in plasma: 0.0163 µmol/L
Unlabeled retinol concentration in plasma: 1.154 µmol/L
Oral labeled vitamin A dose: 6.838 µmol RE
Published composite coefficient FaS at 14 days15: 0.727
NOTE: The amount of the vitamin A isotope dose is based on the vitamin A activity of the labeled vitamin A compound (usually 2H or 13C-labeled retinyl acetate) and is expressed as µmol retinol equivalent (RE). For example, if 2H6-retinyl acetate is used for oral dosing and a dose of 2000 µg RE is desired, the dose of 2H6-retinyl acetate is calculated based on the molecular weights of 2H6-retinyl acetate (328.49 µg/µmol) and 2H6-retinol (292.49 µg/µmol): 2000 x (328.49/292.49) = 2246 µg 2H6-retinyl acetate. The dose of 2000 µg RE expressed in µmol is calculated by dividing the dose (µg RE) by the molecular weight of 2H6-retinol: 2000/292.49 = 6.838 µmol. - Calculate SAp using the equation below:
SAp = [labeled retinol / (labeled retinol + unlabeled retinol) in plasma] / dose (µmol)
Use participant data above to solve the equation:
SAp = [0.0163 / (0.0163 + 1.154)] / 6.838 = 0.0020 µmol - Calculate TBS using the RID equation shown below:
TBS = FaS x (1/SAp)
Use participant data above to obtain the FaS value, and the calculated SAp value from step 2:
TBS = 0.727 x (1/ 0.0020) = 364 µmol
2. TBS estimation using the mass balance equation
- To estimate TBS using the mass balance equation, use the following hypothetical participant data:
Age: 4 years
Fa (2 carbons labeled plus natural abundance): 0.11
Fb: 0.010745
Fc: 0.0110476
Applied tracer dose: 1.0 µmol RE
Factors for absorption and storage:
Absorption: 0.8
Storage: ratio of TTR in serum to liver (diet not controlled): 0.8
NOTE: 13C2-labeled vitamin A is used for dosing, and the isotope abundance of the dose (Fa) is calculated as: ([13C2] labeled in synthesis + natural abundance (13C/20C total)10. The assumed value for absorption in this example is 0.8; a value between 0.8-1.0 can be selected based on factors that may affect vitamin A absorption in the study population (i.e., inflammation/infection rates may reduce absorption1). Note that Fa here is not the same as the coefficient Fa in the RID equation. - Calculate the Tracer-to Tracee Ratio (TTR) using the equation shown below:
TTR = (Fc-Fb)/(Fa-Fc)
where, Fa = 13C isotope abundance in the 13C-labeled vitamin A dose; Fb = 13C isotope abundance of serum retinol at baseline; Fc = 13C isotope abundance of serum retinol post-dosing
Use the values for Fa, Fb, and Fc from the participant data above to calculate TTR:
TTR = (0.0110476 - 0.010745) / (0.11 - 0.0110476) = 0.003058035 - Then, calculate 1/TTR
1/TTR = 1 / 0.003058035 = 327.01 - Next, calculate the factor a using the equation below:
factor a = 13C-labeled vitamin A dose (µmol) x e-kt- First, calculate k using the equation shown below:
k=ln(2)/half-life of retinol
The natural log of 2 (ln(2)) is equal to 0.693147181; the half-life of retinol is estimated to be 32 days* for children; using this information, calculate k
k= 0.693147181 / 32 = 0.021660849
*estimated values are used for the half-life of retinol (32 to 136 d for children; 140 d for adults); or values can be estimated based on the rate of decay of the tracer dose in individuals in a control group during the study3,10. - Next, calculate e-kt, where t is time (days since isotope dosing; t = 14 days for the mass balance equation). Use this information with the calculated value for k from step 4.1:
e-kt = e-0.02166 x 14 = 0.738413073 - Lastly, calculate factor a, using the equation shown below, the amount of the isotope dose from the participant data above (1.0 µmol), and the calculated value for e-kt
factor a = 13C-labeled vitamin A dose (µmol) x e-kt
factor a = 1.0 x 0.738413073 = 0.738413073
- First, calculate k using the equation shown below:
- Calculate TBS using the mass balance equation shown below:
TBS = a x (1/TTR) x factor for absorption x factor for storage
Use the calculated factor a (0.738413073) and the calculated 1/TTR value (327) from the steps above, and the fixed values for absorption (0.8) and storage (0.8):
TBS = 0.738413073 x 327 x 0.8 x 0.8 = 155 µmol
3. Liver vitamin A estimation
- To calculate total liver vitamin A reserves and liver vitamin A concentration, use the following participant data:
Age: 25 years
Weight: 61.0 kg
Height: 156.8 cm
TBS: 364 µmol (estimated by RID)
Prevalence of plasma retinol concentrations <0.7 µmol/L in the study population is <2%. - First, calculate liver weight based on body surface area (BSA) using the equation shown below:
BSA (m2) = sqrt [body weight (kg) x height (cm)/3600]
Use the participant data above to calculate BSA:
BSA (m2) = sqrt [61.0 x 156.8/3600] = 1.63 m2 - Next, calculate liver weight using the appropriate equation shown below, and the calculated BSA value from above:
If body surface area (BSA) is <1:
Liver weight (g) = 772 (g/m2) x body surface area (BSA) - 38
If body surface area (BSA) is ≥1:
Liver weight (g) = 772 (g/m2) x body surface area (BSA)
Calculate BSA using the equation shown below; (note that BSA is ≥1 from step 2 above):
Liver weight (g) = 772 (g/m2) x body surface area (BSA)
Liver weight (g) = 772 (g/m2) x 1.63 m2 = 1258 g - Lastly, calculate liver vitamin A concentration using the equation shown below:
Liver vitamin A concentration = TBS (µmol) * proportion of TBS found in liver/ liver weight (g)
Use the TBS value from the participant data above (364 µmol), and an assumed value of 0.8 for the proportion of TBS found in liver (vitamin A status of the study population is assumed to be adequate based on the prevalence of low serum retinol <2%) and the calculated liver weight value (1258 g) from above:
Liver vitamin A concentration = 364 µmol * 0.8 / 1258 = 0.232 µmol/g liver
4. Model-predicted TBS for the group
- To calculate model-predicted TBS for the group (study population) using a super-subject study design, use the following hypothetical modeling results from a super-subject study conducted among women of reproductive age (for details on this approach, see Green et al.15):
Hypothetical model output:
M(6) = 973.281 µmol
M(7) = 55.7646 µmol - Calculate TBS for the group using the super-subject model output provided and the equation below:
TBS = M(6) + M(7)
Use the mass of vitamin A in compartments 6 and 7 (from model output):
TBS = 973.281 + 55.7646 = 1029 µmol
NOTE: An example of how to calculate values for the composite coefficient FaS based on model output is beyond the scope of this overview. For more information, see Green et al.12,15.
Results
This protocol presents examples of how to estimate TBS quantitatively in adults or children using retinol isotope dilution methodology and either the RID equation or mass balance equation. The RID equation is used when 2H or 13C-labeled vitamin A is used for dosing, and LC/MS/MS or GC/MS is used to measure plasma concentrations of labeled and unlabeled retinol. The RID equation requires information on plasma retinol specific activity (tracer-to-tracer ratio) using the mass spectrometry measurements, the oral dose of labeled vitamin A (µmol RE), and a value for the composite coefficient FaS. Published values for the composite coefficient FaS are available; alternatively, population-specific values can be estimated by model-based compartmental modeling of plasma retinol kinetic data. The RID equation is usually applied at ~14 to 21 days after dosing, but it can be applied at a later time if a corresponding value for the composite coefficient FaS is available. The value of TBS for the example shown here was 364 µmol.
The mass balance equation is used when 13C-labeled vitamin A is used for dosing, and GC-C-IRMS is used to measure 13C isotope abundance in plasma. The mass balance equation requires the tracer-to-tracee ratio (measured 13C isotope abundance in plasma) and values for factors (coefficients) to account for absorption and storage of the dose of 13C-labeled vitamin A at the time of TBS assessment. Published values for the coefficients are available for use in the equation. The mass balance equation is applied at 14 days after dosing. The value of TBS for the example shown here was 155 µmol.
Model-based compartmental analysis of plasma retinol kinetic data with a super-subject design is used to estimate TBS for a group of study participants, and to determine values for the coefficient FaS for subsequent determination of TBS for individual participants. TBS for the group is calculated as the mass of vitamin A in the body's exchangeable vitamin A storage pools; and TBS for individual study participants is calculated at 14 days after dosing and/or at later times using each participant's plasma retinol specific activity value (SAp) and the corresponding model-derived value for the FaS coefficient at the chosen time(s) with the RID equation. The value of TBS for the example shown here was 1029 µmol.
TBS results can be interpreted by converting TBS to liver vitamin A concentration, and comparing liver vitamin A concentrations to cutoff values for categorizing vitamin A status across the continuum; note that cutoff values from deficient to toxic stores that were proposed in 2015 are likely to be refined as more data become available2. The liver vitamin A concentration for the example shown here was 0.232 µmol/g liver
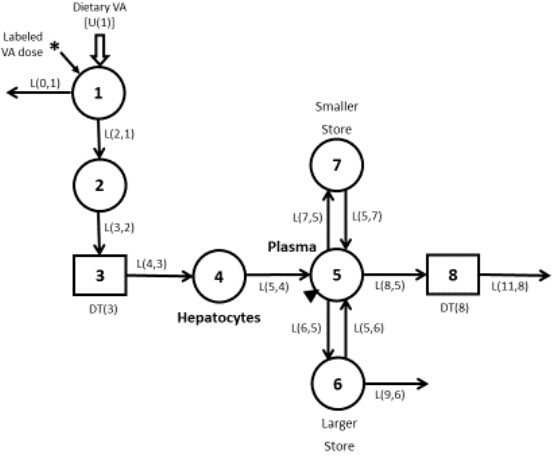
Figure 1: Compartmental model for whole-body vitamin A metabolism in humans. Circles represent compartments; the rectangles are delay elements; arrows between components are fractional transfer coefficients [L(I,J)s, or the fraction of retinol in compartment J transferred to compartment I each day] and delay times [DT(I)s, or days spent in delay element I]. Compartment 1 is the site of introduction of ingested tracer (*) and dietary vitamin A [U(1)]. Components 1 - 4 represent digestion, absorption, and chylomicron processing until uptake by hepatocytes (compartment 4), with subsequent secretion of retinol bound to retinol-binding protein into plasma compartment 5, which is the site of sampling (triangle). Component 8 allows for irreversible uptake of plasma retinol by tissues from which retinol does not recycle. Retinol in plasma can also exchange with vitamin A in 2 extravascular pools (a larger compartment 6 and a smaller compartment 7), with compartments 6 and 8 the sites of irreversible loss from the system. VA = vitamin A. This figure was modified from15. Please click here to view a larger version of this figure.
Table 1: Estimated values for the composite coefficient FaS for theoretical adults and children at selected times. 14 days or later is recommended for applying the RID equation for estimation of TBS in adults. Abbreviations: GM = geometric mean; NA = not applicable. This table has been modified from15. Please click here to download this Table.
Table 2: Population prevalence cutoffs for vitamin A deficiency. Abbreviations: VAD = vitamin A deficiency; MRDR = modified relative dose response test; WHO = World Health Organization. This table has been modified from21. Please click here to download this Table.
Table 3: Number of participants per time for a 91-day super-subject study. Blood sampling is done in all participants (n=105) on day 14, and each participant is randomly assigned to a second time point during the 91-day study, so that there are at least 7 participants at each time, and each participant provides a total of 2 blood samples. Please click here to download this Table.
Discussion
In summary, stable isotope methods provide quantitative estimates of TBS in adults and children and can be applied in community settings1. TBS of adults and children can be estimated using retinol isotope dilution methodology with either the RID equation or the mass balance equation. Although both equations are based on the principle of isotope dilution, there are a few differences. Briefly, the RID equation requires a single blood sample and is applied at ~14-21 days but can also be applied at later times if a corresponding value for the composite coefficient FaS is available. Published values for the composite coefficient FaS are available at different times post-dosing for use in the RID equation15; alternatively, population-specific values can be determined using model-based compartmental analysis. The mass balance equation requires 2 blood samples, one at baseline and the other at 14 days after dosing. However, as mentioned previously, if the mean TBS for a group is estimated, baseline blood sampling can be done in 5-6 participants, and the mean 13C abundance for those individuals can be used as an estimate of baseline 13C abundance in serum.
When applying the RID equation, important considerations include expressing the dose as vitamin A activity (µmol RE) rather than µmol of labeled retinyl ester, and if published values for the coefficient FaS are used, it is important to select FaS values that were derived from a similar population (children or adults) and that correspond to the time (study day) that SAp was measured to estimate TBS. When applying the mass balance equation, it is critical to account for 13C natural abundance in the dose of 13C-labeled vitamin A, and to correct the post-dose serum 13C abundance for the natural abundance of 13C in serum at baseline to obtain accurate estimates of TBS10.
Model-based compartmental modeling is used with a super-subject study design in community settings to estimate group TBS and population-specific values for the composite coefficient FaS over the duration of the study12,24. An advantage of this approach is that the model-derived values for the composite coefficient FaS are likely to provide a more accurate estimate of TBS for individuals in the group than a published value that is derived from a different population. This approach also provides more flexibility for the timing of blood sampling in field studies. For example, if a participant is not available at their assigned time for the RID blood draw, the blood sample could be collected at a later time, and the corresponding model-derived value for the composite coefficient FaS could be used in the RID equation to estimate their TBS12,24.
TBS results can be interpreted by converting TBS to liver vitamin A concentration, and comparing values with proposed cutoffs for liver vitamin A concentration for categorizing vitamin A status across the full continuum, from deficient to toxic stores2. Although the proposed cutoffs suggested that >1 µmol/g liver indicates hypervitaminosis A, recent studies showed no adverse effects between 1-3 µmol/g, and that histopathological changes appear at >3 µmol/g11,28. More data are needed on liver vitamin A concentrations and their physiological effects in humans to refine cutoff values for subtoxic and toxic status categories.
Although stable isotope approaches for assessing vitamin A status provide quantitative estimates of TBS, and are considered to be the best methods for assessing status, they are not yet widely used because of the relative high cost compared to other assessment methods, and limited access to: stable isotope labeled vitamin A and expertise to prepare and administer doses; mass spectrometry and expertise to conduct plasma analyses; expertise in study design and application of equations for estimating TBS; and expertise in model-based compartmental analysis of plasma retinol kinetic data. For new users, expert consultation/collaboration is critical during the planning, implementation, and analytical phases of a study to ensure success.
Despite challenges, there have been advances in stable isotope methodology in recent years that have facilitated its use in community settings12,29. Future studies employing this methodology are likely to generate important new information on vitamin A metabolism and requirements throughout the lifecycle, the bioefficacy of dietary provitamin A carotenoids, and the efficacy and safety of interventions for improving vitamin A status in populations at risk of deficiency.
Disclosures
The author has nothing to disclose.
Acknowledgements
I thank Cornelia Loechl and Veronica Lopez-Teros for guidance on topics to include in this protocol.
Materials
| Name | Company | Catalog Number | Comments |
|---|---|---|---|
| Excel | Microsoft | Microsoft Excel | |
| Texas Instruments TI-30XIIS Scientific Calculator | Texas Instruments | TI-30XIIS |
References
- Lietz, G., et al. Current capabilities and limitations of stable isotope techniques and applied mathematical equations in determining whole-body vitamin A status. Food and Nutr. 37, S87-S103 (2016).
- Tanumihardjo, S. A., et al. Vitamin A: biomarkers of nutrition for development. Am J Clin Nutr. 94 (2), 658s-665s (2011).
- Gannon, B., et al. Biofortified orange maize is as efficacious as a vitamin A supplement in Zambian children even in the presence of high liver reserves of vitamin A: a community-based, randomized placebo-controlled trial. Am J Clin Nutr. 100 (6), 1541-1550 (2014).
- Pinkaew, S., Udomkesmalee, E., Davis, C. R., Tanumihardjo, S. A. Vitamin A-fortified rice increases total body vitamin A stores in lactating Thai women measured by retinol isotope dilution: a double-blind, randomized, controlled trial. Am J Clin Nutr. 113 (5), 1372-1380 (2021).
- Haskell, M. J., et al. Daily consumption of Indian spinach (Basella alba) or sweet potatoes has a positive effect on total-body vitamin A stores in Bangladeshi men. Am J Clin Nutr. 80 (3), 705-714 (2004).
- Jamil, K. M., et al. Daily consumption of orange-fleshed sweet potato for 60 days increased plasma beta-carotene concentration but did not increase total body vitamin A pool size in Bangladeshi women. J Nutr. 142 (10), 1896-1902 (2012).
- Tang, G., et al. Green and yellow vegetables can maintain vitamin A body stores in Chinese children. Am J Clin Nutr. 70, 1069-1076 (1999).
- Haskell, M. J., Jamil, K. M., Peerson, J. M., Wahed, M. A., Brown, K. H. The paired deuterated retinol dilution technique can be used to estimate the daily vitamin A intake required to maintain a targeted whole body vitamin A pool size in men. J Nutr. 141 (3), 428-432 (2011).
- Valentine, A. R., Davis, C. R., Tanumihardjo, S. A. Vitamin A isotope dilution predicts liver stores in line with long-term vitamin A intake above the current Recommended Dietary Allowance for young adult women. Am J Clin Nutr. 98, 1192-1199 (2013).
- Gannon, B. M., Tanumihardjo, S. A. Comparisons among Equations Used for Retinol Isotope Dilution in the Assessment of Total Body Stores and Total Liver Reserves. J Nutr. 145 (5), 847-854 (2015).
- Engle-Stone, R., et al. Filipino Children with High Usual Vitamin A Intakes and Exposure to Multiple Sources of Vitamin A Have Elevated Total Body Stores of Vitamin A But Do Not Show Clear Evidence of Vitamin A Toxicity. Curr Dev Nutr. 6 (8), nzac115(2022).
- Green, M. H., Green, J. B., Ford, J. L. Better Predictions of Vitamin A Total Body Stores by the Retinol Isotope Dilution Method Are Possible with Deeper Understanding of the Mathematics and by Applying Compartmental Modeling. J Nutr. 150 (5), 989-993 (2020).
- Oxley, A., et al. Determination of Vitamin A Total Body Stores in Children from Dried Serum Spots: Application in a Low- and Middle-Income Country Community Setting. J Nutr. 151 (5), 1341-1346 (2021).
- Tang, G., Qin, J., Dolnikowski, G. G. Deuterium enrichment of retinol in humans determined by gas chromatography electron capture negative chemical ionization mass spectrometry. J Nutr Biochem. 9, 408-414 (1998).
- Green, M. H., Green, J. B. Use of Model-Based Compartmental Analysis and Theoretical Data to Further Explore Choice of Sampling Time for Assessing Vitamin A Status in Groups and Individual Human Subjects by the Retinol Isotope Dilution Method. J Nutr. 151 (7), 2068-2074 (2021).
- Ford, J. L., Green, J. B., Green, M. H. A Population-Based (Super-Child) Approach for Predicting Vitamin A Total Body Stores and Retinol Kinetics in Children Is Validated by the Application of Model-Based Compartmental Analysis to Theoretical Data. Curr Dev Nutr. 2 (11), nzy071(2018).
- Tanumihardjo, S. A. Vitamin A status assessment in rats with 13C4-retinyl acetate and gas chromatogrphy/combustion/isotope ratio mass spectrometry. J Nutr. 130 (11), 2844-2849 (2000).
- Institute of Medicine. Dietary reference intakes: vitamin A, vitamin K, arsenic, boron, chromium, copper, iodine, iron, manganese, molybdenum, nickel, silicon, vanadium and zinc. , National Academy Press. Washington, DC. (2001).
- Raica, N. Jr, Scott, B. S., Lowry, L., Sauberlich, H. E. Vitamin A concentration in human tissues collected from five areas in the United States. Am J Clin Nutr. 25, 291-296 (1972).
- Conditions for Scaling Back Universal Vitamin A Supplementation - Policy Brief. , Global Alliance for Vitamin A, Nutrition International, Helen Keller International, UNICEF. https://www.gava.org/resources-tools/ (2019).
- Indicators for assessing vitamin A deficiency and their application in monitoring and evaluating intervention programmes. , World Health Organization. https://www.who.int/nutrition/publications/micronutrients/vitamin_a_deficiency/WHO_NUT_96.10/en/ (1992).
- Olson, J. A. Recommended dietary intakes (RDI) of vitamin A in humans. Am J Clin Nutr. 45, 704-716 (1987).
- Yoshizumi, T., et al. A simple new formula to assess liver weight. Transplant Proc. 35 (4), 1415-1420 (2003).
- Ford, J. L., et al. Use of Model-Based Compartmental Analysis and a Super-Child Design to Study Whole-Body Retinol Kinetics and Vitamin A Total Body Stores in Children from 3 Lower-Income Countries. J Nutr. 150 (2), 411-418 (2020).
- Lopez-Teros, V., et al. Use of a Super-child Approach to Assess the Vitamin A Equivalence of Moringa oleifera Leaves, Develop a Compartmental Model for Vitamin A Kinetics, and Estimate Vitamin A Total Body Stores in Young Mexican Children. J Nutr. 147 (12), 2356-2363 (2017).
- Lopez-Teros, V., et al. The "Super-Child" Approach Is Applied To Estimate Retinol Kinetics and Vitamin A Total Body Stores in Mexican Preschoolers. J Nutr. 150 (6), 1644-1651 (2020).
- Green, M. H., Lopez-Teros, V., Avila-Prado, J., Green, J. B. Direct Use of Plasma or Milk Vitamin A Specific Activity Data to Model Retinol Kinetics and Predict Vitamin A Stores in Theoretical Lactating Women. J Nutr. 152 (12), 2993-2999 (2022).
- Olsen, K., et al. Serum retinyl esters are positively correlated with analyzed total liver vitamin A reserves collected from US adults at time of death. Am J Clin Nutr. 108 (5), 997-1005 (2018).
- Green, M. H., Ford, J. L., Green, J. B. Inclusion of Vitamin A Intake Data Provides Improved Compartmental Model-Derived Estimates of Vitamin A Total Body Stores and Disposal Rate in Older Adults. J Nutr. 149 (7), 1282-1287 (2019).