Here, we present a protocol to quantify epicardial adipose tissue using non-contrast CT, providing a rapid, cost-effective, and contrast-free alternative to cardiac magnetic resonance for clinical and research applications.
Method Article
Multi-parametric Algorithm for Epicardial Adipose Tissue Quantification in Patients with Non-Ischemic Heart Disease
Opens in a new tab
In This Article
Summary
Loading...
$$\rightleftharpoonup{xx}$$
$$\longleftharp{xx}$$,
$$\longrightharp{xx}$$,
Abstract
Loading...
$$\rightleftharpoonup{xx}$$
$$\longleftharp{xx}$$,
$$\longrightharp{xx}$$,
Epicardial adipose tissue (EAT), an active endocrine and paracrine organ, contributes to cardiovascular pathogenesis. While cardiac magnetic resonance (CMR) is the reference standard for quantifying EAT volume (EATV), its clinical utility is limited. Non-contrast chest CT (NCCT), widely used in radiology, offers a potential alternative. Although coronary CT angiography (CCTA) improves EAT-myocardial border delineation, its use is restricted by contrast allergy risks and increased radiation exposure. This study investigates the feasibility of NCCT for EATV assessment compared to CMR. We enrolled 120 non-ischemic heart disease patients undergoing both NCCT and CMR during a single hospitalization. EATV was measured using CMR-based volumetric analysis and NCCT-based grayscale threshold segmentation. EAT thickness was quantified at six anatomical sites (left/right atrioventricular grooves, anterior/posterior/superior interventricular grooves, and right ventricular free wall) on both modalities. Statistical analysis compared volume and thickness measurements. EATV derived from NCCT threshold segmentation showed no significant difference compared to CMR volumetry (P > 0.05). Similarly, EAT thickness measurements across all six sites demonstrated no significant differences between NCCT and CMR (all P > 0.05). NCCT-based grayscale threshold segmentation provides EATV measurements comparable to the CMR reference standard. This validates NCCT as a rapid, cost-effective, and clinically feasible alternative for accurate EAT quantification.
Introduction
Loading...
$$\rightleftharpoonup{xx}$$
$$\longleftharp{xx}$$,
$$\longrightharp{xx}$$,
Symptoms and signs in patients with non-ischemic heart disease are diverse and frequently misdiagnosed as non-cardiac conditions. Among patients undergoing invasive angiography for suspected ischemia, a substantial proportion (up to 70%) do not have obstructive coronary artery disease. Many of these patients exhibit symptoms consistent with ischemic presentations despite the absence of significant stenosis, falling under a broader spectrum of non-ischemic heart disease1. In the Women's Ischemia Syndrome Evaluation-Coronary Vascular Dysfunction (WISE) study, which involved 883 female patients, approximately two-thirds (62%) lacked significant obstructive stenosis2. Furthermore, patients with non-obstructive coronary artery disease tend to be younger than those with obstructive disease. Compared to asymptomatic individuals, these patients are associated with increased cardiovascular event rates, recurrent hospitalizations, impaired quality of life, and elevated healthcare costs3.
Epicardial Adipose Tissue (EAT), an active fat depot with endocrine functions4,5, exhibits changes in volume and thickness that are closely associated with cardiovascular events such as coronary atherosclerosis and atrial fibrillation6,7,8,9. While Cardiac Magnetic Resonance (CMR), with its superior soft-tissue resolution, is established as the gold standard for EAT measurement, its clinical application is limited by long scan times, high cost, contraindication in patients with cardiac pacemakers, and poor tolerance in individuals with claustrophobia10. Current research primarily focuses on Coronary Computed Tomography Angiography (CCTA)11. Although its vascular enhancement facilitates distinguishing the boundary between EAT and myocardium, CCTA carries risks including contrast agent allergy, increased radiation dose, and higher cost, resulting in limited applicability in general patient populations. Conversely, non-contrast CT (NCCT), the most widely utilized CT modality in clinical practice, offers several distinct advantages: (1) rapid scan time (minutes) without the need for contrast agents, resulting in a low radiation dose and relatively low cost, which promotes wider clinical adoption; (2) typical EAT exhibits Hounsfield Unit (HU) values ranging from -190 to -30, allowing for quantitative analysis based on tissue density. Studies indicate that EAT density significantly increases during Acute Coronary Syndrome, demonstrating that quantitative analysis via HU can effectively differentiate normal adipose tissue from inflammatory adipose tissue12. More importantly, routine non-contrast CT clearly visualizes the pericardial interface without requiring contrast agents, presenting a new possibility for EAT measurement. Therefore, exploring methods for quantifying EAT using non-contrast CT holds significant clinical value for promoting early cardiovascular risk assessment.
This study accordingly developed and validated a semi-automated, multi-parametric algorithm to quantify EAT from routinely acquired non-contrast CT. Our key findings demonstrate that this method reliably measures EAT volume and attenuation in patients with non-ischemic heart disease. While EAT quantification protocols exist for CCTA, a dedicated method for non-contrast CT is lacking. Our approach directly addresses this gap. It leverages the inherent advantages of NCCT, wide availability and safety, while eliminating the need for contrast injection required by existing CCTA-based methods. This significantly expands the potential for EAT assessment to broader clinical and screening populations.
Access restricted. Please log in or start a trial to view this content.
Protocol
Loading...
$$\rightleftharpoonup{xx}$$
$$\longleftharp{xx}$$,
$$\longrightharp{xx}$$,
Ethical approval for this study was granted by the Ethics Committee of Chengdu Medical College,with a waiver of informed consent. The study protocol ensured adherence to the ethical principles of the Declaration of Helsinki.
1. Patient selection
- Use the following inclusion criteria:
- Include patients with non-ischemic heart disease (NIHD).
NOTE: One hundred and twenty (120) patients with NIHD, who were treated at the First Affiliated Hospital of Chengdu Medical College between 2017 and 2024, were selected for this study. - Ensure that all patients underwent both NCCT and CMR examinations during a single hospitalization.
- Ensure inter-scan interval < 48 h.
NOTE: NIHD was defined by the presence of clinical symptoms of myocardial ischemia and confirmed coronary artery stenosis of less than 50% via either coronary computed tomography angiography (CCTA) or invasive coronary angiography. This clinical presentation aligns with the definition of Ischemia with No Obstructive Coronary Arteries (INOCA); however, for the purpose of this methodological study focused on EAT quantification, we use the broader term NIHD to describe our cohort.
- Include patients with non-ischemic heart disease (NIHD).
- Exclude patients with the following: pericardial disease, malignant tumors, a history of heart transplantation, or a history of cardiac surgery13.
2. NCCT imaging protocol and scanning parameters
- Scanner configuration
- Perform weekly calibration of the CT scanner using an American College of Radiology (ACR) phantom. Maintain the scanner room at an ambient temperature of 22 ± 2 °C and a relative humidity of < 65%.
- Operate a 320-row 640-slice detector equipped with a 160 mm Z-coverage.
NOTE: Key parameters include fixed 120 kVp, 130 mAs, rotation time: 0.5 s/360°, pitch: 1.0875.
- Scan range
- Acquire images from the supraclavicular fossa to the inferior diaphragmatic surface. Align laser positioning at T4/T5 intervertebral space.
- Set the scan range from the thoracic inlet to 2-3 cm below the costophrenic angle and acquire images in a single breath-hold.
- Remove chest metal objects; coach patient for consistent breath-hold.
- Conduct breath-hold training using spirometer-guided coaching (minimum 15 s capacity). For COPD patients, implement respiratory triggering with an acceptance window of ± 2 mm.
- Acquisition and reconstruction parameters
- Perform the scan using the spiral scanning mode; instruct the patient to hold their breath after deep inspiration.
NOTE: Key parameters: 1.0 mm slice thickness, slice increment: 1.0 mm (contiguous), 512 × 512 matrix, soft-tissue kernel (body soft tissue reconstruction kernel b); 350 mm fov,window level (WL) 40 HU, and window width (WW) 400 HU. - Obtain four image series: (1) 1.0 mm mediastinal window (WL 40/WW 400), (2) 1.0 mm lung window (WL -500/WW 1500), (3) 5.0 mm mediastinal window (WL 40/WW 400), and (4) 5.0 mm lung window (WL -500/WW 1500).
- Apply hybrid iterative reconstruction at a moderate strength (40%) using a standard soft-tissue kernel; generate 1.0-mm multiplanar reformations for anatomical reference, with window settings of mediastinal (width 400 HU/level 40 HU) and lung (width 1600 HU/level -600 HU).
- Perform the scan using the spiral scanning mode; instruct the patient to hold their breath after deep inspiration.
- Safety and notes
- Comply with both the Chinese WS/T 391-2012 radiation protection standardsand international guidelines14.
- Limit the volume computed tomography dose index (CTDIvol) ≤15mGy per ICRP 135. Record dose-length product (DLP) with conversion factor k = 0.014 mSv·mGy-1·cm-1.
- Use respiratory navigator + voice prompt to reduce motion artefacts if breath-hold is difficult.
NOTE: We selected bilinear interpolation for its optimal balance between computational efficiency and edge preservation. While acknowledging its potential for introducing partial-volume averaging and Hounsfield Unit (HU) smoothing, this method was selected because it provides superior boundary delineation compared to nearest-neighbor interpolation.
3. CMR imaging protocol and scanning parameters
- Scanner configuration
- Perform the examination using a 3.0 T MRI scanner equipped with a cardiac phased-array coil, with the patient in a supine position.
- Configure the magnetic resonance system to perform pre-scan quality assurance: Shim tolerance≤5 ppb, SNR ≥100 (phantom), B0homogeneity ≤0.5 ppm.
- Scanning protocol
- Access the cardiac imaging protocol by navigating through the following menu sequence on the console: Console, Protocol Manager, Cardiac, cardiac_easy, Cine_bSSFP.
- Acquire scout views: Transverse: Aortic arch to diaphragm; Coronal: Pulmonary trunk to LV apex; Sagittal: Right ventricle to descending aorta.
- Set up Electrocardiography (ECG) gating
- Apply 3-lead vector ECG with adaptive filtering and synchronize the respiratory bellows at mid-expiration.
- Select Adaptive trigger; set Trigger Window to 15% for arrhythmia accommodation.
- Cardiac phases, temporal resolution
- Acquire 30 cardiac phases with a temporal resolution = 45 ms and with 13 k-space segments for full-cycle coverage.
NOTE: Key parameters: Short-axis:TR/TE = 2.86/1.31 ms, flip angle = 60°, bandwidth = 1000 Hz/pixel, matrix size = 128 × 224, FOV (read/phase) = 360/320 mm, slice thickness = 8 mm, 6-12 slices (contiguous short-axis coverage), respiratory control = breath-hold (single breath-hold = 12-15 s. Four-chamber: TR/TE 2.86/1.31 ms, flip angle 55°, bandwidth 1000 Hz/pixel, matrix 128×224, FOV (read/phase) 360/320 mm, slice thickness 8 mm, 1-3 slices, respiratory control with breath-hold (single breath-hold = 10-12 s, same requirements as above).
- Acquire 30 cardiac phases with a temporal resolution = 45 ms and with 13 k-space segments for full-cycle coverage.
- Parallel imaging implementation
- Enable ARC parallel imaging with acceleration factor 2; auto-calibration eliminates separate reference scan.
NOTE: To ensure patient safety, this study strictly adhered to the Society for cardiovascular magnetic resonance (SCMR) position paper (2020) on clinical indications for cardiovascular magnetic resonance15 and perform Coil Check and auto-calibration prior to scan.
- Enable ARC parallel imaging with acceleration factor 2; auto-calibration eliminates separate reference scan.
4. EAT thickness measurement
- NCCT multiplanar reconstruction and measurement
- Import 1.0 mm mediastinal window series into the multiplanar reconstruction (MPR) module. Configure reconstruction interval at 0.5 mm using bilinear interpolation algorithm. Synchronize axial, sagittal, and coronal plane updates.
- Align with left ventricular (LV) long-axis reference. Rotate to obtain an orthogonal 4-chamber view (intersecting 2-chamber plane). Generate perpendicular short-axis stack (slice thickness: 8 mm, gap: 0 mm) covering mitral annulus to apex.
- Measure EAT thickness at the following six anatomical sites: the left atrioventricular groove (LAVG), right atrioventricular groove (RAVG), anterior interventricular groove (AIVG), superior interventricular groove (SIVG), inferior interventricular groove (IIVG), and right ventricular free wall (RVFW)16.
- Following the RVFW protocol, obtain three consecutive measurements at each anatomical site. The final recorded value for each site should be the mean of these triplicate measurements.
NOTE: If the range of the three measurements exceeds 1 mm, recalibrate the imaging plane and repeat the measurements.The overall measurement process and example are shown in Figure 1.
- Perform CMR high-resolution cine quantification
- Import balanced steady-state free precession (bSSFP) short-axis and long-axis cine sequences and manually identify end-diastole (ED)10and end-systole (ES) frames.
- Freeze ED images and manually refine borders to ± 1 pixel accuracy.
- Establish 12-level short-axis coverage from mitral annulus to apex.
- Measure thickness at: SIVG, IIVG, and RVFW, averaging values along ± 60° radii from the central axis to minimize oblique errors.
NOTE: Following the RVFW protocol, obtain three consecutive measurements at each anatomical site. The final record value for each site should be the mean of these triplicate measurements. - Establish the reference axis from the left ventricular apex to the midpoint of the mitral annulus, and align the horizontal long-axis plane to acquire a standardized four-chamber view.
- Measure epicardial adipose tissue thickness at LAVG, RAVG, and AIVG during end-diastole, calculating the mean of symmetric ± 45° measurements along the atrioventricular groove to avoid non-orthogonal errors.
NOTE: The overall measurement process and example are shown in Figure 2.
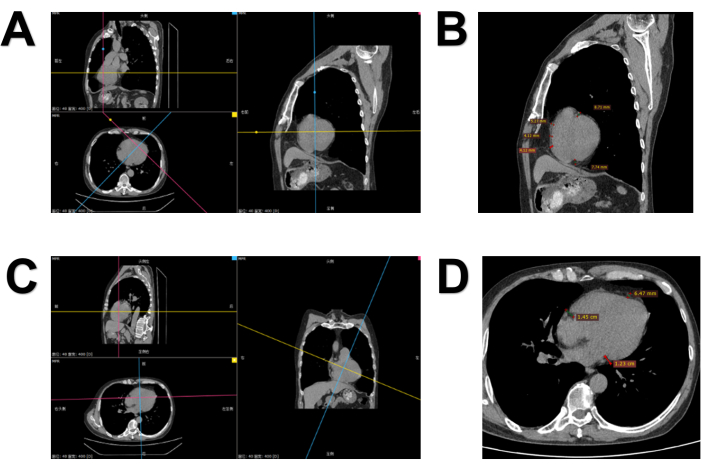
Figure 1: EAT thickness measurement on CT using multiplanar reconstruction (MPR). (A) MPR performed along the left ventricular short-axis plane; (B) Measurements obtained at the superior interventricular groove (SIVG), inferior interventricular groove (IIVG), and right ventricular free wall (RVFW), with RVFW representing the mean of three measurement points; (C) MPR repeated along the left ventricular short-axis plane; (D) Measurements acquired at left atrioventricular groove (LAVG), right atrioventricular groove (RAVG), and anterior interventricular groove (AIVG). Please click here to view a larger version of this figure.

Figure 2: EAT thickness quantification on cardiac magnetic resonance (CMR). (A) Measurements acquired at LAVG, RAVG, and AIVG on four-chamber view; (B) Measurements obtained at SIVG, IIVG, and RVFW on short-axis view, with RVFW reported as the mean of three measurement points. Please click here to view a larger version of this figure.
5. EAT volume acquisition
- NCCT grayscale threshold segmentation algorithm
- Import the contiguous 1.0 mm slice thickness NCCT images (in DICOM format) from the local workstation into the 3D Slicer software by dragging and dropping the folder containing DICOM files directly into the main 3D Slicer window.
- Navigate to the Segment Editor module. Create a new segmentation mask. Select the Threshold segmentation tool and precisely set the threshold range to -150 to -50 HU17.
NOTE: The volumetric quantification of epicardial adipose tissue (EAT) is confined within anatomical boundaries defined by the pulmonary artery bifurcation superiorly and the apex of the left ventricle inferiorly12,18.The selected threshold range of -150 to -50 HU is designed to optimally isolate EAT by minimizing partial volume effects from adjacent tissues with slightly higher attenuation, such as myocardium or epicardial fluid. - Click the Apply button and click the Show 3D button to preview the initial "fat envelope".
- Use the Erase tool to carefully remove mediastinal and chest wall adipose tissues not connected to the epicardial fat across multiple orthogonal views (axial, sagittal, coronal).
NOTE: Pericardial calcifications (CT values significantly higher than -50 HU) are typically excluded by the initial threshold. Manually remove them from the fat mask if included due to partial volume effects.A representative example is provided in Figure 3. - Obtain the volume result (in mL) directly from the Segment Statistics module, which applies a calculation principle equivalent to Monte Carlo integration. OUTPUT: Total volume (mL)
- CMR method
- Import the 12-level short-axis cine stacks (slice thickness: 8 mm, gap: 0 mm) into the image analysis software.
- Manually trace the epicardial and pericardial contours on each slice at the end-diastolic phase.
- Generate the final fat mask.
- Apply the modified Simpson's rule to calculate the total EAT volume: EAT Volume = Σ (EAT Area × (Slice Thickness + Slice Gap))19. OUTPUT: Total volume (mL)
NOTE: If there is a 2 mm gap between the layers, corrections shall be made according to the actual spacing.
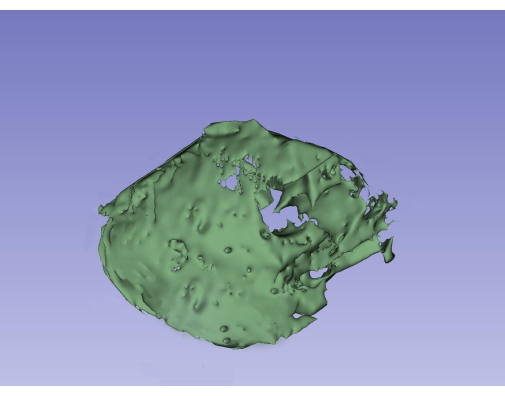
Figure 3: 3D reconstruction of Epicardial Adipose Tissue obtained by grayscale threshold segmentation algorithm. Note: This is a representative model for visualization, and as a schematic, it is not to scale. Please click here to view a larger version of this figure.
6. Statistical analysis
- Collect and analyze data using Python.
- Apply the Shapiro-Wilk test20for normality; report non-normally distributed continuous variables as median (interquartile range) [M (P25, P75)] with Mann-Whitney U test21for group comparisons, and express normally distributed data as mean ± standard deviation (x̄±s) analyzed by paired t-test22.
- Calculate the intraclass correlation coefficient (ICC) under a two-way random-effects model for absolute agreement, designating ICC > 0.75 as the threshold for good consistency between NCCT and CMR measurements.
- Consider differences statistically significant when the p-value is less than 0.05 (p < 0.05).
Access restricted. Please log in or start a trial to view this content.
Results
Loading...
$$\rightleftharpoonup{xx}$$
$$\longleftharp{xx}$$,
$$\longrightharp{xx}$$,
Table 1 presents the comparative analysis of EAT measurements between CT and MR modalities across all anatomical sites. Overall, the paired t-test demonstrated no significant differences (P > 0.05), supporting the equivalence of both methods. The mean differences (MR-CT) ranged from -0.10 mm (inferior interventricular groove) to +0.29 mm (left atrioventricular groove), with 95% confidence intervals consistently crossing zero. Volume measurements showed the smallest mean differen...
Access restricted. Please log in or start a trial to view this content.
Discussion
Loading...
$$\rightleftharpoonup{xx}$$
$$\longleftharp{xx}$$,
$$\longrightharp{xx}$$,
This finding demonstrates that, consistent with prior studies23, the right atrioventricular groove (RAVG) exhibits the thickest epicardial adipose tissue (EAT) among the six measured anatomical sites. This may be attributed to hemodynamic differences between the right and left cardiac systems. The right ventricle pumps blood into the low-resistance pulmonary circulation, while the left ventricle must overcome high-resistance systemic vasculature, generating significantly higher pressures. Chronic ...
Access restricted. Please log in or start a trial to view this content.
Disclosures
Loading...
$$\rightleftharpoonup{xx}$$
$$\longleftharp{xx}$$,
$$\longrightharp{xx}$$,
The authors declare that there are no conflicts of interest.
Acknowledgements
Loading...
$$\rightleftharpoonup{xx}$$
$$\longleftharp{xx}$$,
$$\longrightharp{xx}$$,
This research was supported by the Sichuan Medical and Health Care Promotion Institute Scientific Research Project (Grant No. KY2022SJ0307).
Access restricted. Please log in or start a trial to view this content.
Materials
| Name | Company | Catalog Number | Comments |
|---|---|---|---|
| 640-slice CT scanner | United Imaging | uCT 960+ | Established whole-organ volumetric CT with sub-millimeter isotropic resolution, enabling motion-free cardiac imaging and ultra-low dose tissue characterization. |
| 3.0 T MRI scanner | United Imaging | uMR 960+ | Advanced wide-bore platform delivering exceptional soft-tissue contrast for quantitative cardiac phenotyping and multi-parametric body composition analysis. |
| 3D Slicer | Open-source community | https://www.slicer.org/ | Free, open-source software for medical image analysis (segmentation, registration, 3D visualization). Supported by NIH. |
| PyTorch | Meta Platforms, Inc. | https://pytorch.org/ | Open-source deep learning framework with dynamic computation graphs, widely used for AI research and model deployment. Supports GPU acceleration. |
References
Loading...
$$\rightleftharpoonup{xx}$$
$$\longleftharp{xx}$$,
$$\longrightharp{xx}$$,
- Kunadian, V., et al. An EAPCI expert consensus document on ischaemia with non-obstructive coronary arteries in collaboration with European Society of Cardiology Working Group on Coronary Pathophysiology and Microcirculation endorsed by Coronary Vasomotor Disorders International Study Group. EuroIntervention. 16 (13), 1049-1069 (2021).
- Sharaf, B., et al. Adverse outcomes among women presenting with signs and symptoms of ischemia and no obstructive coronary artery disease: findings from the National Heart, Lung, and Blood Institute-sponsored Women's Ischemia Syndrome Evaluation (WISE) angiographic core laboratory. Am Heart J. 166 (1), 134-141 (2013).
- Shaw, L. J., et al. The economic burden of angina in women with suspected ischemic heart disease: results from the National Institutes of Health-National Heart, Lung, and Blood Institute-sponsored Women's Ischemia Syndrome Evaluation. Circulation. 114 (9), 894-904 (2006).
- Antoniades, C., et al. Perivascular adipose tissue as a source of therapeutic targets and clinical biomarkers. Eur Heart J. 44 (38), 3827-3844 (2023).
- Tinajero, M. G., Gotlieb, A. I. Recent developments in vascular adventitial pathobiology: the dynamic adventitia as a complex regulator of vascular disease. Am J Pathol. 190 (3), 520-534 (2020).
- Chong, B., et al. Epicardial adipose tissue assessed by computed tomography and echocardiography are associated with adverse cardiovascular outcomes: a systematic review and meta-analysis. Circ Cardiovasc Imaging. , (2023).
- Kim, H. M., et al. Epicardial adipose tissue thickness is an indicator for coronary artery stenosis in asymptomatic type 2 diabetic patients: its assessment by cardiac magnetic resonance. Cardiovasc Diabetol. 11, 83(2012).
- Wang, W., et al. Prognostic value of epicardial adipose tissue in heart failure with mid-range and preserved ejection fraction: a multicenter study. J Am Heart Assoc. , (2024).
- Krauz, K., et al. The role of epicardial adipose tissue in acute coronary syndromes, post-infarct remodeling and cardiac regeneration. Int J Mol Sci. 25 (7), 3583(2024).
- Mahajan, R., et al. Electroanatomical remodeling of the atria in obesity. JACC Clin Electrophysiol. 4 (12), 1529-1540 (2018).
- Tonet, E., et al. Coronary computed tomography angiography: beyond obstructive coronary artery disease. Life (Basel). 13 (5), 1086(2023).
- Zhihong, G., et al. Correlation analysis between epicardial adipose tissue and acute coronary syndrome. Sci Rep. 15 (1), 3015(2025).
- Yang, C. D., et al. Epicardial adipose tissue volume and density are associated with heart failure with improved ejection fraction. Cardiovasc Diabetol. 23 (1), 283(2024).
- International Commission on Radiological Protection. The 2007 recommendations of the International Commission on Radiological Protection. Ann ICRP. 37 (2-4), 1-332 (2007).
- Leiner, T., et al. SCMR position paper (2020) on clinical indications for cardiovascular magnetic resonance. J Cardiovasc Magn Reson. 22 (1), 76(2020).
- Liang, K. W., et al. MRI measured epicardial adipose tissue thickness at the right atrioventricular groove differentiates inflammatory status in obese men with metabolic syndrome. Obesity (Silver Spring). 20 (3), 525-532 (2012).
- Zhu, L., et al. Left ventricular myocardial deformation: a study on diastolic function in the Chinese male population and its relationship with fat distribution. Quant Imaging Med Surg. 10 (3), 634-645 (2020).
- Liu, J., et al. Epicardial adipose tissue density is a better predictor of cardiometabolic risk in HFpEF patients: a prospective cohort study. Cardiovasc Diabetol. 22 (1), 45(2023).
- Nelson, A. J., et al. Validation of cardiovascular magnetic resonance assessment of pericardial adipose tissue volume. J Cardiovasc Magn Reson. 11 (1), 15(2009).
- Shapiro, S. S., Wilk, M. B. An analysis of variance test for normality (complete samples). Biometrika. 52 (3-4), 591-611 (1965).
- Xie, J., Li, L. Comments on the utilization of Mann-Whitney U test and Kaplan-Meier method. J Gynecol Oncol. 32 (3), e46(2021).
- Zabell, S. L. On Student's 1908 article "The probable error of a mean.". J Am Stat Assoc. 1, 1-7 (2008).
- Schejbal, V. Epicardial fatty tissue of the right ventricle: morphology, morphometry and functional significance. Pneumologie. 43 (9), 490-499 (1989).
- Parisi, V., et al. Validation of the echocardiographic assessment of epicardial adipose tissue thickness at the Rindfleisch fold for the prediction of coronary artery disease. Nutr Metab Cardiovasc Dis. 30 (1), 99-105 (2020).
Access restricted. Please log in or start a trial to view this content.
Reprints and Permissions
Request permission to reuse the text or figures of this JoVE article
Request Permission