Primordial germ cells (PGCs) are the precursors to the germline. They are the first embryonic cell lineage to emerge, but among the last to differentiate, creating a barrier to studying early PGC differentiation. This study describes two innovative approaches for stable, inducible labeling of zebrafish PGCs and their germline progeny.
Method Article
Germ traCre and Germbow: Cre-Based Transgenic Lineage Tracing Systems to Examine Early Gametogenesis and PGC Germline Contributions in Zebrafish
In This Article
Summary
Abstract
Studies to date on reproductive development and gametogenesis in zebrafish have been limited by the availability of methods to visualize the developing germline. These include transient labeling approaches, such as injection of DNA or RNA encoding germline-localizing markers, or transgenic approaches that leverage germline promoters that are activated only after gonad formation. Degradation of injected elements before germline-specific zygotic promoter activation leaves a period when the early germ cells cannot be reliably labeled and tracked. To bridge this gap, Germ traCre and Germbow were developed: two Cre-based transgenic lineage tracing systems which provide the earliest inducible and targeted long-term labeling of germ cell precursors —primordial germ cells (PGCs) — and their progeny. It was recently demonstrated that the Germ traCre and Germbow systems are effective for investigating PGC differentiation and the establishment of the pre-gametic germline. This cell fate transition is critical for the formation of a functional vertebrate gonad but has largely been inaccessible. Using these systems, we lineage-traced early PGC contributions to the gonad and found that PGCs give rise to a more diverse repertoire of germ cell progeny than anticipated. It was further demonstrated that individual PGC contributions affect ovarian reserve composition and lifelong reproductive potential. Together, these systems permit access to gametogenesis from the earliest germ cell differentiation events to gamete maturation, making them useful systems for germline lineage tracing that can be applied to any stage of reproductive life. This article presents comprehensive protocols for clonal lineage tracing of zebrafish PGCs and their progeny in the developmental day 16 (d16) juvenile zebrafish gonad, as well as multispectral labeling and analysis of ovarian reserve composition in adult females. This study demonstrates how to use the systems and provide methods for staining, dissection, and imaging of the juvenile zebrafish germline.
Introduction
Primordial germ cells (PGCs) are the precursors to the germline. In many animals, the PGCs are the first cell lineage to be specified during early development, but among the last to differentiate. This temporal gap has presented a barrier to studying PGC differentiation and germline establishment. In zebrafish, PGCs are specified by maternal germ plasm in the first cell divisions, then migrate to the nascent gonad by 30 h post-fertilization (30 h)1 but only differentiate several days later2. Previous studies in teleost fish have leveraged the fusion of fluorescent markers to germ plasm control elements such as the nanos3,3’utr to restrict marker mRNA translation to the PGCs for efficient cell-type specific labeling (3,4,5,6, reviewed in7). However, injected or maternally-inherited mRNAs are transiently stable and degrade over time, limiting studies to the early events of PGC development. Examining PGC differentiation, which occurs between developmental days 7-14 (d7-14)2, required establishing more robust methods to label and lineage trace PGCs and their germline progeny. To bridge this gap, available genetic elements were leveraged to develop two inducible and indelible Cre-based transgenic lineage tracing systems – Germ traCre and Germbow – for clonal lineage tracing of PGC contributions to the germline in zebrafish8 (Figure 1A). Germ traCre is a single-color clonal labeling approach that can be combined with additional in situ labeling; Germbow provides multispectral clonal labeling for examination of individual PGC contributions. Together, these systems can be used to study germline development and reproductive longevity across juvenile and adult stages, providing labeling from d7 onward.
The genetic tractability, high fecundity, and rapid development of zebrafish offer an excellent system to study the genetic basis of germline development. To facilitate transgenic integration, the Germ traCre and Germbow constructs were cloned into Tol2 backbone vectors9,10,11,12, and stable transgenic lines were established8 (Figure 1A). For early transgene carrier identification, the Germ traCre and Germbow constructs also encode independent markers expressed by the heart promoter, cmlc210 (Figure 1A).
To achieve inducible labeling, a photoactivatable Cre (pACre)13 was used. The pACre sequence was cloned in frame with the nanos3,3’utr control element (pACre-nos3,3’utr) (Figure 1A), which restricts mRNA stability and translation to the PGCs4,6,14. pACre-nos3,3’utr mRNA was synthesized (Figure 1B) for transient expression. Injection of pACre-nos3,3’utr mRNA at the 1-cell stage and activation with blue light (Figure 1C) provides spatiotemporal control of Cre activity and transgenic marker expression initiation.
Germ traCre leverages the loxP-stop-loxP cassette and mCherry fluorescent marker from the Tol2 kit9,10,11,12, expressed under the germline-specific ziwi promoter15,16 (Figure 1A). Active Cre will excise the stop cassette and activate mCherry expression in the modified cells (Fig. 1C). Once activated, mCherry will be expressed in all of the germline progeny of labeled cells thereafter. Germbow was adapted from the Zebrabow system17,18 by combining the Zebrabow cassette with the germline-specific ziwi promoter15,16 to generate a germline-specific multispectral lineage tracing system (Figure 1D). The Zebrabow cassette contains three fluorescent markers, dTomato, CFP, and EYFP, flanked by two distinct flox sites17. Control cells express dTomato17; Cre activity induces random recombination at the loxP or lox2272 sites to produce cells expressing CFP or EYFP (Figure 1D,E). In transgenic lines with multiple copies of the transgene, the color repertoire of the system is expanded19 (Figure 1F). Random recombination of each copy produces a compound expression profile and enables more complex lineage tracing of progenitor cell contributions to tissues17,18 (Figure 1F,G).
Here, protocols for lineage tracing the contributions of PGCs to the early germline and adult ovary using the Germ traCre and Germbow systems are described. These methods include zebrafish embryo injection, in situ hybridization chain reaction (HCR), and immunohistochemistry (IHC) staining of d16 juvenile fish, dissection and mounting of d16 gonads, confocal imaging, and image analysis. Some methods contain techniques that have been modified from published protocols8 that have been optimized for use with these systems.
Protocol
All zebrafish (Danio rerio) procedures and experimental protocols were performed in accordance with NIH guidelines and were approved by the Icahn School of Medicine at Mount Sinai Institutional Animal Care and Use Committees (ISMMS IACUC; IPROTO202300000039). The following transgenic lines were used8: Tg[ziwi:stop-mCherry, pGH]mss24, and Tg[ziwi:Zebrabow, pBH]mss69. The reagents and the equipment used are listed in the Table of Materials.
1. Microinjection reagent preparation
- Prepare pACre-nos3,3’utr mRNA.
- Linearize pCSDest2-pACre-nos3,3'utr. In a 1.5 mL tube, mix at least 5 µg pCSDest2-pACre-nos3,3'utr with DraIII and MfeI enzyme and incubate at 37 °C to linearize. This will result in two products of 3423 bp and 2519 bp. The 3423 bp product contains the CMV IE94 promoter:pACre-nos3,3’utr sequence.
- Cast a fresh 0.8% agarose gel with Ethidium Bromide and a portion of the mixture with loading dye to confirm plasmid linearization. Isolate the desired gel band and purify the DNA using a commercial gel purification kit.
NOTE: Since only one fragment will produce viable mRNA, another option is to purify the DNA via ethanol precipitation. Briefly, add 0.1 vols 3 M NaAc (sodium acetate, pH 2), 0.05 vols 0.5 M EDTA (ethylenediaminetetraacetic acid, pH 8), and 2 vols 100% ethanol. Incubate the mixture at -20 °C for at least 15 min. Centrifuge at ≥14000 x g at 4 °C for 15 min, discard supernatant, dry pellet, then resuspend in 10 µL nuclease-free dH2O. This option recovers more purified DNA but includes the backbone fragment. - Transcribe mRNA using a commercial mRNA transcription kit and manufacturer's instructions. NanoDrop the mRNA and dilute to a concentration of 250 ng/µL.
- Cast a fresh 0.8% agarose gel with Ethidium Bromide and run 1 µL of the mRNA with loading dye to confirm the mRNA size of approximately 3000 bp.
- Prepare 1 µL aliquots in PCR tubes on ice and store at -80 °C for future use.
NOTE: Throughout mRNA synthesis, maintain RNase-free technique, including using filtered pipet tips, cleaning the benchtop surfaces and equipment, changing gloves often, wearing a face mask or performing the steps under a ventilation hood, using RNase-free tubes, and preparing fresh agarose gels and 1x TBE (Tris-Borate EDTA) buffer.
- Prepare zebrafish embryo media as described in the zebrafish book20.
- Cast an egg injection mold with 2% agarose gel in Embryo media: melt 2 g agarose in 100 mL Embryo media, pour ~30–40 mL into a new Petri dish, and gently float the injection mold on top.
NOTE: To prevent air bubbles from forming under the mold, wet the surface with Embryo media and angle the mold so it ‘rolls’ onto the molten agarose gel and displaces any air underneath. - Leave the gel to cool and solidify on the bench. Add a layer of Embryo media and wrap the edges with paraffin film to keep the gel hydrated. Store the plate in 4 °C or place the plate in the incubator for use the next morning.
NOTE: This injection mold can be reused many times and stored at 4 °C for several months, as long as the wells remain hydrated, intact, and free of any microbial growth. Prior to use, the mold should be covered with embryo medium and warmed in an incubator to prevent cold shock and abnormal development of the embryos.
- Cast an egg injection mold with 2% agarose gel in Embryo media: melt 2 g agarose in 100 mL Embryo media, pour ~30–40 mL into a new Petri dish, and gently float the injection mold on top.
- Prepare injection needles by pulling 1 mm capillary tubes with a needle-pulling machine. Pressure: 500, Heat: 754, Pull: 75, Velocity: 80, Time: 150.
2. Microinjection and pACre activation
- Set up breeding pairs and perform microinjection of zygotes as described previously21.
- Prepare the injection mix by combining 1 µL (250 ng) pre-aliquoted pACre-nos3,3’utr mRNA with 3.75 µL RNase-free dH2O and 0.25 µL phenol red for a final concentration of 50 ng/µL mRNA. Inject 1.5 nL of the solution into each zygote.
NOTE: Keep all mRNA reagents on ice to preserve integrity. Excess phenol red can be toxic to embryos. If excessive embryonic lethality is observed, reduce the phenol red amount. - Incubate injected embryos at 28.5 °C. A few hours post-injection, sort fertilized and unfertilized eggs. Incubate the surviving embryos, checking daily and removing any abnormal or dead embryos.
- At 30 h post-fertilization (30 h), dechorionate the embryos using two pairs of fine forceps. Cluster dechorionated embryos in the center of the plate and use a microscope with fluorescent lights to expose embryos to 470 nm blue light for 3 min. This will activate the pACre and initiate expression of mCherry in PGCs and their germ cell progeny.
NOTE: For effective photoactivation, embryos must be dechorionated. - At developmental day 2–5 (d2-5), use a dissection microscope with a fluorescence light source to sort transgenic fish via the heart markers expressed from the transgenic constructs. Fish with the Germ traCre transgenic construct will express GFP in the heart, and fish with the Germbow construct will express RFP in the heart.
- Raise the injected fish to the desired age according to the staging criteria described previously in the zebrafish book20. Germ traCre fish should be raised to d16 for clonal analysis of PGC differentiation2,8. To analyze reproductive aging and ovarian reserve composition, Germbow fish should be raised to adulthood8.
3. HCR and IHC labeling for Germ traCre PGC clonal lineage tracing
NOTE: The following protocol has been modified from the Molecular Instruments whole-mount in situ Hybridization Chain Reaction (HCR) and Immunohistochemistry (IHC) protocols22 for optimized labeling of germline in the d16 juvenile zebrafish gonad.
- Prepare in situ HCR and IHC buffers and reagents as described previously22. Specifically, prepare a stock of 4% PFA (paraformaldehyde), 1x PBS (phosphate buffer solution), 1x PBST (1x PBS with Tween 20 at 0.1% and 1%), Probe Hybridization Buffer, Probe Wash Buffer, Amplification Buffer, and 5x SSCT (5x saline sodium citrate with Tween 20 at 0.1%).
NOTE: Formaldehyde is a hazardous material and should be handled and disposed of with care. Probe hybridization buffer contains formamide, a hazardous material, and should be handled and disposed of with care. Probe wash buffer contains formamide, a hazardous material, and should be handled and disposed of with care.
4. Fixing juvenile samples
NOTE: For clonal lineage tracing of PGCs immediately following PGC differentiation, collect mosaically-labeled juveniles at d16.
- For euthanization, prepare a mating tank or shallow dish with approximately 50 mL 0.016% tricaine and a bucket of ice. See the zebrafish book for tricaine recipe20.
- Use a small net to transfer juveniles from their tank into the tricaine container and place the container on ice for approximately 10 min.
- Use a disposable transfer pipet to move the juveniles to a 1.5 mL tube and remove excess liquid. Add 1 mL of 4% PFA and place on a low-speed (~0.05 x g) shaker at room temperature (RT) for 2–4 h.
NOTE: Formaldehyde is a hazardous material and should be handled and disposed of with care. - Remove the 4% PFA and wash the samples for 5 min with 1x PBST (1%), repeat 4 times.
NOTE: If not planning to complete staining immediately, samples can be stored in methanol at -20 °C for future use. Before use, samples stored in methanol should be gradually rehydrated with a series of methanol: 1x PBS dilutions (3:1, 1:1, 1:3) for 5 min each, then washed in 1x PBS for 5 min twice before proceeding.
CAUTION: Methanol is a hazardous material and should be handled and disposed of with care.
5. In situ HCR and IHC
NOTE: All HCR probes, hairpins, and IHC antibody mixtures can be saved and stored at -20 °C, then reused up to 4 times.
Day 1
- Treat with Proteinase K mixture (2.5 µL NEB Proteinase K in 1 mL 1x PBST (1%)) for 5 min at RT.
NOTE: Treatment time will vary for different lots of Proteinase K; test and optimize the enzyme digestion time for specific conditions and samples. Prepare a fresh dilution before each use. - Rinse with 500 µL 1x PBST (1%) twice. Post-fix with 4% PFA for 5 min at RT to halt the Proteinase K enzyme activity and stabilize the tissue.
NOTE: Formaldehyde is a hazardous material and should be handled and disposed of with care. - Wash with 500 µL 1x PBST (1%) twice for 3 min. Meanwhile, heat Probe Hybridization Buffer (PHB) to 37 °C in the water bath.
NOTE: Probe hybridization buffer contains formamide, a hazardous material, and should be handled and disposed of with care. - Incubate in 250 µL PHB for 30min at 37 °C. Meanwhile, prepare probe mixtures. Combine 2–4 µL of each probe into 250µL PHB (8–16 nM).
NOTE: Incubation can be completed in a water bath or incubator. - Incubate in probe mixture at 37 °C overnight.
Day 2
- Heat Probe Wash Buffer (PWB) to 37 °C in the bath.
NOTE: Probe wash buffer contains formamide, a hazardous material, and should be handled and disposed of with care. - Save probe mixture in a 1.5 mL tube.
NOTE: Probe mixes can be stored at -20 °C and reused at least 4 times. - Wash samples in 250 µL PWB for 15 min at 37 °C, repeat 4 times. Meanwhile, prepare and snap cool hairpins. Per sample, mix 5 µL h1 and h2 in a PCR tube. Snapcool by heating at 95 °C for 90 s, then cooling in a dark container for at least 5 min. Mix with 250 µL Amplification Buffer once cooled.
- Wash samples with 500 µL 5x SSCT for 5 min at RT twice. Wash with 500 µL Amplification Buffer for 30 min at RT in a dark, static container.
- Incubate with the hairpin mixture overnight in a dark, static container.
Day 3
- Save the hairpin mixture in a 1.5 mL tube.
NOTE: Hairpin mixes can be stored at -20 °C and reused up to 4 times. Must be snap-cooled again before each use. - Do a series of washes with 500 µL 5x SSCT at RT for 5 min (x2), 30 min (x4), and 5 min.
- Wash with 500 µL 1x PBST (0.1%) for 5 min, repeat 3 times. Meanwhile, prepare blocking solution (5% Normal Goat Serum and 2% Bovine Serum Albumin in 1x PBST (0.1%)). Block for 2–4 h at RT.
- Meanwhile, prepare the primary antibody solution, as specified for each antibody. Anti-Ddx4 (Vasa) chicken antibody23 was prepared at a 1:2000 dilution in blocking solution.
- Incubate with primary antibody overnight at 4 °C.
NOTE: Alternatively, d16 samples can be incubated in the primary antibody mixture for 2 h at RT, then washed with 500 µL of 1x PBST (0.1%) for 10 min (x5).
Day 4
- Save the primary antibody mixture in a 1.5 mL tube.
NOTE: Primary antibody mixes can be stored at -20 °C and reused up to 4 times. - Wash with 500 µL of 1x PBST (0.1%) for 20 min at RT, repeat 6 times. Meanwhile, prepare the secondary antibody at a 1:500 concentration in blocking solution.
- Incubate with secondary antibody for 2 h at RT.
NOTE: Secondary antibody mixes can be stored at -20 °C and reused at least 4 times. - Wash with 500 µL of 1x PBST (0.1%) for 20 min at RT, repeat 6 times. Wash with 500 µL 1x PBST (0.1%) for 10 min at RT, repeat 4 times.
NOTE: To visualize cell nuclei, an additional step for DAPI or Hoechst staining should be included here if the mounting media does not contain DAPI.
6. Dissection and mounting of d16 gonads
- To dissect and mount stained d16 gonads, use a microscope with fluorescent light and two pairs of fine forceps, modified for microdissection.
- Prepare forceps by slightly bending the end of one forcep tip so it curves and touches the end of the other tip (Figure 2A).
NOTE: This was found to be a useful technique for dissecting microscopic tissues, as it helps prevent capillary action during handling. Fine needles may also be used instead of forceps to avoid capillary action. Store modified forceps with care to ensure shape and tip contact points are preserved. - Use a transfer pipet to move a sample to a glass plate in a drop of 1x PBS. Visually locate the Ddx4-positive germline marked with fluorescence (ideally in the 488 nm channel) (Figure 2B).
- Using forceps, pinch off the head above the heart and the tail below the gut (Figure 2B,C).
- Stabilize the trunk near the spine with one forcep and peel out the gut with the other forcep, keeping a close eye on the germline to ensure it remains intact (Figure 2D).
- Remove pieces of the dorsal spine region to minimize surrounding non-germline tissue (Figure 2E).
- Carefully remove the surrounding tissue using both forceps to pinch and peel off pieces. This allows the mounted tissue to be flayed open and exposes the gonads (Figure 2F,G).
- After cleaning the trunk tissue, prepare a microscope slide with a small drop of mounting media. If DAPI or Hoechst staining was not performed, use a mounting media with DAPI.
- Transfer the sample to the mounting media drop with forceps and gently tease it to flatten the tissue and expose the gonads on top (Figure 2H).
- Carefully place a coverslip over the sample, making microadjustments to ensure optimal exposure of the gonad. Confirm the gonad is lying flat and is visibly unobstructed by the surrounding somatic tissue (Figure 2I).
- Allow the slide to dry. Add clear nail polish to the edges of the cover slip to prevent evaporation of the mounting media and to preserve the slide. Once the nail polish dries, slides can be imaged or stored at 4 °C.
- Image using a confocal microscope with tile scanning and z-stack capabilities to capture the full gonad. See Pahima & Marlow8 for detailed microscope imaging settings.
7. Germbow multi-colored clonal lineage tracing via egg color analysis
- Raise Germbow fish to adulthood. Separate females at 2 months, when secondary sex traits are discernible, to prevent them from ovulating and mating.
- Prepare a stock solution of 20–100 mL 0.375% low melting point agarose (LMPA) gel in embryo media. Aliquot 1.5 mL into 2 mL microcentrifuge tubes and store in a cool, dry place.
- Once females are gravid (3–4 months), set up breeding pairs with dividers.
- In the morning, replace the water with fresh system water and remove the dividers to initiate spawning.
NOTE: Alternatively, egg retrieval can be performed by anaesthetizing females with 0.016% tricaine in fish water and gently squeezing out eggs for collection. See the zebrafish book for tricaine recipe20. - Collect eggs in a Petri dish using a disposable transfer pipette.
- Under a dissection microscope, transfer the freshly-laid eggs to a glass-bottom slide for imaging. Gently arrange eggs as a monolayer using the tip of a fine disposable transfer pipette and remove excess Embryo media.
NOTE: For clutches smaller than 800, arrange eggs to one side of the slide for a reduced tile scanning area and faster imaging. - Heat an aliquot of 0.375% LMPA and gently add a few drops on top of the egg layer until it is barely covered.
- Use a probe to gently roll all embryos to a lateral position so each animal pole is distinctly visible.
- Place the slide on a benchtop surface to cool and solidify for at least 5–10 min. Image using a confocal microscope with tile scanning. See Pahima & Marlow8 for detailed microscope imaging settings.
Results
The described methods enable efficient clonal lineage tracing of zebrafish PGCs to determine their contributions to the developing gonad and adult ovary. Injection of pACre-nos3,3’utr mRNA and activation at 30 h with blue light induces recombination and stable expression of the transgenic fluorescent markers in both systems (Figure 3A–D). The nos3,3’utr control element restricts pACre translation to the PGCs4,6,14, photoactivation induces pACre activity to a single timepoint13, and the ziwi promoter restricts the resultant marker expression to the germ cells15. Combined, these elements provide a spatiotemporally controlled system for germline-specific lineage tracing of PGC contributions to the germline.
Importantly, clonal labeling will vary both within and across individuals (Figure 3A–D). For Germbow in particular, transgene copy number, Cre efficacy, and random recombination are all factors that can contribute to the individual labeling profiles8,19. Multiple animals should be examined for sufficient coverage.
To confirm successful synthesis of pACre-nos3,3’utr mRNA, it is useful to run a portion of the mRNA through a fresh agarose gel with a DNA ladder to assess mRNA stability and size (Figure 1B). If the RNA appears as a smear, it is likely degraded and is unsuitable for injection.
Germ traCre
For efficient single-color clonal lineage tracing analysis, it is important to identify gonads with sparse mosaic labeling. To achieve sparse labeling, pACre-nos3,3’utr mRNA can be injected at a low concentration such that fewer PGCs will inherit the mRNA and undergo recombination (Figure 4A). Excess mRNA or examining gonads at later developmental stages can result in overlapping clones that cannot be distinguished based on color alone (Figure 4B). The pACre mRNA concentration and activation have been optimized for use in this protocol, but every gonad is variable, and sufficient numbers should be collected to ensure optimal labeling for analysis. In the experimental study8, 15 viable stained gonadal lobes with a total of 99 spatially-isolated clones were used for clonal lineage tracing analysis.
d16 was chosen for collection and observation to determine the immediate fates of differentiating PGCs, as PGC differentiation occurs by d142. By targeting the stage immediately post-PGC differentiation, 2–4 cell clones were captured, likely representative of the fates PGCs directly adopt as they differentiate. Because germline development is dependent on growth, age alone is not the most reliable indicator of developmental stage; therefore, the field generally uses larval size and age to reliably stage fish for reproductive studies24,25. To maintain consistency, only samples between 4–5 mm in size were collected and analyzed. Even so, gonadal lobes within the same animal can differ in size and clonal labeling efficiency (Figure 4C), and thus individual gonadal lobes from a single sample were analyzed separately.
HCR was used to examine the expression of germline markers, including the germ cell differentiation marker foxl2l (previously foxl3)26,27,28 (Figure 4C). IHC co-labeling with Ddx4 (Vasa) to mark the germline29 confirmed the germ cell identity of labeled cells and enabled visualization of the germline during dissection. Clone size, gonadal localization, and type (based on marker expression) were all quantified and analyzed. By comparing cell state marker expression across clones, at least four distinct immediate germ cell differentiation states were identified8. These findings suggested that individual PGCs contribute distinct cell types to the early gonad and can directly give rise to at least four distinct germ cell states, including GSCs. It was hypothesized that differential PGC contributions could influence early gonad development and reproductive potential over the lifetime. This led us to develop Germbow as a method to more comprehensively examine individual PGC contributions to long-term renewing versus transient progenitor populations throughout reproductive lifespan.
Germbow clonal egg analysis
Early collection of eggs from mosaic females, followed by rapid mounting and arrangement of eggs in the lateral position for imaging (Figure 5A–C), yields more consistent color comparison. After cells divide, subtle color variations arise between fertilized and unfertilized eggs that can impede egg color assignment (Figure 5D,E). Similarly, egg arrangement can affect image quality as eggs in different orientations are subject to less reliable color identification (Figure 5D,E). Thus, turning all eggs laterally in the LMPA enhances imaging efficiency and egg color analysis. Calibrating focal points across the plate in tile scanning also improves data acquisition and quality by ensuring that embryos are imaged at approximately the same sample depth of field. As mentioned previously, random recombination and variable recombination efficiency across and within individuals will produce distinct color profiles8, so eggs from multiple females should be examined (Figure 5D–F).
Regarding time-course mating assay imaging of Germbow eggs/embryos, image settings should be maintained across all clutches to ensure consistent color analysis. Exposure times can be calibrated using clutches with eggs expressing each of the three individual colors (dTomato, CFP, EYFP) (Figure 5E). Clutches with more egg colors can be used; however, calibrating with eggs with single-color expression ensures that the settings for each channel are sufficient to capture individual colors without overexposure.
For small clutches of less than 100 eggs, the ImageJ cell counter was used to manually quantify egg colors. For larger clutches, Biodock AI imaging software was used to expedite egg quantification. The software was trained on clutches with the highest number of egg colors to achieve multi-color recognition. All results were manually verified and corrected for accuracy.
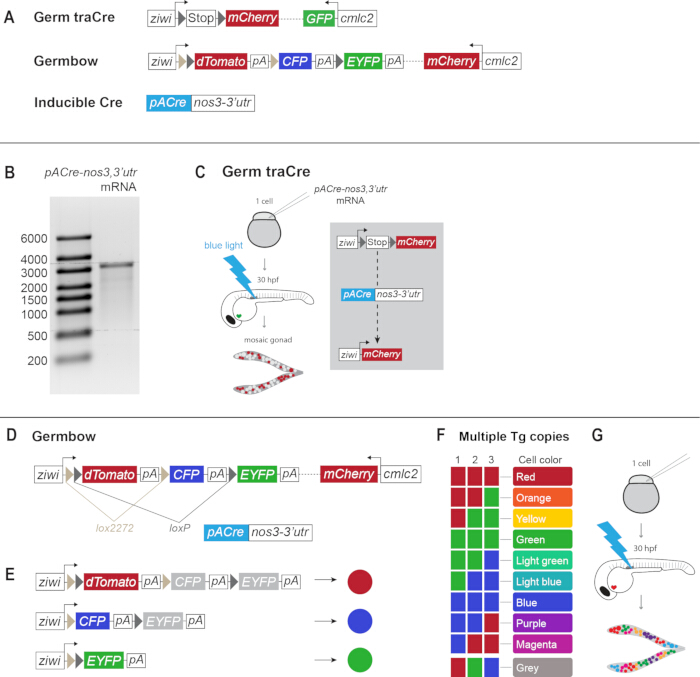
Figure 1: Transgenic lineage tracing systems for zebrafish germline lineage tracing. (A) Schematics of Germ traCre, Germbow, and pACre-nos3,3’utr constructs. (B) pACre-nos3,3’utr mRNA synthesis confirmation. Transcribed mRNA was run with the RiboRuler High Range RNA Ladder on a 0.8% agarose gel with ethidium bromide at 100 V for 1 h. mRNA measures approximately 3000 bp in length. (C) Injection of Germ traCre zygotes with pACre-nos3,3’utr mRNA and blue light photoactivation at 30 h induces Cre recombination and expression of mCherry to generate mosaic mCherry gonads. (D) Germbow contains lox2272 and loxP sites. (E) Unrecombined Germbow will express dTomato (red). Recombination at the lox2272 and loxP sites can produce single marker expressions of CFP and EYFP (blue and green, respectively). (F) In transgenic lines with multiple transgene copies, these colors can combine to produce a spectrum of different colors. With three copies of the transgene, at least 10 distinct colors can be produced. (G) Injection of the inducible Cre mRNA and photoactivation at 30 h produces multi-colored Germbow gonads. This figure is adapted from Pahima & Marlow8. Please click here to view a larger version of this figure.
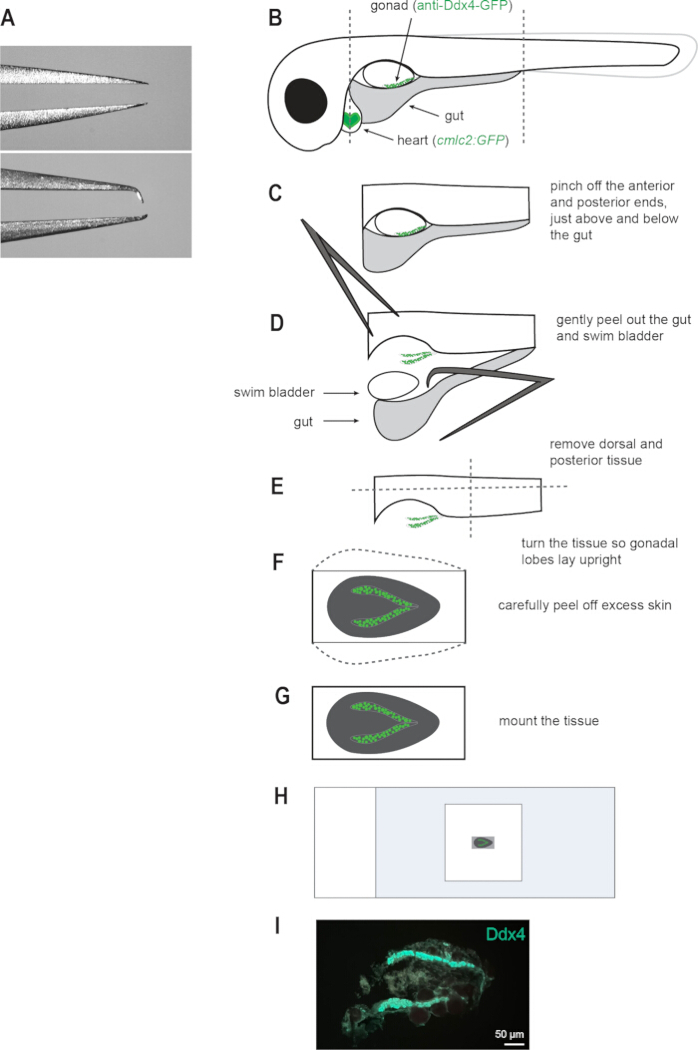
Figure 2: Dissection and mounting of Germ traCre d16 gonads. (A) Example standard forceps (top) and modified forceps (bottom) for microdissections. The modified tip is curved to create a pincer grip that is useful for micromanipulation and reduces liquid capillary action. (B–H) Schematics of d16 larvae gonadal dissections and mounting. The germline is labeled with anti-Ddx4 in the 488 channel (green) for easy visualization. (I) Representative image of whole mount gonad with surrounding somatic tissue for stabilization and positional reference. Germline labeled with anti-Ddx4 in the 488 channel (green). Scale bar: 50 µm. Please click here to view a larger version of this figure.
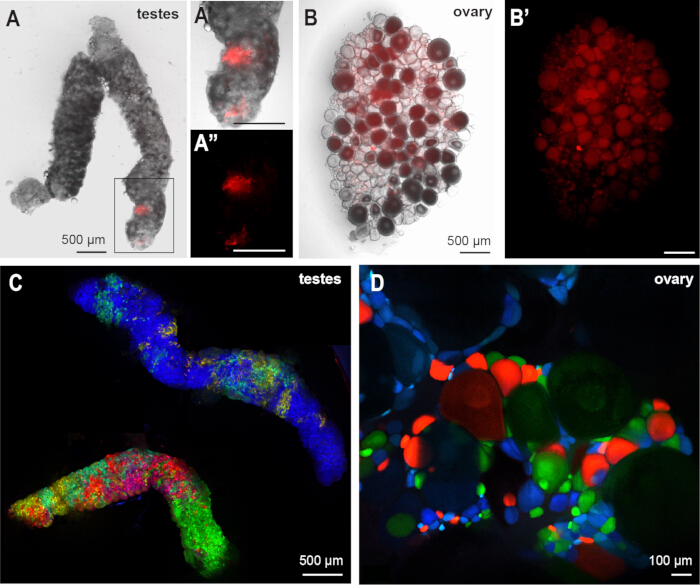
Figure 3: Germ traCre and Germbow adult gonadal labeling confirmation. (A-A”) Adult Germ traCre mosaic testes, bright field and mCherry (red) channels shown. Magnified region with mCherry+ clones shown. Scale bar: 500 µm. (B-B’) Adult Germ traCre mosaic ovary, bright field and mCherry (red) channels shown. Scale bar: 500 µm. (C) Highly variable testes from a single adult Germbow mosaic male with high recombination. Scale bar: 500 µm. (D) Germbow mosaic ovary showing color saturation differences between mitotic and meiotic cells, due to differences in ziwi expression across different germ cell stages. Scale bar: 100 µm. This figure is adapted from Pahima & Marlow8. Please click here to view a larger version of this figure.
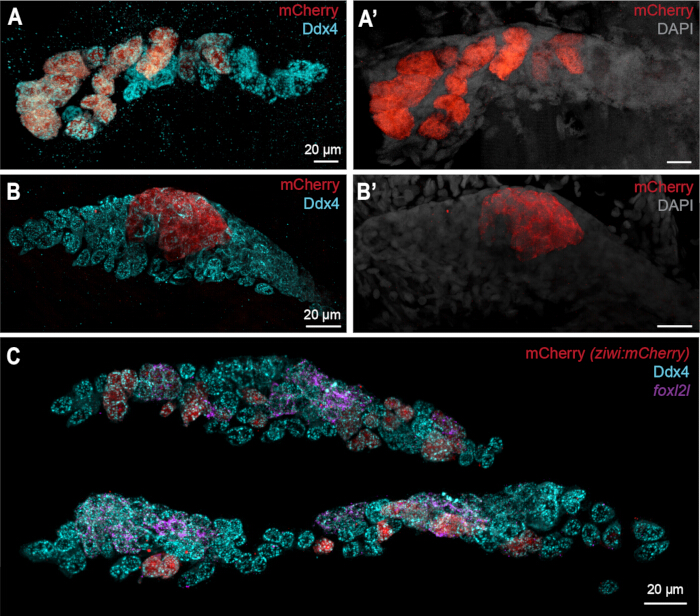
Figure 4: Germ traCre results. Comparison of the gonad with distinct mosaic transgenic mCherry (ziwi:mCherry) clonal labeling (A-A’) and the gonad with indistinct mCherry clonal labeling (B-B’). Germ cells labeled with anti-Ddx4 (blue), mCherry (red), and DAPI (grey). (C) Sample with both intact gonadal lobes demonstrating differences in lobe size within a single individual. Germ cells labeled with anti-Ddx4 (blue), mCherry (red), and foxl2l in situ HCR (purple). Scale bars: 20 µm. Please click here to view a larger version of this figure.
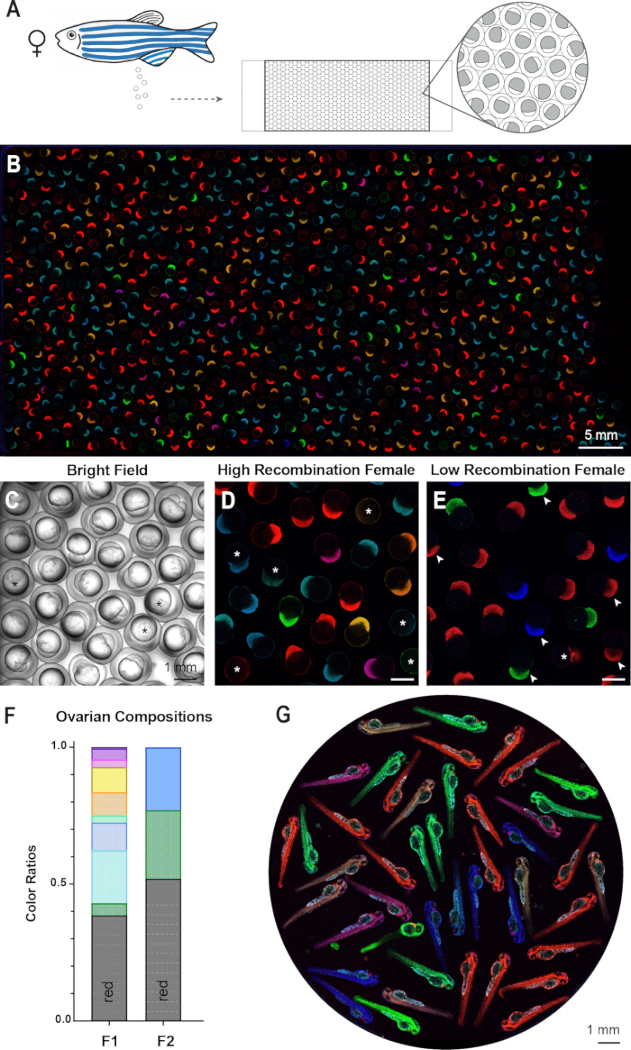
Figure 5: Germbow results. (A) Ovarian composition of each female Germbow mosaic is determined by collecting fresh egg clutches, either by mating assay or egg retrieval, arranging the eggs in a monolayer on a glass-bottom slide, and turning embryos laterally for best visualization. (B) Representative tile scan of a clutch of mosaic maternal fluorescence eggs from a high recombination female. Scale bar: 5 mm. Magnified examples of eggs imaged with bright field light (C), and fluorescence color imaging of eggs from a high recombination female (D), and a low recombination female (E). Scale bars: 1 mm. Eggs that are misoriented are marked with white asterisks (*). Unfertilized eggs next to fertilized embryos are indicated with white arrows. (F) Bar graph of egg color ratios quantified from clutches of mosaic Germbow females with high recombination (F1) and low recombination (F2). Colors correspond to egg colors observed. Red represents unrecombined eggs, which cannot be accounted for in clonal analysis. (G) Maternal egg colors can persist through at least day 2 of embryonic development. Scale bar: 1 mm. Please click here to view a larger version of this figure.
Discussion
Previous approaches for PGC and germline labeling relied on transient markers (such as injected dyes or reporter mRNAs) or limited germline promoters3,4,5 and left a gap between PGC establishment and their differentiation into germline fates of the pre-gametic gonad. The Germ traCre and Germbow systems leverage available, well-characterized genetic elements and combine them to bridge the PGC to germ cell transition. Both provide stable and inducible germline labeling for PGC lineage tracing.
Germ traCre is most suitable for mosaic analysis of isolated clones owing to its single-color nature; however, its limited color palette is advantageous for multiplex labeling using in situ HCR or IHC. On the other hand, Germbow, with its multi-colored labeling, provides specific, individualized lineage tracing of PGC contributions over the lifetime but is constrained in its multiplexing capacity. Specifically, the Germbow fluorophore wavelengths limit additional channels to far red or UV spectra, if not using DAPI in that range. Thus, Germbow does not replace Germ traCre, but rather augments the system by providing access to long-term renewal capacity in the context of reproductive lifespan.
Similarly, although egg color analysis would be possible using the Zebrabow system, Zebrabow is ubiquitous rather than cell-type specific, and thus analyses of early germline would be obscured by labeled (red) somatic gonad cells. By developing a germline-specific “bow” system, the system and targeted labeling were simplified to the tissue of interest. For in-depth technical considerations of multispectral lineage tracing systems, excellent resources exist for the Zebrabow system17,18.
By using pACre-nos3,3’utr mRNA, recombination is spatiotemporally restricted to the PGCs at 30 h. Thereafter, the maternal components degrade, thus ensuring recombination occurs only once and that germ cell colors are clonal and reflective of the original PGC. pACre is activated by blue light, which is highly efficient and less harmful than UV light13. However, if using the GFP-nos3,3’utr marker to label PGCs for precise, individual activation, visualization of the marker will activate the Cre recombinase. Thus, for targeting individual PGCs, a UV photoactivatable Cre should be used. Live imaging of germline development in vivo during juvenile stages has not yet been developed, but, when feasible, could be paired with these systems to advance the understanding of PGC colonization and contributions to the germline.
In our experience, the order of HCR and IHC staining was important for stability or detection of HCR probe signals, with some HCR probes sensitive to co-IHC labeling. Notably, for nanos2 HCR labeling completed in the original study8, the HCR must be completed before the IHC. Based on this sensitivity, the protocol is presented as HCR followed by IHC. However, other probes, including foxl2l, were not sensitive by IHC, so anti-Ddx4 IHC staining was performed before HCR labeling. For HCR probes that are not sensitive to IHC staining, the samples can be fixed, IHC-stained, and stored in methanol at -20 °C for future HCR labeling.
Proper dissection and mounting of the juvenile gonads is a critical process, and special care should be taken to ensure that the gonads are mounted whole and visually unobstructed. Importantly, when staining for the germline marker Ddx4 (Vasa), it is useful to have the staining in the 488 nm channel for easy visualization under a dissection microscope equipped with fluorescent lighting. It was observed that slightly curving the tips of fine forceps for micro-dissections reduces capillary action in liquid media and helps maintain control of the delicate tissues. The gonads at this stage are quite delicate and can easily tear; thus, it is most effective to mount the gonads with some surrounding tissue. The extra tissue serves two main functions: to stabilize the gonads when mounting, and to provide a reference for anterior-posterior/left-right positioning.
Germbow fluorescence does not appear to be fix-stable beyond 48 h. Samples for ovary or testis collection have been fixed overnight, then washed with PBS, dissected, mounted, and immediately imaged with success; however, storing samples in methanol post-fixation or waiting multiple days prior to imaging after mounting compromises the fluorescence. Thus, attempts to combine the available HCR and IHC protocols with this system have not been successful. Alternative staining techniques have not been tested.
Egg colors represent maternally-derived fluorescent proteins, which can persist for at least 2 days (Figure 5G). The colors represent gene products produced by the maternal genome during oogenesis and thus will not be fully represented in the zygotic genome of the offspring. This system can also be used to assess PGC contributions to early testis development and spermatogenesis; however, the long-term renewal potential of testis GSCs cannot be assessed because most proteins, including fluorescent markers, are not paternally inherited.
Disclosures
The authors declare that they have no competing interests.
Acknowledgements
We thank our animal care staff at the ISMMS Center for Comparative Medicine for providing excellent animal care of the zebrafish used in this work, and the ISMMS Microscopy and Advanced Bioimaging Core staff for their imaging expertise and assistance with confocal microscopy, supported with funding from NIH Shared Instrumentation Grant (FAIN: S10OD021838). Work in the Marlow laboratory is supported by startup funds to F.L.M. Research reported in this publication was supported by funding from the National Institute of General Medical Sciences (NIH-R01GM133896 and NIH-R35 GM153244 to F.L.M), the NY State Department of Health Training Program in Stem Cell Biology (NYSTEM-C32561GG to M.P.), and the Ruth L. Kirschstein Predoctoral NRSA from the Eunice Kennedy Shriver National Institute of Child Health and Human Development (NIH-1F31HD111230 to M.P.).
Materials
| Name | Company | Catalog Number | Comments |
|---|---|---|---|
| 0.01 micrometer calibration slide | AmScope | A36CALM1 | Microinjection droplet calibration. |
| 1.5 mL tubes | Any brand | -- | For mRNA synthesis, ensure RNase-free |
| Agarose | Fisher Scientific | IB70042 | |
| Amplification Buffer | Molecular Instruments | HCR (v3.0) kit | |
| Axio Zoom.V16 | ZEISS | -- | Fluorescent stereo microscope used for embryo heart marker sorting and live imaging. |
| Biodock | Biodock | -- | AI software platform used for Germbow egg counting. Biodock 2024, available from www.biodock.ai |
| Bovine Serum Albumin (BSA) | Sigma-Aldrich | A2153 | |
| Clear nail polish | Any brand | -- | |
| Cover glass slip (18x18 mm, 1 1/2 thickness) | Corning | 2850-18 | |
| Ddx4 (Vasa) anti-chicken | Gift from Dr. Bruce Draper | PMID: 30653507 | |
| DraIII | New England Biolabs (NEB) | R3510L | |
| Dumont #55 Forceps | Fine Science Tools | 11255-20 | Microdissections. Can modify shape as described. |
| Egg injection mold | -- | -- | custom 3D print. |
| Electrophoresis gel equipment | Any brand | -- | |
| Ethidium Bromide | Fisher Scientific | BP1302-10 | |
| FemtoJet 4i microinjection machine | Fisher Scientific, Eppendorf | 5252000013 | |
| Filtered pipette tips | Any brand | -- | |
| Fine painting brush | Any brand | -- | For arranging eggs within injection mold wells. |
| foxl2l HCR probe | Molecular Instruments | PRD331 | |
| Glass bottom slides | Ibidi | 82107 | For Germbow egg mounting and imaging. |
| Gloves | Any brand | -- | |
| Halocarbon oil | Sigma-Aldrich | H8898 | Microinjection droplet calibration. |
| HCR hairpins | Molecular Instruments | -- | |
| Imaris 10.1 | Oxford Instruments | -- | Microscopy imaging software for analysis. Used for Germ traCre clonal analysis. |
| Imaris Viewer 10.1.0 | Oxford Instruments | -- | Microscopy imaging software for viewing. Used for general visualization of data. |
| Incubator | Any brand | -- | Maintain embryos at 28.5 °C. |
| LAS X | Leica | -- | Microscopy imaging software. Used for Germbow egg data collection. |
| Leica TCS SP8 STED 3x | Leica | -- | Confocal microscope used for Germbow egg imaging. Equipped with Argon laser and White Light Laser. |
| Low melting point agarose | Sigma-Aldrich | A9414 | To stabilize Germbow eggs in mounting |
| Methanol | Fisher Scientific | A454-4 | |
| MfeI | New England Biolabs (NEB) | R0589S | |
| Microloader pipette tip | Fisher Scientific, Eppendorf | 05-413-932 | |
| Micropipette | Any brand | -- | |
| Micropipette puller | Sutter Instrument Co. | Model P-97 | |
| Micropipettes | Any brand | -- | |
| Microscope slides, precleaned (75x50x1 mm) | Fisher Scientific | 12-550C | Used as surface for microdissection. |
| Microwave | Any brand | -- | |
| Milligram scale | Any brand | -- | |
| mMESSAGE mMACHINE SP6 Transcription Kit | Invitrogen | AM1340 | mRNA transcription |
| NanoDrop spectrophotometer | Any brand | -- | |
| Normal Goat Serum (NGS) | MP Biomedicals | 8642921 | |
| Olympus SZ51 on mirror base | Evident (Olympus) | -- | Stereo microscope used for embryo sorting and egg mounting. |
| Parafilm | ibis Scientific | PM992 | |
| Paraformaldehyde (PFA) | Fisher Scientific | NC0775199 | |
| pCSDest2-pACre-nos3,3'utr | Addgene | 226790 | Cloned in lab and provided to Addgene. PMID: 42403048 |
| Petri dishes | Fisher Scientific | FB0875713 | |
| Phenol red | Sigma-Aldrich | P0290 | |
| Probe Hybridization Buffer | Molecular Instruments | HCR (v3.0) kit | |
| Probe Wash Buffer | Molecular Instruments | HCR (v3.0) kit | |
| Prolong Diamond with DAPI | Invitrogen | P36971 | |
| Proteinase K | New England Biolabs (NEB) | P8107S | |
| pTol2-ziwi:loxp-stop-loxp-mCherry; cmlc2:gfp | Addgene | 226785 | Cloned in lab and provided to Addgene. PMID: 42403048 |
| pTol2-ziwi:Zebrabow; cmlc:mCherry | Addgene | 226787 | Cloned in lab and provided to Addgene. PMID: 42403048 |
| QIAquick Gel Extraction Kit | Qiagen | 28704 | |
| RiboRuler High Range RNA Ladder | Thermo Scientific | SM1821 | |
| Squeeze wash bottle with bent neck | Any brand | -- | |
| Tg[ziwi:stop-mCherry, pGH], mss24 | Marlow lab | mss24 | Generated in lab. PMID: 42403048 |
| Tg[ziwi:Zebrabow, pBH], mss69 | Marlow lab | mss69 | Generated in lab. PMID: 42403048 |
| Thin Wall Glass Capillaries | World Precision Instruments, Inc. | TW100F-4 | For microinjection needles. |
| Transfer pipette | Any brand | -- | |
| Tricaine | Sigma-Aldrich | A5040-100G | |
| Tween 20, pur | Cole-Parmer | AC23336-0010 | |
| UltraPure DNase/RNase-Free Distilled Water | Invitrogen | 10977015 | RNase-free dH2O for mRNA synthesis and dilution |
| Unifrost microscope slides | Azer Scientific | EMS200W | |
| Water bath | Any brand | -- | |
| ZEISS LSM980 with Airyscan II | ZEISS | -- | Confocal microscope used for Germ traCre imaging. |
| ZEN Pro | ZEISS | -- | Microscopy imaging software. Used for Germ traCre clonal data collection. |
References
- Raz E. Primordial germ-cell development: the zebrafish perspective. Nat Rev Genet. 2003;4(9):690-700.
- Bertho S, et al. Zebrafish dazl regulates cystogenesis and germline stem cell specification during the primordial germ cell to germline stem cell transition. Development. 2021;148:187773.
- Köprunner M, Thisse C, Thisse B, Raz E. A zebrafish nanos-related gene is essential for the development of primordial germ cells. Genes Dev. 2001;15:2877-2885.
- Saito T, et al. Visualization of primordial germ cells in vivo using GFP-nos1 3′UTR mRNA. Int J Dev Biol. 2006;50:691-700.
- Gross-Thebing T, et al. The vertebrate protein Dead End maintains primordial germ cell fate by inhibiting somatic differentiation. Dev Cell. 2017;43:704-15.e5.
- Campbell PD, Chao JA, Singer RH, Marlow FL. Dynamic visualization of transcription and RNA subcellular localization in zebrafish. Development. 2015;142:1368-1374.
- Marlow FL. Maternal control of development in vertebrates: my mother made me do it! Vol. 1. Morgan & Claypool Life Sciences; 2010: DOI: 10.4199/C00023ED1V01Y201012DEB005.
- Pahima M, Marlow FL. Primordial germ cells differentially contribute to the germline in zebrafish. Development. 2026; 153(15):dev204904.
- Kawakami K. Tol2: a versatile gene transfer vector in vertebrates. Genome Biol. 2007;8. doi:10.1186/gb-2007-8-s1-s7.
- Kwan KM, et al. The Tol2kit: a multisite gateway-based construction kit for Tol2 transposon transgenesis constructs. Dev Dyn. 2007;236:3088-3099.
- Suster ML, Kikuta H, Urasaki A, Asakawa K, Kawakami K. Transgenesis techniques: principles and protocols. In: Cartwright EJ, editor. 2009. p. 41-63.
- Villefranc JA, Amigo J, Lawson ND. Gateway compatible vectors for analysis of gene function in the zebrafish. Dev Dyn. 2007;236:3077-3087.
- Kawano F, Okazaki R, Yazawa M, Sato M. A photoactivatable Cre-loxP recombination system for optogenetic genome engineering. Nat Chem Biol. 2016;12:1059-1064.
- Kosaka K, Kawakami K, Sakamoto H, Inoue K. Spatiotemporal localization of germ plasm RNAs during zebrafish oogenesis. Mech Dev. 2007;124(4):279-289.
- Leu DH, Draper BW. The ziwi promoter drives germline-specific gene expression in zebrafish. Dev Dyn. 2010;239:2714-21. doi:10.1002/dvdy.22404.
- Tan CH, et al. Ziwi, the zebrafish homologue of the Drosophila piwi: co-localization with vasa at the embryonic genital ridge and gonad-specific expression in the adults. Mech Dev. 2002;119.
- Pan YA, et al. Zebrabow: multispectral cell labeling for cell tracing and lineage analysis in zebrafish. Development. 2013;140:2835-2846.
- Nguyen PD, Currie PD. Guidelines and best practices in successfully using Zebrabow for lineage tracing multiple cells within tissues. Methods. 2018;150:63-67.
- Livet J, et al. Transgenic strategies for combinatorial expression of fluorescent proteins in the nervous system. Nature. 2007;450(7166):56-62.
- Westerfield M. The zebrafish book: a guide for the laboratory use of zebrafish (Danio rerio). 4th ed. Eugene (OR): University of Oregon Press; 2000.
- Silic MR, Zhang GJ. Visualization of cellular electrical activity in zebrafish early embryos and tumors. J Vis Exp. 2018;(134):57330.
- Choi HMT, et al. Mapping a multiplexed zoo of mRNA expression. Development. 2016;143(19):3632-3637.
- Knaut H, Pelegri F, Bohmann K, Schwarz H, Nüsslein-Volhard C. Zebrafish vasa RNA but not its protein is a component of the germ plasm and segregates asymmetrically before germline specification. J Cell Biol. 2000;149:875-888.
- Parichy DM, Elizondo MR, Mills MG, Gordon TN, Engeszer RE. Normal table of postembryonic zebrafish development: staging by externally visible anatomy of the living fish. Dev Dyn. 2009;238(12):2975-3015.
- Singleman C, Holtzman NG. Growth and maturation in the zebrafish, Danio rerio: a staging tool for teaching and research. Zebrafish. 2014;11(4):396-406.
- Hsu CW, et al. Single-cell transcriptomes of zebrafish germline reveal progenitor types and feminization by Foxl2l. Elife. 2025;14:e100204.
- Liu Y, et al. Single-cell transcriptome reveals insights into the development and function of the zebrafish ovary. Elife. 2022;11:e76014.
- Ren Z, et al. Foxl2l is a germ cell-intrinsic gatekeeper of oogenesis in zebrafish. Zool Res. 2024: 45(5):1116–1130.
- Raz E. The function and regulation of vasa-like genes in germ-cell development. Genome Biol. 2000; 1 (3):reviews1017.