This study presents optimized protocols for performing real-time metabolic analysis of Mito Stress and Glycolysis Stress Tests simultaneously on the same plate. The procedures are tailored for both adherent (BMDMs) and non-adherent (lymphocytes) cells, enabling accurate, reproducible, and parallel assessment of mitochondrial and glycolytic function of cells of interest.
Method Article
Single-plate Runs of Mito Stress And Glycolysis Stress Tests using Adherent or Non-Adherent Cells
In This Article
Summary
Abstract
Real-time metabolic analysis provides label-free measurements of mitochondrial respiration and glycolysis, allowing researchers to link cellular energy metabolism with disease mechanisms and therapeutic responses across diverse fields. When comparing energy metabolism across different mice, other animals, humans, or cells under varying treatments, it is crucial to perform measurements within a single run to ensure accurate and reliable results. Moreover, experimental design must consider the cell type being analyzed, for example, whether they are adherent, like bone marrow-derived macrophages (BMDMs), or non-adherent, like lymphocytes. Therefore, a protocol was developed that enables the simultaneous performance of Mito Stress and Glycolysis Stress tests on the same plate, despite the assays requiring distinct drug injections and analytical programs. Separate handling protocols were optimized for analysis of both highly adherent cells (e.g., BMDMs) and non-adherent “floating” cells (e.g., T cells and other lymphocytes). Here, detailed protocols for conducting these assays efficiently and reproducibly are presented.
Introduction
The Seahorse XF Analyzer is a unique instrument that enables real-time measurement of mitochondrial respiration and glycolysis in many cell types. By simultaneously quantifying oxygen consumption rate (OCR) and extracellular acidification rate (ECAR), this technology allows precise dissection of bioenergetic pathways under physiological or stress conditions. Its versatility has made it indispensable across diverse research areas, including cancer1, neuroscience2, immunology3, aging3,4,5, and drug discovery6, where metabolic reprogramming is a hallmark of disease progression and therapeutic response. By linking functional bioenergetics to cellular phenotypes7,8, analysis provides a powerful platform for uncovering mechanisms, identifying metabolic vulnerabilities, and evaluating the effects of genetic or pharmacological interventions.
In many disciplines, comparing the immediate effects of drugs, small molecules, cytokines, or natural compounds on cellular metabolism is best performed under identical experimental conditions, the same plate, incubation time, environmental parameters, and time of day. Accordingly, this approach is to plate cells with different treatments or genetic backgrounds on the same plate and analyze for multiple metabolic parameters simultaneously. This strategy ensures the most accurate comparison of drug- or genetics-related changes in cellular energy metabolism.
Many cell types behave differently in culture. Lymphocytes remain in suspension and never attach to the plate9, macrophages adhere strongly, making them difficult to transfer, and cancer cells proliferate rapidly but at varying rates depending on the line. These differences present challenges for real-time metabolic analysis; therefore, each cell type in the experiment requires a tailored protocol.
This article provides step-by-step protocols for performing these assays using real-time metabolic analysis, ensuring efficiency and reproducibility. These protocols can be applied to all versions of analyzers available on the market.
Protocol
Mice were cared for in accordance with the procedures outlined in the National Institutes of Health and Institutional Animal Care and Use Committee (IACUC) protocol at Meharry Medical College. This institution is accredited by the Association for Assessment and Accreditation of Laboratory Animal Care International and complies with the Public Health Service Policy for the treatment and use of laboratory animals under pathogen-free conditions. The details of the reagents and the equipment used are listed in the Table of Materials.
1. Optimization for cell density
NOTE: Each cell type exhibits unique metabolic characteristics and considerable variation in size. Both factors are critical in determining the appropriate number of cells to load per well to obtain optimal results. Before running an initial experimental assay, prepare and run a test plate with the chosen cells of interest plated at varying densities.
- For adherent cells (e.g., cancer cells), test the seeding densities ranging from 20,000–100,000 cells per well. For highly metabolic and/or large cells (e.g., human cancer cells or fibroblasts), density optimization begins at 10,000 cells or fewer per well.
- For non-adherent cells (e.g., lymphocytes), optimize the seeding density within the range of 100,000–500,000 cells per well. For all cell types, aim for a uniform single-cell monolayer to achieve optimal results (refer to Figure 1 for example plate layout of samples).
- Run the Mito Stress assay (as below). Data from this preliminary assay can be used to determine the optimal cell density for the main experiment. Select the density that shows the greatest difference between assay conditions.
NOTE: This protocol does not apply to the analysis of 3D samples (e.g., cell spheroids, organoids). It can be modified, however, to account for the sample thickness and uneven surface.
2. Preparation for the assay
- On the day before running the assay, gently lift the sensor cartridge out of the utility plate and add 200 µL of RNAase/DNAse-free water to each well of the utility plate, and lower the sensor cartridge into the utility plate until sensors are completely submerged in water.
NOTE: The water level must be high enough to make sure sensors are completely submerged overnight, as the sensor cartridge fluorophores will not work if not properly hydrated. If using an XF Hydrobooster to hydrate the cartridge, the cartridge can be put directly in calibrant solution and the water hydration step excluded. - Place the hydrated sensor cartridge/utility plate in a 37 °C CO2-less incubator overnight. To prevent evaporation from the plate, also place a container with double-distilled water into the incubator.
- On the day of the assay, remove the sensor cartridge/utility plate from the CO2-less incubator and gently remove the sensor cartridge from the utility plate, placing the cartridge sensor-side up on the bench.
- Discard the water from the utility plate and shake dry of any loose droplets, and add 200 µL of XF Calibrant Solution to each well.
- Gently place the sensor cartridge back in the utility plate so that the sensors are completely submerged in calibrant solution, and place it back in the 37 °C CO2-less incubator.
3. Assay media preparation
- Mito Stress media preparation:
- In a 50 mL tube, add the following to 45 mL of XF RPMI medium: 500 µL of 100x sodium pyruvate (final concentration: 1 mM), 500 µL of 100x L-glutamine (final concentration: 2 mM), and 550 µL of 45% glucose solution (final concentration: 25 mM)
- Adjust the pH to 7.4. Top up with XF RPMI medium to a final volume of 50 mL. Keep the prepared medium in a 37 °C water bath or dry bath prior to using.
- Glycolysis assay media preparation:
- In a 50 mL tube, add 250 µL of 100x L-glutamine to 45 mL of XF RPMI medium.
- Adjust the pH to 7.4, then top up with XF RPMI medium to a final volume of 50 mL. Keep the prepared medium in a 37 °C water or dry bath prior to using.
NOTE: The pH of both Mito Stress and Glycolysis assay media must be readjusted to 7.4 after adding supplements that alter pH, as even small deviations can significantly affect assay results.
4. Washing cells and changing media prior to analysis
NOTE: The washing step of XFe96/XF Pro Cell Culture Microplates will vary depending on whether using adherent or non-adherent cell types. Please refer to step 9, Adherent (cancer cells, primary BMDMs cells) and non-adherent cells (T cells and other lymphocytes), to determine the best washing method for the cell type used.
- Remove 160–180 µL of growth media from each well using a multi-pipettor, working one row/column at a time to prevent cells from drying. Avoid touching the bottom of the wells.
- Using a single-tip pipetman, remove the remaining 20–30 µL from the wells, avoiding touching the cell layer at the bottom of the well.
- Add 180 µL of Glycolysis or Mito Stress assay media (see step 3) to each well, following the layout in Figure 1. To avoid disturbing the cell layer, gently dispense the media along the side wall of each well until all wells are filled. Both assays are in the same plate.
NOTE: The wells that do not contain cells and control wells must also be filled with assay media. - Place the microplate into a 37 °C CO2-less incubator for 40–45 min prior to starting the assay, and start preparing the drugs.
5. Drug preparation and loading the cartridge
CAUTION: Some drugs (FCCP, Antimycin A/ Rotenone, Oligomycin) are hazardous and should be handled with care. Appropriate measures are needed to protect personnel; these include the use of gloves and other personal protective equipment (PPE) as well as disposing of materials in an institution-approved chemical waste bin or container.
NOTE: Optimal FCCP/oligomycin concentration is cell type–dependent and prior to the assay, empirically titrated when working with particularly sensitive cells. Final concentrations may vary for drugs depending on cell type. Prepare drugs and assay media fresh on the day of use. Do not freeze or reuse. Assay drug preparation can be completed within this 45-min time period for optimal results.
- Using the pre-warmed Mito Stress and Glycolysis Assay media from step 3, dilute the compounds according to Table 1 and/or Table 2 to the concentrations appropriate for each cell type. Prepare each compound in a separate 15 mL tube (if using all six compounds, six tubes will be needed).
- Remove the sensor cartridge/utility plate from the 37 °C CO2-less incubator and remove the lid, carefully placing the XF loading guide provided with the kit, the XF loading guide corresponding to the injector port (Guide A for Port A) securely above the top of the sensor cartridge (refer to Figure 2).
- Using a multichannel pipettor and reagent reservoir for each drug, slowly add the volume needed to the corresponding port (refer to Table 1 and Table 2 for volume). Hold the pipettor strictly upright when loading the drugs (refer to Figure 2).
- Change out or reuse after thoroughly rinsing and drying the loading guide as needed for each port (Port A, B, C, and D) and discard pipette tips after each load.
NOTE: Pipette tips are to fit firmly in the guide port, but not too tightly, as the pipette tips may become stuck in the guide! It is recommended to test out the pipette tips/pipettor used on the guides before loading the compounds to avoid misloading samples. - After loading all compounds into their respective ports, remove the guide, visually confirm that all ports are filled, and secure the cartridge with its lid. Drugs should correspond to the assay in each part of the same plate (Figure 1).
NOTE: Final well concentrations recommended for Mito Stress are 1 µM oligomycin, 1 µM FCCP, and 0.5 µM Rotenone/Antimycin; for Glycolysis, 10 mM glucose, 1 µM oligomycin, and 50 mM 2-DG.
6. Setting up the Seahorse XFe96 analyzer
- Turn on the analyzer and open the WAVE software (refer to Figure 3).
- Select XF Mito Stress Test.
NOTE: As long as the appropriate assay media and compounds are used, the analyzer can simultaneously perform both mitochondrial and glycolysis tests on the same plate using XF Mito Stress Test. - Select the number of ‘Groups’ based on the plate setup and label each group. Proceed to the next tab to assign wells for the plate map (refer to Figure 3). Both assays are done in the same plate.
- Highlight the wells for each Group based on how the plate is loaded.
- Adjust the program according to the cell type and experimental purpose. For example, if the setup includes a preactivated group before analysis or an activator is added during the run, extend the incubation time in each cycle to allow activation to occur.
- Select the next tab, ‘Run Assay’ and fill in the information as needed to save the data file.
- Load the pre-hydrated cartridge with drugs (from step 5) into the machine when indicated for initialization. The initialization step will indicate if sensors are properly hydrated and functional.
- Start the assay and load and unload the plates as indicated by the prompts during the program.
NOTE: When loading the cartridge or microplate into the analyzer, make sure all lids are removed! While some analyzer models have a safety feature that can sense lids, earlier models do not. This may damage the machine if the lid is intact during a plate run.
7. Normalization methods: (SRB) and nuclear count (DAPI staining and imaging)
CAUTION: Some reagents in the SRB assay kit are corrosive and will burn if in contact with skin. DAPI may cause an allergic skin reaction. The use of gloves and other PPE is recommended, as is the disposal of materials in an institution-approved chemical waste bin or container.
NOTE: Select the normalization method based on the characteristics and pretreatments of the analyzed cells. Either method is suitable when comparing cells with different proliferation rates, as both methods account for such variations. However, if drug treatments induce senescence, halting proliferation while increasing cell size, DAPI staining is the preferred normalization approach. DAPI may not be suitable for cell types where nuclear staining is difficult to visualize (i.e., adipocytes, erythrocytes) or cells may be multinucleated (i.e., parenchymal hepatocytes, myocytes).
- To normalize cells using the SRB assay (Sulfohodamine B Cell Cytoxicity Assay Kit) after real-time metabolic analysis, remove the plate from the machine and add ¼ of the media volume (eg, 50 µL in 200 µL of culture medium) of the Fixation Solution to each well.
- Incubate at room temperature for 1 h or overnight at 4 °C.
- Remove the solution and gently wash the wells three times with 200 µL of RNase/DNase-free water, taking care not to disturb the cell layer. For short-term storage (if needed), replace the final wash with PBS and store at 4 °C.
- For immediate normalization using the SRB assay, remove the wash solution and allow the plate to air-dry completely at room temperature.
- Add 25 µL of SRB Solution to each well and stain for 15 min at room temperature in the dark or wrap the plate in aluminum foil during the incubation period.
NOTE: SRB solution is light sensitive, and this part of the experiment must be performed in a low-light area. - Remove the staining solution and add 100 µL of 1x Washing Solution to wash each well 2–3 times.
- Wash as quickly as possible to avoid bleaching and remove wash solutions as much as possible by vacuum suction.
- Add 100 µL of 1x Solubilization Solution to each well and place the plate on a shaker for 10 min at room temperature.
- Measure the Optical Density (O.D.) at 565 nm on a plate reader to determine well density based on color saturation (see Figure 3 for visual reference).
- Export the O.D. values data as an Excel file. This spreadsheet will be pasted into the WAVE software for normalization (step 8).
NOTE: If intense color is observed (> O.D. 3.5) due to cell overload, a suboptimal wavelength (e.g., 490–530 nm) may be used to lower the readings back into the instrument's linear range. Correct background by subtracting the O.D. of the control containing only the culture medium (background control well) from all samples’ readings.
- For DAPI stain, dilute the DAPI stock solution to 300 nM in 1x PBS.
- Wash each well of the cell plate 3 times gently with 200 µL 1x PBS.
NOTE: If there are non-adherent cells, centrifuge the plate at 200 x g for 3 min with no brake to ensure cells are suspended at the bottom of each well after each wash step. - Fix cells in 2%–4% PFA diluted in 1x PBS for 10–15 min at room temperature.
- Wash each well of the cell plate 3 times gently with 200 µL 1x PBS.
- Add approximately 150 µL of this dilute DAPI staining solution to each, making certain that the cells are completely covered in each well.
- Incubate 1–5 min at room temperature in a low-light area (or cover plate in aluminum foil).
- Remove DAPI stain solution from each well.
- Wash each well of the cell plate 3 times gently with 200 µL 1x PBS.
- Remove any remaining PBS.
- Image the cells at any Excitation/Emission between 358–461 nm or under any DAPI filter setting on a microscope.
- Export the emission values data as an Excel file. This spreadsheet will be pasted into the WAVE software for normalization (step 8).
- Wash each well of the cell plate 3 times gently with 200 µL 1x PBS.
8. Analysis and normalization of the data
NOTE: For the analysis of data, “Wave” or other software can be used. The protocol provided is applicable to the Wave software.
- Open the results of the analysis in Wave (refer to Figure 3). Normalization is performed using values obtained from the Excel file generated by the microplate reader after SRB staining (step 7).
- Click on “Normalize”.
- In the open window, choose “select all” followed by “paste” to paste the data copied from the Excel spreadsheet generated during the normalization step. Click on “Apply”. This procedure automatically normalized all experimental data.
- To generate a report, click on “Export to”, in the panel that opens on the right, select “XF Cell Mito Stress Test Report Generator.” Save the generated file. During analysis, select only the wells assigned to the Mito Stress Test (refer to Figure 3).
- To generate a report, click on “Export to”, in the panel that opens on the right, select “XF Cell Glycolysis Stress Test” Report Generator.” Save the generated file. During analysis, select only the wells assigned to the Glycolysis Stress Test (refer to Figure 3).
9. Adherent vs. non-adherent cells
NOTE: Adherent and non-adherent cells differ in their growth behavior, surface attachment, and handling requirements. Adherent cells (e.g., cancer cells, BMDMs) attach to the culture surface, so plating and washing do not require special precautions. Non-adherent cells (e.g., T cells, other lymphocytes) remain in suspension and require different centrifugation, resuspension, and plating methods. Understanding these differences is crucial for accurate cell seeding, drug treatment, and assay consistency.
- Ensure that all cells used for the experiment are cultured in a medium and cell culture vessel of choice just prior to the assay being run, but then transfer to the microplate to run the assay.
NOTE: While XF RPMI medium is recommended for the cell types described in this protocol, for other cell types, consult the manufacturer to ensure the appropriate medium is used. - For adherent cells (cancer cells, BMDM cells), seed the cells to the XFe96/XF Pro Cell Culture Microplate 4–5 h before the assay at an optimized cell density (see step 1) in the media volume 200 µL and place in a 37 °C CO2 incubator.
NOTE: BMDM cells can be plated up to 24 h before the assay, as they do not proliferate and will maintain the same cell density. For fast-growing adherent cells, like cancer cell lines, it is advised to plate on the day of assay if no additional treatment is needed and analyze them as soon as cells are attached to avoid additional cell growth. If this design is not possible, normalization to protein quantity/well or nuclei number/well is a necessary step. - Ensure that the corner wells for every four corners of the microplate are free of cells but filled with media, as this is measured as the blank control wells.
- After 3–5 h of incubation, observe the microplate to make sure cells are attached to the plate at a uniform level at the bottom of each well.
- If cells are not yet attached, the plate can be placed in the 37 °C CO2 incubator for additional time until cells are thoroughly attached.
- Next, prepare the microplate with adherent cells for washing as mentioned in step 4 to proceed with the assay.
- For non-adherent cells (T-cells and other lymphocytes), coat the microplate with Poly-D-Lysine before adding cells to the plate.
NOTE: While Poly-D-Lysine coating is recommended in this protocol, depending on the cell type, another plate coating (e.g., collagen, fibronectin, gelatin) may be more suitable. If using an alternative coating, please follow the manufacturer’s instructions for use. - To coat the microplate, prepare 2.5 mL of a 20 µg/mL Poly-D-Lysine solution (50x dilution of 1 mg/1 mL water solution) in 0.1 M sodium bicarbonate, pH 8.0 (bicarbonate provides the optimum pH for adhesive adsorption). This step can be performed prior to performing the assay or on the day of.
- Apply 25 µL of the solution to each well of the plate and incubate on the bench or on a plate rocker at room temperature for 20–30 min.
- Aspirate or pipette off any remaining solution and wash each well twice using 200 µL of RNAase/DNAse-free water.
- Wait until wells are dry (1–2 h) before seeding the cells to the microplate.
- Next, prepare the microplate with non-adherent cells for the washing step by centrifuging the plate at 200 x g for 3 min with no brake to ensure cells are suspended at the bottom of each well.
- Proceed to step 4 and continue the remainder of the assay as mentioned in steps 5–7.
Results
This combined protocol was developed to enable both assays to be performed on the same plate. For example, this method was used to elucidate mGluR1−TCR crosstalk signaling on the metabolic proficiency of CD8+ T cells during activation10. This was to evaluate the impact of mGluR1 inhibition on the transition to glycolysis and the changes of mitochondrial respiration, processes essential for the optimal functioning of T cells, while minimizing the number of T-cells used in each experiment. The same single-plate technique was also effectively applied to other cell types, such as adherent bone marrow–derived macrophages (BMDMs; Figure 4 and Figure 5), and to non-adherent cells, such as human peripheral blood mononuclear cells (PMBCs; Figure 3). It was shown that mGluR1 signaling blockade on activated CD8+ T cells affects mitochondrial and non-mitochondrial energy production. In contrast, naive cells showed no significant changes in their metabolic energy profiles (Figure 6A,B). The Mito Stress test of activated CD8+ T cells showed high basal and maximal respiration as well as respiratory reserve capacity (Figure 6C). T-cells treated with CPCCOEt, a non-competitive antagonist that blocks downstream signaling upon glutamate binding to mGluR1, had reduced oxygen consumption rates (OCR) like the naive cells and resulted in diminished ATP production (Figure 6C). The Glycolysis assay also showed that only untreated activated CD8+ T cells produced ATP via glycolysis, and CPCCOE treatment displayed metabolic activity comparable to the naive condition (Figure 6D). These results confirm that mGluR1 signaling is essential for proper CD8⁺ T cell function upon activation.
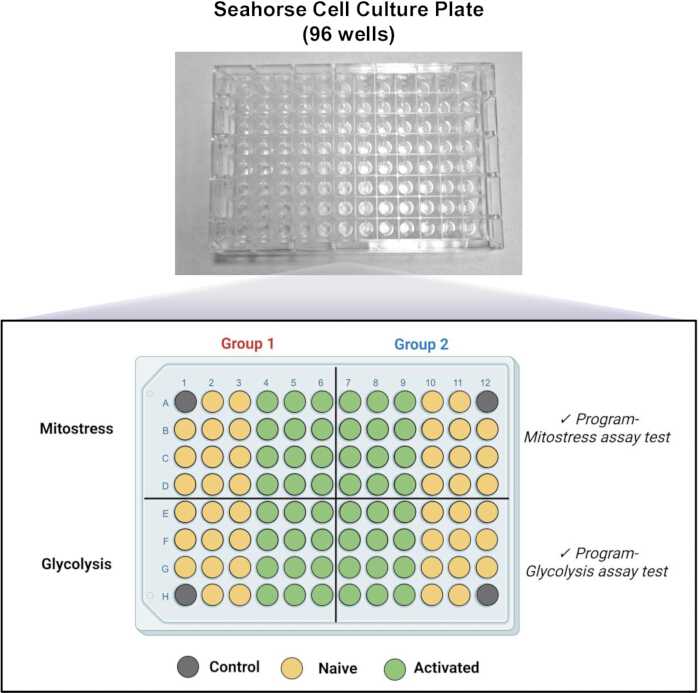
Figure 1: This figure illustrates the overview of the plate setup of the microplate that includes the Mito Stress and Glycolysis Assay in the same plate. Please click here to view a larger version of this figure.
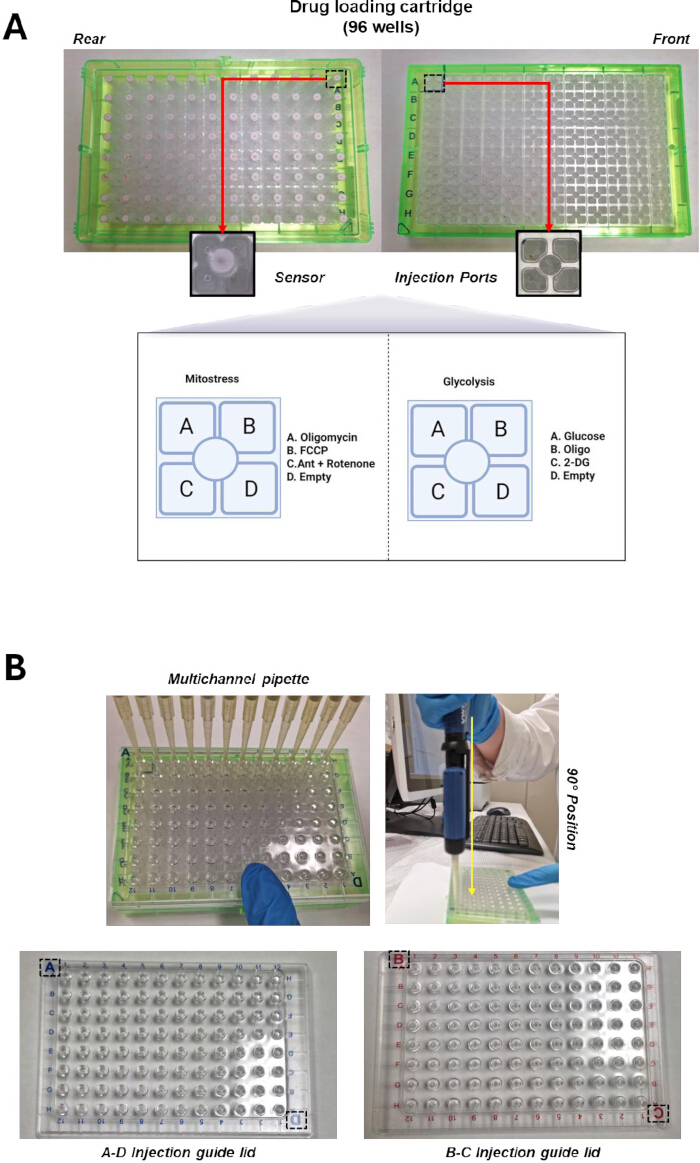
Figure 2: Loading the drug cartridge. (A) A detailed map of the sensors and ports at the rear and front of the cartridge, labelling which drug must be loaded into which port. (B) The recommended orientation of the guides on top of the cartridge for loading the corresponding ports and the recommended positioning for using the multichannel pipettor over the guides. Please click here to view a larger version of this figure.
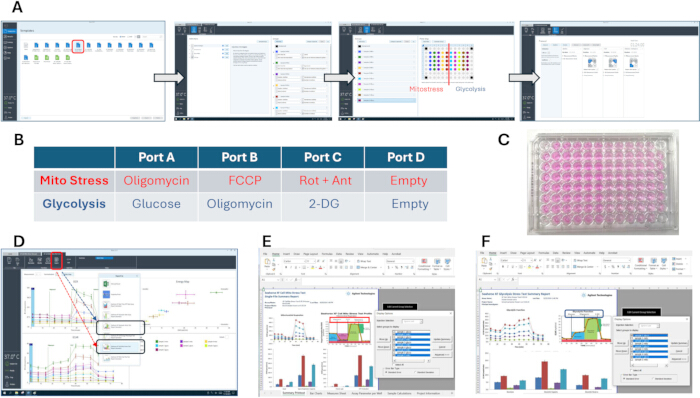
Figure 3: Using the WAVE program to run and analyze the assay. (A) The flow through of setting up the program includes selecting the assay type, assigning groups, creating the plate map, and programming the drug ports. (B) The order of the drugs to be loaded into the corresponding ports depends on whether the sample is Mito Stress or Glycolysis. (C) A close-up of the SRB stain during the last step of normalization. (D) After normalization, the plate data can be exported separately as both Glycolysis and Mito Stress Test for the same plate. (E) The data for Mito Stress can be selected by editing the current selection for only Mito Stress samples. (F) The data for Glycolysis can be selected by editing the current selection for only Glycolysis samples. The example data used in this figure is from an analysis of human peripheral blood mononuclear cells. Please click here to view a larger version of this figure.
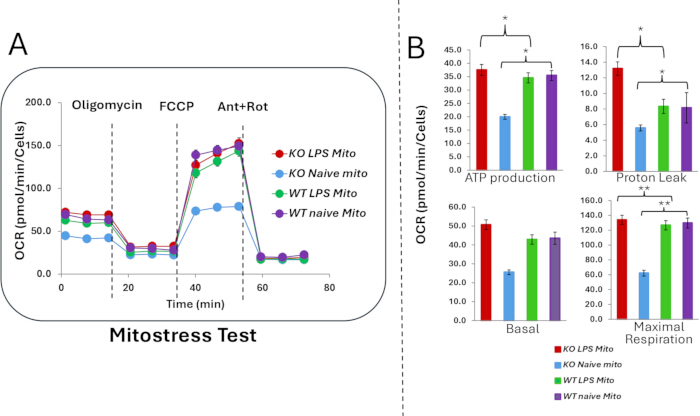
Figure 4: Simultaneous performance of Mito Stress run on the same plate. Bone marrow–derived macrophages derived from 2-month-old WT and Tusc2 KO mice were subjected to both types of analysis. Cells were either left untreated (sham) or stimulated with LPS (100 ng/mL) for 5 h prior to plating (30,000 cells/well). Mito Stress and Glycolysis Stress Tests were performed in parallel to enable accurate comparison, as shown in Figure 1. (A) Mito Stress profiles for different cell types (WT and KO) and conditions (naïve and activated), generated using Wave software. Normalization was performed via SRB staining as described in step 7. (B) Comparative bar graphs of the parameters analyzed in each test. ∗p ≤ 0.05, ∗∗p ≤ 0.005, Student’s T-test. Please click here to view a larger version of this figure.
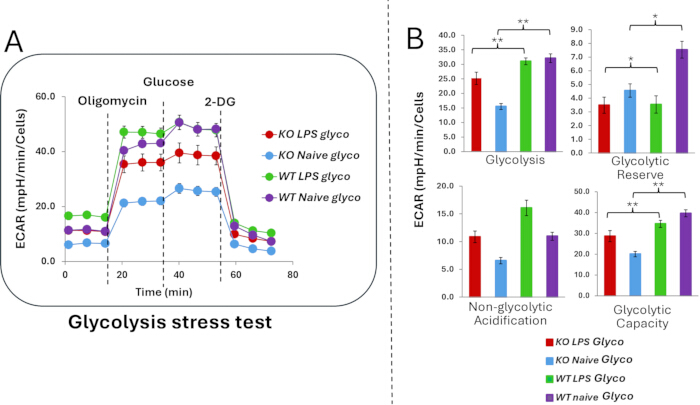
Figure 5: Simultaneous performance of Glycolysis Stress tests run on the same plate. Bone marrow–derived macrophages derived from 2-month-old WT and Tusc2 KO mice were subjected to both types of analysis. Cells were either left untreated (sham) or stimulated with LPS (100 ng/mL) for 5 h prior to plating (30,000 cells/well). Mito Stress and Glycolysis Stress Tests were performed in parallel to enable accurate comparison, as shown in Figure 1. (A) Glycolysis Stress profiles for different cell types (WT and KO) and conditions (naïve and activated), generated using Wave software. Normalization was performed via SRB staining as described in step 7. (B) Comparative bar graphs of the parameters analyzed in each test. ∗p ≤ 0.05, ∗∗p ≤ 0.005, Student’s T-test. Please click here to view a larger version of this figure.
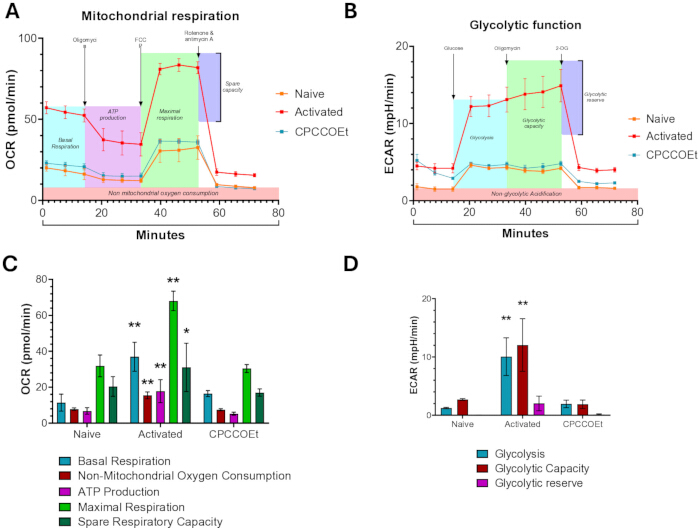
Figure 6: Mito Stress and Glycolysis Stress Tests on a single plate using CD8⁺ T cells purified from mouse splenocytes. (A) Representative profiles of Mitochondrial Stress Test comparing drug-dependent changes in Oxygen Consumption Rate (OCR) of CD8+ T cells performed with naive, activated, and activated + mGluR1 inhibitor T cell groups. (B) Representative profiles of Glycolysis Test comparing drug-dependent changes in Extracellular Acidification Rate (ECAR) of CD8+ T cells performed on naive, activated, and activated + mGluR1 inhibitor groups. (C) Bar graphs showing quantitative changes in different parameters of mitochondrial respiration of CD8+ T cells in naive, activated, and activated + mGluR1 inhibitor groups. Bars represent the Mean ± SEM (n = 4). (D) Bar graphs showing quantitative changes in different parameters of glycolysis in naive, activated, and activated + mGluR1 inhibitor CD8+ T cells. Bars represent the Mean ± SEM (n = 4). ∗p ≤ 0.05, ∗∗p ≤ 0.005, Student’s T-Test. This figure is adapted from Aquino et al.10. Please click here to view a larger version of this figure.
| Final Well (µM) | Stock Solution volume (µL) | Media Volume (uL) | 10x Port (µM) | Volume added to port (µL) | |
| Port A oligomycin | 0.5 | 150 | 2850 | 5 | 20 |
| 1.5 | 450 | 2550 | 15 | 20 | |
| 2.5 | 630 | 1890 | 25 | 20 | |
| Port B FCCP | 0.125 | 37.5 | 2962.5 | 1.25 | 22 |
| 0.25 | 75 | 2925 | 2.5 | 22 | |
| 0.5 | 150 | 2850 | 5 | 22 | |
| 1 | 300 | 2700 | 10 | 22 | |
| 2 | 600 | 2400 | 20 | 22 | |
| Port C Rotenone/Antimycin | 0.5 | 300 | 2700 | 5 | 24 |
Table 1: Compound preparation for loading XFe96 sensor cartridges for Mito Stress.
| Final Well | Stock Solution volume (µL) | Media Volume (µL) | 10x Port | Volume added to port (µL) | |
| Port A Glucose | 250 mM | 100 | 2400 | 20 | |
| Port B oligomycin | 0.5 µM | 150 | 2850 | 5 uM | 22 |
| 1.5 µM | 450 | 2550 | 15 uM | 22 | |
| 2.5 µM | 630 | 1890 | 25 uM | 22 | |
| Port C 2-DG | 50 mM | 3000 | 0 | 500mM | 24 |
Table 2: Compound preparation for loading XFe96 sensor cartridges for Glycolysis.
Discussion
The protocol presented here enables accurate and reliable comparisons of two major energy-producing pathways, oxidative phosphorylation (mitochondrial ATP production) and anaerobic glycolysis (ATP production outside mitochondria, not requiring oxygen), and two different stress tests within a single run. Additionally, the experimental design accounts for the type of cells being analyzed, allowing for a broader understanding of cell-metabolism analysis, while minimizing the amount of sample and reagents used.
The differences between the Mito Stress and Glycolysis Stress tests performed on real-time metabolic analysis instrument protocols designed and sold by Agilent, Inc. are substantial. These two assays require distinct assay media, specific drugs, and different instrument programs. The Mito Stress Test uses assay media containing glucose, L-glutamine, and pyruvate, whereas the Glycolysis Stress Test employs glucose-free media supplemented only with L-glutamine. The assays are interrogated with different compounds: Oligomycin → FCCP → Antimycin A + Rotenone for the Mito Stress Test, and Oligomycin → Glucose → 2-DG for the Glycolysis Stress Test. Consequently, these tests are normally run on separate plates at different times, as the real-time metabolic analyzer accommodates only one plate at a time.
To address these limitations, a combined protocol was developed that enables both assays to be performed on the same plate using the Mito Stress Test setup in a previous paper10. Provided are recommendations for analyzing different cell types, including immune cells, cancer cells, adherent cells, and suspension cells. These guidelines can be applied individually or in combination, offering flexibility depending on the experimenter’s objectives and available resources.
Normalization of the cells through SRB Assay or DAPI also allows for more flexibility, in the case of using multiple cell types with different growth rates/size9,11. Moreover, since this technique requires only one plate for two assays, it can be combined with a variety of sample types to measure metabolic processes.
Factors that influence the success of the method: (1) optimal cell number per well; (2) efficient cell attachment; and (3) careful cartridge loading, as two distinct sets of drugs must be loaded into separate sections of the cartridge.
Scientific and experimental advantages of the method include direct comparison within the same biological context. Using the same cells under identical culture conditions eliminates variability between plates or runs and allows a more accurate comparison of mitochondrial and glycolytic function in the same sample. It also includes an integrated view of cellular metabolism. Measuring both oxidative phosphorylation (OXPHOS) and glycolysis in parallel provides a comprehensive snapshot of a cell’s overall energy metabolism and its flexibility in switching between pathways. This parallel assay also reduces biological variability. Differences in cell plating density, passage number, or environmental conditions are minimized since both assays are performed on the same population of cells, which leads to improved reproducibility. Performing both tests simultaneously reduces run-to-run variability caused by sensor cartridge calibration, temperature changes, or reagent preparation.
Technical benefits of this technique include increased efficiency by combining assays, which saves time, reagents, and plate consumables, making it important for large-scale or high-throughput studies. This allows for lower sample requirements. Only one plate of cells is needed, which is advantageous when working with limited or rare primary cells (e.g., lymphocytes, brain-derived cells). Better normalization across assays occurs since both tests use the same plate, normalization (e.g., to protein content or cell number), and is more consistent and reliable. With this consistency, data correlation is enhanced. Direct pairing of mitochondrial and glycolytic parameters from the same sample facilitates metabolic profiling and statistical analyses.
The only known limitation for this technique is that combining two protocols on a single plate reduces the number of available well replicates. It is recommended to limit the number of conditions per plate to ensure at least 8 well replicates per condition.
Acknowledgements
This research was funded by the National Institute on Minority Health and Health Disparities (NIMHD), grant number 5U54MD007586-37, pilot project to A. Ivanova; NHGRI Diversity Center for Genome Research grant UG3HG013248, Research project 2, PI-Ivanova, also some support was provided by Genprex Inc. Furthermore, this research was conducted at the Meharry Medical College Core Facilities, which receive support from NIH Grants MD007586, CA163069, and S10RR025497.
Materials
| Name | Company | Catalog Number | Comments |
|---|---|---|---|
| 15 mL Centrifuge Tubes, Bagged With Screw Cap, Sterile, 500 Tubes/Unit | Genesee Scientific | 21-408B | |
| Biologix Pipet Tips-200 μl Extended (Pack, Sterile) | Biologix USA | SKU 21-0200 | |
| BioTek Synergy H1 | BIOSPX | ||
| BZ-X700 fluorescence microscope | Keyence | ||
| Corning Costar Sterile Disposable Reagent Reservoirs | Fisher | 4873 | |
| D-(+)-Glucose Solution 45% in H20 | Sigma | G9769 | |
| DAPI, hydrochloride | Thermofisher Scientific | D1306 | |
| Eppendorf Centrifuge 5810 R | Eppendorf | ||
| GenClone Fetal Bovine Serum Heat Inactivated | Genesee Scientific | 25-514H | |
| L-Glutamine 200 mM (100x) | Gibco | 25030-081 | |
| Olympus Plastics 22-284, Olympus 1.7ml Microtubes, Clear, Sterile Polypropylene, Boilproof, Ster, 50/Bag, 250 Tubes/Unit | Genesee Scientific | 22-284 | |
| Olympus Plastics 28-108, 50ml Conical Centrifuge Tubes, Polypropylene Bulk, Sterile, 20 Bags of 25 Tubes, 500/Unit | Genesee Scientific | 28-108 | |
| Paraformaldehyde 16% solution EM grade | Electron Microscopy Science | 15710 | |
| Poly-D-Lysine hydrobromide lyophilized | Sigma | P6407 | |
| Precision 180 Water Bath | Precision Scientific | 51221060 | |
| Precision Scientific GCA Model 26 Incubator | Thelco | 51221091 | |
| QBI 120-095-671 Penicillin/Streptomycin Mixture , 100x Pen/Strep Mixture, 10 x 10 mL/Unit | Genesee Scientific | 25-827 | |
| QBI PBS, 1x, without Ca, Mg, Phenol Red, 0.1um Sterile Filtered | Genesee Scientific | 25-507B | |
| RPMI 1640, with L-Glutamine | Genesee Scientific | 25-506 | |
| Seahorse XF RPMI medium, pH 7.4, 500 mL | Agilent | 103576-100 | |
| Seahorse XFe96 Analyzer | Agilent | ||
| Seahorse XFe96/XF Pro FluxPak | Agilent | 103792-100 | includes 18 XFe96/XF Pro sensor cartridges,18 XFe96/XF Pro Cell Culture Microplates, 1 bottle of Seahorse XF Calibrant Solution 500mL and 3 pairs of XF Loading Guides |
| Sodium Bicarbonate | Sigma | S6014 | |
| Sodium Pyruvate (100mM) 100X | Gibco | 11360-070 | |
| SRB assay (Sulfurhodamine B Assay Kit) | Abcam | ab235935 | |
| VWR Signature Ergonomic High Performance Multichannel Pipettor | Avantor | 89079-956 | |
| XF Cell Mito Stress Test Kit | Agilent | 103015-100 | |
| XF Glycolytic Rate Assay Kit | Agilent | 103344-100 |
References
- Caines, J. K., Barnes, D. A., Berry, M. D. The use of Seahorse XF assays to interrogate real-time energy metabolism in cancer cell lines. Methods Mol Biol. 2508, 225-234 (2022).
- Marinangeli, C., Kluza, J., Marchetti, P., Buee, L., Vingtdeux, V. Study of ampk-regulated metabolic fluxes in neurons using the Seahorse XF Analyzer. Methods Mol Biol. 1732, 289-305 (2018).
- Tan, W. J. T., Santos-Sacchi, J., Tonello, J., Shanker, A., Ivanova, A. V. Pharmacological modulation of energy and metabolic pathways protects hearing in the fus1/tusc2 knockout model of mitochondrial dysfunction and oxidative stress. Antioxidants (Basel). 12 (6), 1225(2023).
- Sure, V. N., et al. A novel high-throughput assay for respiration in isolated brain microvessels reveals impaired mitochondrial function in the aged mice. Geroscience. 40, 365-375 (2018).
- Hammoud, S., et al. Tubular CPT1a deletion minimally affects aging and chronic kidney injury. JCI Insight. 9 (6), e171961(2024).
- Wei, C., Heitmeier, M., Hruz, P. W., Shanmugam, M. Evaluating the efficacy of glut inhibitors using a Seahorse extracellular flux analyzer. Methods Mol Biol. 1713, 69-75 (2018).
- Zhu, Y., et al. The role of PKM2-mediated metabolic reprogramming in the osteogenic differentiation of BMSCs under diabetic periodontitis conditions. Stem Cell Res Ther. 16 (1), 186(2025).
- Liu, J., Zhang, X., Fan, X. Liensinine reshapes the immune microenvironment and enhances immunotherapy by reprogramming metabolism through the AMPK-HIF-1α axis in hepatocellular carcinoma. J Exp Clin Cancer Res. 44 (1), 208(2025).
- Van Der Windt, G. J. W., Chang, C. H., Pearce, E. L. Measuring bioenergetics in T cells using a Seahorse extracellular flux analyzer. Curr Protoc Immunol. 113 (3), 3.16B.1-3.16B.14 (2016).
- Teresa P de Aquino, M., et al. Glutamate receptor–TCR signaling potentiates full CD8+ T cell activation and effector function in tumor immunity. iScience. 28 (10), 112772(2025).
- Hammoud, S., Kern, J., Mukherjee, S. Assays to enhance metabolic phenotyping in the kidney. Am J Physiol Renal Physiol. 328 (4), 563-577 (2025).
Reprints and Permissions
This article has been published
Video Coming Soon