Curcumin (CUM) inhibits glioblastoma (GBM) progression by inducing cuproptosis through suppression of AKT/Wnt/β-catenin axis. This protocol investigates the molecular mechanism by which CUM impedes malignant progression in GBM and describes methods to evaluate how CUM induces cuproptosis by modulating this pathway.
A subscription to JoVE is required to view this content. Sign in or start your free trial.
Research Article
Regulation of the AKT/Wnt/β-catenin Pathway and Induction of Cuproptosis by Curcumin in Glioblastoma
In This Article
Summary
Abstract
Curcumin (CUM) can regulate the malignant behavior of glioblastoma (GBM). This study investigates whether CUM suppresses GBM progression by inducing cuproptosis via the AKT/Wnt/β-catenin signaling pathway. Optimal curcumin concentrations were determined using the MTT assay. A172 and U251 cells were treated with CUM, AKT inhibitor MK-2206, Wnt inhibitor LGK974, and Elsm-Cu (Elesclomol + CuCl2). Cell proliferation, migration, invasion, and apoptosis were assessed using carboxyfluorescein succinimidyl amino ester staining, scratch assays, Transwell assays, and flow cytometry, respectively. MitoSOX fluorescence, Seahorse metabolic analysis, immunofluorescence, Cu2+ detection, and Western blotting were used to evaluate mitochondrial oxidative stress and cuproptosis. The AKT/Wnt/β-catenin axis was analyzed using a TCF/LEF1 reporter kit and western blotting. A GBM xenograft model was established, and CUM was administered by gavage for five weeks. CUM effects on tumor growth, cuproptosis, and AKT/Wnt/β-catenin pathway protein expression were evaluated. Cells were treated with 10 µM and 20 µM CUM in vitro. CUM treatment reduced proliferation, migration, and invasion, while promoting oxidative stress and cuproptosis. CUM also suppressed Wnt/β-catenin signaling activity. Pathway inhibition increased reactive oxygen species (3.7-fold) and Cu2+ (3.1-fold) levels, and decreased dihydrolipoamide acetyltransferase expression, thereby restraining malignant behavior. In nude mice, CUM significantly reduced tumor growth, promoted cuproptosis, and inhibited AKT/Wnt/β-catenin axis activation. Our results indicate that CUM suppresses AKT/Wnt/β-catenin signaling, promotes cuproptosis, and interferes with GBM progression.
Introduction
Glioma is the most prevalent primary intracranial malignant tumor in the central nervous system (CNS)1. Grade 4 glioma usually refers to glioblastoma (GBM), with poor prognosis2. GBM is a highly invasive brain tumor, accounting for nearly 50% of CNS malignancies, with a median survival of less than 1 year3. It is known for its high malignancy and high recurrence rate4,5. Presently, GBM treatment strategies primarily relies on surgery, supplemented by radiotherapy, chemotherapy, and other comprehensive treatment methods6. Although emerging therapeutic strategies such as immunotherapy, biotherapy, and nanomedicine have achieved remarkable results in preclinical studies7,8, the overall 5-year survival rate remains only 4.3%9. The most commonly used chemotherapy regimen is the well-known Stupp regimen; however, for GBM patients with unmethylated MGMT, the overall survival rate is not significantly prolonged10. Therefore, exploring new treatment strategies is of key importance in prolonging the survival period of patients. This research hypothesizes that the anticancer mechanism of curcumin (CUM) on GBM involves cuproptosis.
Abnormal copper metabolism or copper-induced cell damage can lead to a series of diseases11. Under conventional redox conditions, reduced Cu+ can be oxidized to Cu2+. Tsvetkov et al. found a previously undiscovered mechanism of copper-induced cell death, called cuproptosis. Cu2+ ions bind to acylated compounds, and then expression of Fe-S cluster proteins is downregulated, causing cell death12,13. Extensive research has confirmed that cuproptosis is closely associated with the pathophysiological process of tumors14,15. Cuproptosis-related lncRNAs and genes represent potential biomarkers for GBM prognosis and treatment16. BCMD can release Cu2+, induce cuproptosis, and trigger immunogenic cell death to treat GBM17. Therefore, we believe that cuproptosis can be used as a novel target for GBM therapy. However, most existing schemes rely on synthetic carriers such as Elesclomol-Cu or direct induction of high-concentration copper ions. Although this exogenous drastic intervention can prove the concept of cuproptosis, its clinical transformation prospects are limited due to its lack of physiological correlation and targeting. Therefore, the search for natural or small-molecule compounds that can endogenously and accurately regulate cuproptosis of GBM and elucidate its upstream signaling mechanism has become a key bridge between this novel mechanism and clinical treatment.
Chinese medicine has been widely considered a valuable resource for anti-tumor drug research. CUM is a polyphenolic substance extracted from traditional Chinese medicine turmeric. Modern pharmacology has confirmed that it has antioxidation, antiinflammatory, and antitumor functions. CUM has many antitumor activities. It can reduce the activity of GBM cells by promoting apoptosis, multimolecular pathway disruption, and other mechanisms18. In vitro experiments have shown that low-dose CUM combined with irradiation can synergistically enhance antiGBM proliferation19. Moreover, CUM can regulate core pathways related to GBM, including MAPK20. Compared with traditional temozolomide (TMZ) chemotherapy, CUM shows unique therapeutic advantages. The efficacy of temozolomide is often limited by the powerful DNA repair mechanisms in GBM, resulting in drug resistance; the mechanism by which CUM induces cuproptosis by targeting mitochondrial metabolism21,22 is independent of TMZ. CUM can not only regulate the metabolic processes related to cuproptosis but also simultaneously interfere with multiple key signaling pathways related to GBM progression, providing potential avenues to overcome the limitations of single therapies and develop combined treatment strategies. The concentration range of CUM used in this study (10-20 µM) is consistent with effective concentrations reported in preclinical treatment studies23. Although the inherent low oral bioavailability of CUM and its delivery efficiency through the blood-brain barrier are key challenges in practical applications, emerging nano-delivery systems and targeted modification strategies have provided promising solutions to overcome this bottleneck24.
Although the proapoptotic, antiproliferative, and migration-inhibiting effects of CUM in GBM have been reported by many studies25,26, most existing research has focused on its effects on traditional apoptosis or autophagy pathways. This study aims to clarify whether CUM inhibits the malignant progression of GBM by regulating cuproptosis. We investigated whether CUM may induce cuproptosis in part via suppressing the AKT/Wnt/β-catenin axis, thereby suppressing GBM. Based on this, this study provides experimental bases for CUM to improve GBM treatment and for developing novel targets in GBM therapy.
Access restricted. Please log in or start a trial to view this content.
Protocol
All animal procedures were performed in compliance with established institutional standards for the humane care and use of laboratory animals and were formally approved by the institutional Animal Ethics Committee. Measures were taken to reduce discomfort and distress to the animals whenever possible.
Work involving chemical compounds, dyes, and biological samples followed established biosafety practices to mitigate potential risks. Potentially hazardous substances-including paraformaldehyde, copper-based reagents, and DHE-were handled with appropriate personal protective equipment, including gloves, face masks, and safety glasses. All waste materials, such as spent reagents and contaminated disposable items, were segregated into designated biohazard receptacles and subsequently treated by authorized hazardous waste management services in line with institutional and environmental safety regulations. The overall experimental design is outlined in Figure 1.
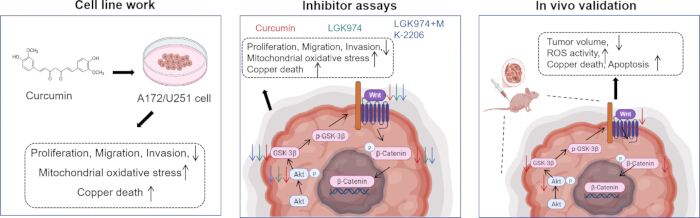
Figure 1: The workflow of this study. Please click here to view a larger version of this figure.
Cell culture and grouping
Normal human brain astrocytes (NHA) and glioblastoma cell lines A172, U251, LN229, and SHG-44 (see Table of Materials) were cultured in DMEM medium containing 10% fetal bovine serum (FBS) and maintained in an incubator at 3 °C with 5% CO₂. The medium was changed every other day, and cells were passaged when they reached approximately 80% confluency. The appropriate dose and exposure time for CUM were determined using the MTT assay. NHA, A172, U251, LN229, and SHG-44 cells were treated with different concentrations (0, 2.5, 5, 10, 20, and 4 µM) of CUM for 24, 48, and 7 h, respectively23. Then, 2 µL of MTT solution was added. After h, 15 µL of dimethyl sulfoxide was added to each well and gently mixed. Optical density (OD) at 45 nm was measured using a microplate reader. Untreated cells (Control group) were used as negative controls in all experiments.
A172 and U251 cells were seeded and divided into groups: Control, CUM low-dose (1 µM), CUM high-dose (2 µM), AKT inhibitor (MK-2206), AKT inhibitor + Wnt inhibitor (MK-2206 + LGK974), and Elsm-Cu (Elesclomol + CuCl₂), based on treatment conditions. Cells in the CUM groups were treated with 10 or 2 µM CUM for 4 h. Cells in the MK-2206 group received 1 µM MK-2206 for 2 h. Cells in the MK-2206 + LGK974 group were treated with µM LGK974 for h after MK-2206 exposure. Elsm-Cu group cells were treated with 100 nM Elesclomol and µM CuCl₂ for 4 h14.
Flow cytometry
Cultured A172 and U251 cells in each group were incubated with PBS containing 1 µg/mL PI staining solution for 1 min. Cells were then treated with 0.25% trypsin and collected by centrifugation (20 × g, min, room temperature). PI-positive cells were detected using a flow cytometer with a PE channel (excitation at 488 nm), and the cell death rate was calculated27.
Carboxyfluorescein succinimidyl amino ester (CFSE) assay
A172 and U251 cells were incubated with µmol/L CellTrace CFSE dye at 3 °C for 1 min in the dark. The medium was then neutralized, and cells were centrifuged at 20 × g for min at room temperature. After collection, cells were cultured and treated according to their groupings. CFSE fluorescence intensity was analyzed using flow cytometry (excitation at 488 nm)27.
Cell clone formation assay
Cultured A172 and U251 cells were digested, resuspended, and counted. Two milliliters of the prepared cell suspension was added. After gentle mixing, cells were incubated for approximately 14 days. Cells were then fixed with 4% paraformaldehyde for 3 min, and the fixative was discarded. After staining with 0.1% crystal violet. Colony images were captured, and the clone formation rate was calculated14.
Cell scratch test
A172 and U251 cells (1 × 10⁶ cells/well) were cultured until they reached 90% confluency. The cell monolayer was scratched once using a sterile 2 µL tip to create a wound and then treated with different concentrations of CUM for h and 48 h. Images were captured using a microscope. The scratch healing rate was evaluated using ImageJ software. Images were converted to 8-bit format, a unified threshold was set to distinguish the scratch area from the cell area, and the scratch areas at 0 h and 48 h were calculated using the Analyze Particles function. Scratch healing rate (%) = (0 h distance − 48 h distance) / 0 h distance × 100%23.
Transwell experiment
A172 and U251 cells were exposed to the specified treatments, then enzymatically detached and centrifuged at 200 × g for 5 min at room temperature. The cells were resuspended in serum-free medium. Matrigel was diluted at a 1:8 ratio in serum-free medium, thoroughly mixed, and 5 µL was applied to the upper chamber of a Transwell insert, followed by a 4 h incubation. A total of 5 × 10⁴ cells per well were added to the upper chamber, while 60 µL of medium supplemented with 20% FBS was placed in the lower chamber. After 48 h of incubation, cells were fixed using paraformaldehyde and stained with crystal violet. Five visual fields were selected from the center and periphery of each well. Cells were observed and imaged under a microscope. Invasive cells were calculated using ImageJ. Images were converted to 8-bit format, thresholds were applied to distinguish stained cells from the background, and the Analyze Particles function counted cells that had migrated through the membrane23.
Mitochondrial membrane potential (MMP) detection
Cultured A172 and U251 cells in each group were incubated with mL of JC-1 working solution for 30 min in the dark. Cells were washed gently with precooled JC-1 buffer, observed, and photographed using a fluorescence microscope. Using 488 nm excitation, JC-1 polymer and monomer signals were collected using 590 nm and 530 nm emission filters, respectively. The red/green fluorescence ratio (JC-1 aggregates to monomers) was analyzed using ImageJ software to evaluate MMP changes28. Images of red and green channels were extracted separately, and the average fluorescence intensity in the same region was quantified.
Oxygen consumption rate (OCR) detection
Cultured A172 and U251 cells were seeded. The plate was placed in a preheated analyzer at 3 °C for adaptation. Once adapted, the determination medium was added. After automatic calibration, the plate was equilibrated for 15-2 min at 3 °C without CO2. Baseline OCR was measured, and the assay program was set to record mitochondrial OCR at defined intervals. Data were exported for subsequent analysis28.
MitoSOX fluorescent probe detection of reactive oxygen species (ROS)
A172 and U251 cells were adjusted to a density of 1 × 10⁴ cells/mL, and 1 mL per well was seeded in a confocal dish, and then the drug intervention was performed. The cell supernatant was discarded, and 1 mL of diluted MitoSOX probe (1:1,000) was added. Cells were incubated in the dark at 3 °C for 1 min. Fluorescence signal was captured using a fluorescence microscope (excitation/emission: 510/580 nm) to assess mitochondrial ROS levels29.
Immunofluorescence
Coverslips were washed once with DMEM culture medium. They were then placed in six-well plates for cell seeding and drug intervention. After 24 h, the cells were fixed in 4% paraformaldehyde and subsequently blocked with 5% bovine serum albumin (BSA) for 30 min. The blocking solution was removed, and diluted primary antibodies targeting dihydrolipoamide acetyltransferase (DLAT) and β-catenin were applied, followed by overnight incubation at °C30. Fluorescently labeled secondary antibodies were then introduced and incubated at 3 °C for 30 min. Cell nuclei were counterstained with DAPI, and slides were mounted using an antifade reagent. Fluorescence images were captured using a fluorescence microscope, and signal intensity was quantified with ImageJ software. Images were converted to 8-bit format, and a consistent threshold was applied to distinguish target signals from background noise. The Rectangle tool was used to select the desired cell regions, and average fluorescence intensity was measured27. To visualize mitochondria, cells were treated with 20 nM MitoTracker Red CMXRos for 30 min and then fixed with paraformaldehyde30.
TCF/LEF1 luciferase reporter kit
Wnt/β-catenin activation within A172 and U251 cells was assessed using a TCF/LEF1 luciferase reporter kit. The TCF/LEF reporter vector contains a TATA box and T cell factor/lymphoid enhancer factor (TCF/LEF) response elements, enabling indirect detection of β-catenin transcriptional activity via green fluorescent protein (GFP) expression. Cultured A172 and U251 cells were reversely transfected with 5 ng TCF/LEF reporter vector. Sixteen hours post-transfection, fluorescence intensity was recorded using a microplate reader with excitation and emission settings of 488 and 51 nm, respectively31.
Tumor-bearing mice
Ten male BALB/c nude mice (7 weeks old, 2 ± 2 g) were maintained under specific pathogen-free conditions (2 °C, 65% humidity) with unrestricted access to standard chow and water. All procedures were approved by the Ethics Review Committee of the First Affiliated Hospital of Yangtze University (No 2023092; approval date: 18.10.2023).
To establish a GBM xenograft model, A172 cells (4 × 10⁶ cells/mL) were suspended in serum-free medium, and 0.1 mL was injected subcutaneously into the right flank of each mouse. Animals were randomly assigned to either a Control group or a CUM treatment group (n = 5 per group). The CUM group received 60 mg/kg curcumin daily via oral gavage, while the Control group received an equal volume of saline. Tumor diameters were recorded every 7 days using a vernier caliper, and tumor volume was calculated using the formula ½ × length × width2 (mm3). After 5 weeks, mice were euthanized by cervical dislocation, and tumors were harvested under sterile conditions for weight measurement32.
TUNEL assay
Tumor tissues were fixed in 4% paraformaldehyde for 24 h, dehydrated in ethanol, embedded in paraffin, and sectioned at µm thickness. Sections were dewaxed and rehydrated, rinsed with PBS, treated with proteinase K for 50 min for antigen retrieval, and incubated with 3% hydrogen peroxide. TUNEL reaction mixture was applied for 1 h, followed by mounting with an antifade reagent. Fluorescence images were acquired by microscopy, and TUNEL-positive cells per field were quantified using ImageJ software.
Immunohistochemistry
Paraffin-embedded tumor sections were baked at 6 °C, dewaxed in xylene, and rehydrated through a graded ethanol series. Antigen retrieval was performed using heated EDTA buffer, followed by quenching of endogenous peroxidase activity. Slides were incubated with anti-Ki-67 primary antibody overnight at °C. After incubation with a secondary antibody for 20 min, sections were stained with diaminobenzidine (DAB) for 5 min and counterstained with hematoxylin. Following dehydration and mounting with neutral resin, slides were imaged under a microscope. Positive staining was identified by brownish-yellow precipitate, and Ki-67-positive cells were quantified using ImageJ27.
Dihydroethidium (DHE) fluorescence staining
ROS levels were assessed using DHE fluorescence staining. Frozen tumor tissue sections were rinsed with PBS. Background fluorescence was quenched, and µM DHE was added to each section for 3 min. After PBS washing, sections were sealed in the dark. Fluorescence was observed using a microscope (excitation/emission: 518/605 nm), and five random images were collected per group. ImageJ was used to quantify ROS levels.
Cu2+ content detection
The concentration of Cu2+ in GBM cells and tumor tissues was assessed using a colorimetric detection kit. A172 and U251 cells, post treatment, were harvested and centrifuged at 1,500 × g for 10 min at °C. Cell pellets were resuspended in 0. mL of distilled water, sonicated on ice, and centrifuged again. Tumor tissues were homogenized in distilled water and similarly centrifuged at 4 °C for 10 min. Supernatants (1 µL) were transferred to a 96-well plate, mixed with 23 µL of chromogenic reagent, sealed, and incubated for 5 min. Optical density (OD) was measured at 58 nm using a microplate reader, and Cu2+ levels were calculated14.
Western Blot (WB)
Proteins were isolated from cultured cells and tumor tissues. Supernatants were obtained via centrifugation at 12,000 × g for 15 min at 4 °C, and protein concentrations were quantified using a BCA assay. After denaturation, samples were separated by SDS-PAGE, transferred to PVDF membranes, and blocked with 5% skim milk for 1 h. Membranes were washed in TBST and incubated overnight at °C with primary antibodies against FDX1, LIAS, DLAT, DLD, AKT, p-AKT, Wnt3a, GSK-3β, p-GSK-3β, β-catenin, p-β-catenin, and β-actin (see the Table of Materials)14,33. Following additional TBST washes, membranes were incubated with HRP-conjugated secondary antibodies for 1 h, developed using ECL reagent, and visualized by chemiluminescence. ImageJ software was used to quantify signal intensity using the Rectangle selection tool and Gels analysis function. Relative protein expression was calculated as the ratio of target band gray value to the internal control (GAPDH). Nuclear extracts from A172 and U251 cells were prepared using a nuclear protein extraction kit. Expression of β-catenin and Lamin B1 was assessed, with Lamin B1 serving as the nuclear loading control34.
Statistical analysis
Quantitative results reflect the mean of three independent replicates. All data were assessed for normal distribution and homogeneity of variance. One-way ANOVA followed by Tukey's post hoc test was used for comparisons across multiple groups. Data are presented as mean ± standard deviation (SD). A P-value of less than 0.05 was considered statistically significant. These procedures were used to ensure data robustness and support the reliability of conclusions.
Access restricted. Please log in or start a trial to view this content.
Results
Inhibition of GBM cell viability and induced cell death
First, there was no significant change in NHA cell viability after 2 h, 48 h, and 72 h of CUM intervention (Figure 2A), indicating that CUM concentrations used had no toxic effect on normal cells. In contrast, the viability of GBM cell lines (A172, U251, LN229, and SHG-44) was significantly reduced at CUM concentrations ≥ 1 µM (P < 0.05-0.001) (Figure 2B-E
Access restricted. Please log in or start a trial to view this content.
Discussion
The recurrence rate of GBM is associated with its malignant biological characteristics36. CUM exerts anti-GBM effects by regulating oxidative stress, apoptosis, autophagy, metastasis, invasion, and key molecular targets37. In this study, cellular-level experiments demonstrated that CUM significantly increased GBM cell mortality and inhibited proliferation, colony formation, migration, and invasion -- findings consistent with previous reports20.
<...Access restricted. Please log in or start a trial to view this content.
Disclosures
The authors declare that they have no conflicts of interest.
Materials
| Name | Company | Catalog Number | Comments |
|---|---|---|---|
| 0.1% crystal violet staining solution | Servicebio | G1014 | Labeling cells |
| 4% paraformaldehyde | Beyotime | P0099 | Fix cells or tissues |
| AKT inhibitor (MK-2206) | Selleck.cn, Shanghai, China | S1078 | Specific AKT inhibitor |
| Antibodies (primary and secondary antibodies) | ABclonal Technology, Wuhan, China / abcam, Cambridge, UK / Servicebio, Wuhan, China / Beyotime, Shanghai, China / Cell Signaling, Danvers, MA, USA | A8814, ab32572, GB25303, ab15580, ab108257, ab246917, A8814, AF6708, AA326, 4060, ab219412, 280376, 9322, ab97051, ab229025 | Detection of protein expression levels |
| Cell apoptosis detection kit | Servicebio, Wuhan, China | G1021 | Detection of apoptosis |
| Cell Trace CFSE dye | Invitrogen,Carlsbad, CA, USA | C34570 | Cell proliferation detection |
| Chemiluminescence imaging system | Bio-Rad, Hercules, CA, USA | Chemi Doc XRS+ | Ultra-high sensitivity detection of protein |
| Cu2+ colorimetric assay kit | Elabscience, Wuhan, China | E-BC-K300-M | Detection of Cu2+ content in tumor tissues and GBM cells |
| CuCl2 | Sigma-Aldrich, Darmstadt, Germany | 751944 | Cuproptosis inducer |
| Curcumin (CUM) | Shanghai source leaf, Shanghai, China | S19245 | Polyphenolic compound |
| DHE detection kit | Beyotime, Shanghai, China | S0063 | Detection of ROS levels |
| Dimethyl sulfoxide (DMSO) | Servicebio | G4101-2 | Solvent for MTT assay |
| ECL developer | Servicebio | G2161 | Used for Western blot |
| Elesclomol | Selleck.cn | S1052 | Cuproptosis inducer |
| Flow cytometry | BD Biosciences, New Jersey, USA | BD FACSAria III | Used for cell death and CFSE assays |
| Fluorescence microscope | OLYMPUS, Tokyo, Japan | IX73 | Used for Immunofluorescence, ROS, TUNEL, DHE and MMP assays |
| Glioblastoma cell lines A172 (RRID: CVCL_0131), U251 (RRID: CVCL_0021), LN229 (RRID: CVCL_0393) and SHG-44 (RRID: CVCL_6902) | Punosai Biotechnology Co., Ltd., Wuhan, China | CL-0012, CL-0237, CL-0578, CL-0207 | Human glioblastoma cell lines |
| GraphPad Prism 9.0 software | GraphPad Software, LLC | Version 9.0 | Statistical analysis |
| ImageJ 1.53k software | National Institute of Mental Health | Version 1.53k | statistical calculation |
| JC-1 working solution | Solarbio, Beijing, China | M8650 | Detection of MMP |
| Male BALB/c nude mice | Slack Kingda Laboratory Animal Co., Ltd., Hunan, China | Mouse experiment | |
| Microplate reader | Bio-Tek, Vermont, USA | ELX-800 | For OD450 nm value measurement |
| Microscope | OLYMPUS | BX53 | Used for cell scratch test, Transwell experiment, and immunohistochemistry assays |
| MitoSOX probe | Thermo Fisher Scientific, Waltham, MA, USA | M36008 | Used for ROS detection |
| Mitotracker Red CMXRos | Thermo Fisher Scientific | M7512 | Specific labeling of mitochondria in living cells |
| MTT detection kit | Servicebio | G4101-1 | Detection of cell viability |
| Normal human brain astrocyte NHA cells (RRID:CVCL_B0DK ) | Huatuo Biotechnology Co., Ltd., Shenzhen, China | HTX2408 | Cell line for control experiments |
| Nuclear protein extraction kit | Beyotime | P0027 | Nuclear protein extraction |
| Seahorse cell energy metabolism analyzer | Agilent, Beijing, China | Seahorse XF | Used for OCR detection |
| TCF/LEF1 luciferase reporter kit | Biolab Technology Co., Ltd, Beijing, China | Detection of the activity of Wnt/β-catenin signaling pathway | |
| TUNEL detection kit | Beyotime | C1088 | Detection of apoptosis in tumor tissues |
| Wnt inhibitor (LGK974) | Selleck.cn | S7143 | Specific Wnt inhibitor |
References
- Weller, M., et al. Glioma. Nat Rev Dis Primers. 10 (1), 33(2024).
- Liang, R., Xiang, Y., Hu, C., Tang, X. Expression and clinical significance of RBBP4 gene in lower-grade glioma: an integrative analysis. Biochem Biophys Rep. 35, 101533(2023).
- Sahoo, O. S., Mitra, R., Nagaiah, N. K. H. The hidden architects of glioblastoma multiforme: glioma stem cells. 3 (1), 66(2024).
- Schaff, L. R., Mellinghoff, I. K. Glioblastoma and other primary brain malignancies in adults: a review. JAMA. 329 (7), 574-587 (2023).
- Singh, D. Nanocage-tethered polymeric hybridome for pDNA delivery: a revolutionary approach for treatment of glioblastoma. J Can Biomol Therap. 2 (1), 133-144 (2025).
- van den Bent, M. J., et al. Primary brain tumours in adults. Lancet. 402 (10412), 1564-1579 (2023).
- Zhou, Y., Shi, F., Zhu, J., Yuan, Y. An update on the clinical trial research of immunotherapy for glioblastoma. Front Immunol. 16, 1582296(2025).
- Ravuluri, J. A. V., et al. Brain-targeted nano-architectures for efficient drug delivery and sensitization in glioblastoma. Curr Pharm Des. 29 (22), 1775-1790 (2023).
- LeBlanc, V. G., et al. Single-cell landscapes of primary glioblastomas and matched explants and cell lines show variable retention of inter- and intratumor heterogeneity. Cancer Cell. 40 (4), 379-392.e9 (2022).
- Zhang, Y., et al. Single-cell RNA sequencing identifies critical transcription factors of tumor cell invasion induced by hypoxia microenvironment in glioblastoma. Theranostics. 13 (11), 3744-3760 (2023).
- Jiang, Y., Huo, Z., Qi, X., Zuo, T., Wu, Z. Copper-induced tumor cell death mechanisms and antitumor theragnostic applications of copper complexes. Nanomedicine (Lond). 17 (5), 303-324 (2022).
- Tsvetkov, P., et al. Copper induces cell death by targeting lipoylated TCA cycle proteins. Science. 375 (6586), 1254-1261 (2022).
- Meena, R., Sahoo, S. S., Sunil, A., Manna, D. Cuproptosis: a copper-mediated programmed cell death. Chem Asian J. 20 (4), e202400934(2025).
- Jin, Y., et al. Baicalein enhances cisplatin sensitivity in cervical cancer cells by promoting cuproptosis through the Akt pathway. Biomed Pharmacother. 179, 117415(2024).
- Ning, S., et al. Type-I AIE photosensitizer loaded biomimetic system boosting cuproptosis to inhibit breast cancer metastasis and rechallenge. ACS Nano. 17 (11), 10206-10217 (2023).
- Chen, Y., Zhang, J., Zheng, W., Xu, H. Cuproptosis-related lncRNAs and genes: potential markers for glioblastoma prognosis and treatment. PLoS One. 20 (2), e0315927(2025).
- Huang, Q. -X., et al. Metal-organic framework nanoagent induces cuproptosis for effective immunotherapy of malignant glioblastoma. Nano Today. 51, 10911(2023).
- Mohamadian, M., Ahmadi, S. S., Bahrami, A., Ferns, G. A. Review on the therapeutic potential of curcumin and its derivatives on glioma biology. Neurochem Res. 47 (10), 2936-2953 (2022).
- Zoi, V., et al. Curcumin and radiotherapy exert synergistic anti-glioma effect in vitro. Biomedicines. 9 (11), 1562(2021).
- Wong, S. C., Kamarudin, M. N. A., Naidu, R. Anticancer mechanism of curcumin on human glioblastoma. Nutrients. 13 (3), 950(2021).
- Sun, X., et al. Protective effect of curcumin on hepatolenticular degeneration through copper excretion and inhibition of ferroptosis. Phytomedicine. 113, 154539(2023).
- Xiang, B., et al. Curcumin ameliorates copper-induced neurotoxicity through inhibiting oxidative stress and mitochondrial apoptosis in SH-SY5Y cells. Neurochem Res. 46 (2), 367-378 (2021).
- Wang, Z., et al. Curcumin suppresses glioblastoma cell proliferation by p-AKT/mTOR pathway and increases the PTEN expression. Arch Biochem Biophys. 689, 108412(2020).
- Jia, F., et al. Matrix metallopeptidase 2-responsive curcumin-loaded nanoparticles-induced signal transducer and activator of transcription 3 inhibition suppresses glioblastoma multiforme growth via enhancing nuclear factor erythroid 2-related factor 2 activity. Int J Biol Macromol. 307 (Pt 2), 141998(2025).
- Su, X., Chen, S., Lu, H., Li, H., Qin, C. Study on the inhibitory effect of curcumin on GBM and its potential mechanism. Drug Des Devel Ther. 15, 2769-2781 (2021).
- Bhagat, N., et al. Self-assembled systems for nose-to-brain delivery of temozolomide in brain tumor therapy. Int J Pharm. 675, 125540(2025).
- Mohajerani, F., et al. CLEC19A overexpression inhibits tumor cell proliferation and migration and promotes apoptosis concomitant suppression of PI3K/AKT/NF-κB signaling pathway in glioblastoma multiforme. BMC Cancer. 24 (1), 19(2024).
- Li, Z., et al. MELK promotes HCC carcinogenesis through modulating cuproptosis-related gene DLAT-mediated mitochondrial function. Cell Death Dis. 14 (11), 733(2023).
- Lin, S., Wu, B., Hu, X., Lu, H. Sirtuin 4 downregulation contributes to chondrocyte senescence and osteoarthritis via mediating mitochondrial dysfunction. Int J Biol Sci. 20 (4), 1256-1278 (2024).
- Wang, W., et al. Ferroptosis inducers enhanced cuproptosis induced by copper ionophores in primary liver cancer. J Exp Clin Cancer Res. 42 (1), 142(2023).
- Wagstaff, M., et al. β-Catenin interacts with canonical RBPs including MSI2 to associate with a Wnt signalling mRNA network in myeloid leukaemia cells. Oncogene. 44 (29), 2490-2503 (2025).
- Liao, C. L., et al. Tetrandrine suppresses human brain glioblastoma GBM 8401/luc2 cell-xenografted subcutaneous tumors in nude mice in vivo. Molecules. 26 (23), 7105(2021).
- Huo, S., et al. ATF3/SPI1/SLC31A1 signaling promotes cuproptosis induced by advanced glycosylation end products in diabetic myocardial injury. Int J Mol Sci. 24 (2), 1667(2023).
- Zhang, Z., et al. Maresin1 suppresses high-glucose-induced ferroptosis in osteoblasts via NRF2 activation in type 2 diabetic osteoporosis. Cells. 11 (16), 2560(2022).
- Wang, H., et al. Targeting Wnt/β-catenin signaling exacerbates ferroptosis and increases the efficacy of melanoma immunotherapy via the regulation of MITF. Cells. 11 (22), 3580(2022).
- Liu, Y., et al. DNA aptamer S11e recognizes fibrosarcoma and acts as a tumor suppressor. Bioact Mater. 12, 278-291 (2022).
- Walker, B. C., Mittal, S. Antitumor activity of curcumin in glioblastoma. Int J Mol Sci. 21 (24), 9435(2020).
- Zhang, B., Xie, L., Liu, J., Liu, A., He, M. Construction and validation of a cuproptosis-related prognostic model for glioblastoma. Front Immunol. 14, 1082974(2023).
- Liu, Z., Ma, H., Lai, Z. The role of ferroptosis and cuproptosis in curcumin against hepatocellular carcinoma. Molecules. 28 (4), 1623(2023).
- Tian, Z., Jiang, S., Zhou, J., Zhang, W. Copper homeostasis and cuproptosis in mitochondria. Life Sci. 334, 122223(2023).
- Prasad Panda, S., Kesharwani, A. Micronutrients/miRs/ATP networking in mitochondria: clinical intervention with ferroptosis, cuproptosis, and calcium burden. Mitochondrion. 71, 1-16 (2023).
- Peng, Y., Wang, Y., Zhou, C., Mei, W., Zeng, C. PI3K/Akt/mTOR pathway and its role in cancer therapeutics: are we making headway. Front Oncol. 12, 819128(2022).
- Precilla, D. S., et al. Wnt/β-catenin antagonists: exploring new avenues to trigger old drugs in alleviating glioblastoma multiforme. Curr Mol Pharmacol. 15 (2), 338-360 (2022).
- Li, C., Yang, J., Wang, W., Li, R. LHPP exerts a tumor-inhibiting role in glioblastoma via the downregulation of Akt and Wnt/β-catenin signaling. J Bioenerg Biomembr. 53 (1), 61-71 (2021).
- Liu, Y. T., et al. Dysregulated Wnt/β-catenin signaling confers resistance to cuproptosis in cancer cells. Cell Death Differ. 31 (11), 1452-1466 (2024).
- Yu, W., et al. Investigation of cuproptosis regulator-mediated modification patterns and SLC30A7 function in GBM. Aging (Albany NY). 16 (4), 3554-3582 (2024).
- Afshari, A. R., et al. Anti-tumor effects of curcuminoids in glioblastoma multiforme: an updated literature review. Curr Med Chem. 28 (39), 8116-8138 (2021).
Access restricted. Please log in or start a trial to view this content.
Reprints and Permissions
This article has been published
Video Coming Soon