This study demonstrates that microbial inoculants, particularly a 67-strain consortium, mitigate water stress in Lactuca sativa by acting as physiological buffers. Using infrared thermography and the Crop Water Stress Index (CWSI), we quantified how microbial-mediated Induced Systemic Tolerance (IST) maintains transpirational cooling and prevents homeostatic collapse under severe water deficit.
A subscription to JoVE is required to view this content. Sign in or start your free trial.
Research Article
Thermal Evaluation Of Microbial Consortia For Drought Tolerance In Lettuce
In This Article
Summary
Abstract
Increased water scarcity represents a significant threat to global lettuce production, reducing crop quality and yield. While producers often resort to overfertilization to mitigate water stress, biological alternatives such as microbial inoculants offer a more sustainable approach. This study evaluated the effectiveness of a 67-strain microbial consortium and a Trichoderma harzianum isolate in enhancing water stress tolerance in Romaine lettuce (Lactuca sativa var. Paspartu) under controlled conditions. Nine treatments were established, combining microbial inoculation with three irrigation levels (50%, 75%, and 100% of evapotranspiration). Crop water status was monitored using infrared thermography to calculate the Crop Water Stress Index (CWSI) from fluctuations in canopy temperature (Tc). The statistical analysis (ANOVA) of the CWSI showed no globally significant differences between treatments (F = 0.67, p = 0.778); however, distinct numerical trends were observed during peak thermal stress events. Under severe water deficit (50% irrigation), plants inoculated with the microbial consortium maintained lower CWSI values (averaging 0.38) compared to non-inoculated controls, which reached maximum stress thresholds (CWSI = 1.0). Furthermore, microbial treatments demonstrated a faster thermal recovery following acute stress periods. These results suggest that while global variance is high, microbial consortia function as physiological buffers that enhance transpiration efficiency. Infrared thermography proved to be a precise, non-destructive tool for early detection of water stress. This study highlights the potential of beneficial microorganisms to improve crop resilience and provides a standardized protocol for thermal evaluation in horticultural research.
Introduction
Lettuce (Lactuca sativa L.) is a high-value horticultural crop characterized by a shallow root system and high-water content, making it exceptionally sensitive to hydric deficit1. Under water stress, plants activate immediate physiological responses, primarily stomatal closure, to minimize water loss through transpiration2. While this mechanism preserves internal water status, it leads to a significant increase in canopy temperature (Tc) due to reduced evaporative cooling3. In greenhouse production and controlled environments, managing these thermal and hydric fluctuations is fundamental to maintaining yield and quality4.
The literature provides evidence of a critical negative correlation between canopy temperature (Tc) and crop productivity under water-limited conditions. This relationship is further substantiated by the identification of multiple quantitative trait loci (QTLs) for Tc that exhibit pleiotropic effects on both biomass accumulation and final yield4. In the field of water stress monitoring, infrared thermography has demonstrated greater sensitivity than the Normalized Difference Vegetation Index (NDVI), enabling the detection of subtle hydric fluctuations that are often imperceptible to traditional spectral vegetation indices. In this context, algorithms based on canopy temperature (Tc) represent a non-invasive, expeditious, and precise methodology for diagnosing tissue water status. Among these, the Crop Water Stress Index (CWSI) stands out as the most robust and widely implemented parameter for physiological characterization and the optimization of irrigation regimes. The versatility of the CWSI has been validated across a broad range of taxa, including high-value tree and herbaceous crops such as olive, grapevine, sugar beet, maize, rice, wheat, and cotton5.
In contrast, infrared thermography (IRT) has emerged as a robust, non-destructive tool for real-time monitoring of crop water status. By calculating the Crop Water Stress Index (CWSI) from Tc differences, researchers can quantify stress before visual wilting symptoms appear6. However, despite the precision of IRT, there is a need to explore biological strategies that mitigate the heat accumulation detected by these sensors6. The use of plant growth-promoting microorganisms (PGPM) represents a promising biotechnological approach to enhancing drought tolerance7. Microbial consortia, including fungi such as Trichoderma and various beneficial bacteria, can improve water uptake by modifying root architecture and regulating the antioxidant system8,9. The capacity of microbial consortia to function as physiological buffers or biological support systems for crops against abiotic stress is well-documented. Unlike individual inoculants, these complex communities provide a multi-faceted defense mechanism that stabilizes plant homeostasis under adverse conditions10,11. While the discrete effects of isolated microorganisms have been extensively reported, the synergistic resilience offered by diverse consortia(facilitating continuous nutrient flux and thermal regulation)remains a critical area of biotechnological interest12,13. Research integrating multi-strain consortia and evaluating their impact through high-resolution thermographic analysis in Romaine lettuce is limited.
The objective of this study was to evaluate the effectiveness of a complex microbial consortium (67 strains) compared to a single-strain Trichoderma harzianum inoculation in mitigating water stress. Using infrared thermography and the CWSI as primary diagnostic tools, we aimed to determine if microbial inoculation maintains lower canopy temperatures and higher transpiration rates under different levels of water deficit (50%, 75%, and 100%). This research question focused on whether a highly diversified consortium could provide superior thermal and physiological buffering compared to single-strain treatments. It was hypothesized that the microbial consortium would significantly enhance water stress tolerance, particularly under severe deficit (50%), by maintaining lower CWSI values and preserving key growth parameters, specifically plant height and biomass accumulation. This study addresses a research gap by examining the synergistic effect of diverse microbial populations on the thermal regulation and structural development of lettuce under controlled environmental conditions.
Access restricted. Please log in or start a trial to view this content.
Protocol
The experimental workflow for evaluating the efficacy of microbial inoculants in enhancing water-stress tolerance in Romaine lettuce (Lactuca sativa L. var. Paspartu) is summarized in Figure 1. The protocol integrated continuous monitoring of precise irrigation regimes with periodic acquisition of physiological and thermal data. Two distinct microbial products were utilized: (I) microbial consortium, a complex consortium of 67 strains comprising PGPR, actinomycetes, and beneficial fungi, designed to act as a physiological buffer through root colonization and exopolysaccharide (EPS) secretion; and (II) Trichoderma harzianum, a single-strain inoculant of Trichoderma harzianum aimed at inducing systemic resistance and modifying root architecture. The reagents, equipment, and software used are listed in the Table of Materials.
1. Microbial inoculation
A standardized inoculation regime was implemented for both microbial treatments, consisting of six soil-drenched applications targeting the rhizosphere using high-precision micropipettes to simulate field-scale dosages. The first phase occurred during the seedling stage at 5 and 15 days after sowing (DAS). At 30 DAS, seedlings were transplanted into larger cavity trays, with the second phase of inoculations performed 1 day after transplanting (DAT), followed by successive applications at 7, 15, and 20 DAT.
For the microbial consortium, dosages were adjusted according to plant phenology: the initial two applications were applied at 500 g/ha (3 mL/plant), followed by a high-concentration dose of 2 kg/ha at transplanting, and concluding with three maintenance doses of 300 g/ha. Similarly, T. harzianum was applied at 1 L/ha during the first two stages, 3 L/ha at transplanting, and 1 L/ha for the final three applications. This phased approach was designed to ensure robust root colonization and to maintain the microbial population's role as a physiological buffer throughout the critical growth and stress-induction periods.
2. Crop preparation
Certified Romaine lettuce seeds (Lactuca sativa L. var. Paspartu) were germinated in 311-cavity polystyrene trays (11 mL per cavity) using a professional-grade peat moss-based substrate at a depth of 1 cm. Germination was conducted in a controlled bioclimatic chamber maintained at a temperature range of 15 °C to 22 °C and a relative humidity of 60%–70%. Upon reaching 90% germination (approximately 3–5 days after sowing), seedlings were transplanted into larger trays with a 55 mL root-ball capacity to allow for unrestricted root development (Figure 2 and Figure 3). The trial was organized in a completely randomized design (CRD), with 9 experimental units (trays), and 20 seedlings per tray. This setup was structured to accommodate a 3 × 3 factorial arrangement (3 microbial treatments × 3 irrigation regimes). Detailed substrate physical-chemical properties and specific bioclimatic chamber programming14are provided in Figure 3, Supplementary Table 1, Supplementary Table 2, and Supplementary Table 3.
Experimental trays were distributed using a completely randomized layout within the bioclimatic chamber to eliminate edge effects and ensure uniform exposure. The chamber was programmed to simulate dynamic field-like conditions, utilizing a high-temperature regime to replicate open-field thermal stress. During the vegetative stage, environmental parameters were maintained within a variable relative humidity range, and a 9-h photoperiod provided by high-intensity LED lighting (set above 50% of maximum capacity to ensure adequate photosynthetically active radiation)15. Following the establishment phase, the environmental program was adjusted to reflect the intensifying requirements of the water-deficit treatments, as illustrated in the stepwise atmospheric transitions15 (Figure 4 and Figure 5). Specific diurnal/nocturnal setpoints for temperature, humidity, and light intensity are detailed in Supplementary Table 1 and Supplementary Table 2 to streamline the main protocol.
The fertilization strategy was designed to meet the specific phenological requirements of Romaine lettuce, maintaining a balanced nutrient flux throughout the vegetative cycle. During the seedling stage (12 to 24 DAS), nutrients were supplied via targeted applications of Potassium Nitrate (KNO3), Monopotassium Phosphate (KH2PO4), and Calcium Nitrate (Ca(NO3)2). To enhance early establishment, a commercial biostimulant was supplemented during the first 24 days16.
From 26 DAS through the final evaluation at 76 DAS, the fertigation program transitioned to a maintenance regime where the biostimulant was eliminated to isolate the specific effects of the microbial inoculants. All applications were calibrated to maintain optimal electrical conductivity (EC) and pH within the rhizosphere. The complete chronological schedule of mineral concentrations and specific dosing volumes16is detailed in Supplementary Table 3.
3. Treatment with microorganisms
To evaluate the efficacy of biological interventions against hydric stress, three distinct treatments were established: (I) microbial consortium, a high-diversity microbial consortium comprising 67 beneficial strains, including Plant Growth-Promoting Rhizobacteria (PGPR), Actinomycetes, and fungi; (II) T. harzianum, a specialized single-strain formulation of Trichoderma harzianum; and (III) a non-inoculated Control. These treatments were selected based on their potential for Induced Systemic Tolerance (IST), primarily through mechanisms such as root architecture modification, ACC-deaminase production, and exopolysaccharide (EPS) secretion.
Inoculation followed a phased strategic approach. The initial application (3 mL per plant) was performed via high-precision micropipette directly into the rhizosphere at the second true leaf stage to ensure early root colonization. Subsequent applications were calibrated to field-scale equivalents (simulating a density of 75,000 plants/ha). For T. harzianum, a concentration of 2 L/ha was applied, while the microbial consortium was administered at 1 kg/ha. These formulations were dissolved in the irrigation water and applied every 15 days to maintain a stable microbial population as a physiological buffer throughout the vegetative cycle17.
4. Different irrigation treatments
To evaluate the physiological and agronomic plasticity of L. sativa under varying hydric conditions, three irrigation regimes were implemented based on the replacement of crop evapotranspiration (ETc). The volumetric water content was calibrated against the substrate’s field capacity (FC) to ensure precise stress induction. The regimes were defined as follows: (I) Control/Well-watered (CC-100% ETc), where full evapotranspiration was replenished; (II) Moderate Water Deficit (75% ETc), designed to induce intermediate hydraulic limitation; and (III) Severe Water Deficit (50% ETc), aimed at generating critical water stress. Irrigation was administered daily after capturing thermal images using graduated pipettes to ensure accurate replacement of the volume of water lost through evapotranspiration18.
5. Data and image recording
To evaluate the plants' thermal distribution and water status, infrared thermal images were captured daily from Monday to Friday throughout the experimental period. All photographic recordings were conducted between 12:00 PM and 2:00 PM to standardize measurements during the period of maximum transpiration and solar intensity. It is critical to take these images immediately before the daily irrigation treatments to record the cumulative water stress experienced by the plants over the previous 24-h cycle. For image acquisition, the infrared thermal camera was connected to a mobile device and maintained a perpendicular orientation relative to the back of the lettuce plants at a consistent distance of 60–70 cm. The software was configured with a multi-color thermal palette in which temperature gradients are represented from lowest to highest: starting with purple (coldest), transitioning through royal blue, turquoise, green (midpoint), yellow, orange, and finally red (hottest). Within the software interface, the specific tray area containing the plant canopy was manually selected to capture the thermal data. This color scale serves as a physiological indicator: well-hydrated plants exhibit cooler canopy temperatures (purple/blue) due to active transpiration, while dehydrated plants display higher canopy temperatures (orange/red) due to stomatal closure and reduced evaporative cooling. Subsequently, these high-resolution images were processed using the three-point measurement function over specific regions of interest (ROI) to extract precise canopy temperature (Tc) values for the calculation of the Crop Water Stress Index (CWSI).
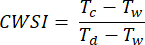
If CWSI is:
 0, then the crop is not under water stress
1 then the crop is under severe water stress
Where:
Tc is the crop canopy temperature, measured with infrared imaging. Tw is the canopy temperature under non-water stress conditions. Td is the canopy temperature under maximum water stress conditions19.
Indicators of plant growth, development, and physiological condition, such as height, leaf number, and leaf temperature, assessed using infrared thermography, are shown in Supplementary Table 4 along with the study variables and conceptual and operational definitions used in the experiment. The combination of these variables allowed for a comprehensive assessment of the impact of the experimental treatments on the physiological performance and development of each plant.
6. Data analysis
Physiological and morphological data were analyzed using a One-Way ANOVA for each irrigation regime to determine the effect of the different microbial treatments. All statistical procedures were performed using statistical software. Before conducting the inferential analysis, the fundamental requirements for parametric statistics were verified to ensure the reliability of the results. The normality of the residuals was confirmed using the Anderson-Darling test (p > 0.100), indicating normality. Additionally, the homogeneity of variances was validated using Levene’s test (p = 0.989), confirming high homoscedasticity across groups. Since both assumptions were met, the Tukey HSD (Honestly Significant Difference) post-hoc test was used to identify significant differences (p < 0.05) among the Treatment means. The individual plant was defined as the experimental unit for all statistical evaluations.
Access restricted. Please log in or start a trial to view this content.
Results
Stress resistance of treatments with respect to hydration at three levels
The physiological and morphological response of lettuce (Lactuca sativa L. var. Paspartu) to water stress was evaluated across three irrigation levels (50%, 75%, and 100%). A one-way factorial ANOVA was conducted to determine the main effects of microbial treatments (Treatments (T): TI: Microbial consortium, TII: Trichoderma harzianum, and TC: Control), days after sowing (DAS), and thei...
Access restricted. Please log in or start a trial to view this content.
Discussion
The empirical evidence derived from this study corroborates that the strategic application of multi-strain microbial consortia functions as a robust biotechnological buffer against the deleterious effects of hydric deficit in Lactuca sativa. Although the global inferential analysis (ANOVA) did not yield statistically significant differences (F = 0.67, p = 0.778), a high-resolution examination of the temporal thermal dynamics reveals a critical numerical mitigation trend. Under the most restrictive irrig...
Access restricted. Please log in or start a trial to view this content.
Disclosures
The authors declare that they have no known competing financial interests or personal relationships that could have influenced the work reported in this paper.
Acknowledgements
The authors would like to acknowledge Humberto Aguirre Becerra for their critical reading of the manuscript.
Access restricted. Please log in or start a trial to view this content.
Materials
| Name | Company | Catalog Number | Comments |
|---|---|---|---|
| Arabidopsis Chamber | Percival Scientific Inc | AR-95L3 | Controlled environment chamber for uniform growth conditions (temperature, humidity, light). |
| Arduino Uno R3 | Arduino | A000066 | Microcontroller board based on the ATmega328P for sensor data processing. |
| Calcium Nitrate | Nouryon Chemicals SA de CV | https://adob.com.pl/en/product/adob-calcium-nitrate/ | Soluble inorganic fertilizer. Composition: 15.2% Nitrogen and 27.5% Calcium. |
| Infrared Thermal Camera | HIKMICRO | https://webassets.hikmicrotech.com /global/asset/d802895de0b44f46 8a49913953e590ff.pdf | High-resolution thermal imaging camera (256 x 192 pixels) for canopy temperature measurement. |
| Lettuce seeds | Enza Zaden | Paspartu | Certified seed of Romaine lettuce (Lactuca sativa L. var. longifolia). |
| Microbial consortium (BPG plus) | Alibio Science SAPI DE CV | https://alibio.ag/productos/bgp-plus | Consortium of 67 strains (fungi, bacteria, actinomycetes). 4x10^8 CFU/g. |
| Monopotassium Phosphate | SQM | https://www.sqmnutrition.com/ec/marca/ultrasol/ultrasol-mkp-4-2 | Soluble inorganic Monopotassium Phosphate fertilizer. Composition: 52%Pphosphorus and 34% Potassium(w/w). |
| Peat Moss Substrate | Sun Gro Horticulture | https://www.sungro.com/professional-product/sun-gro-perlite-free-mix-x-coarse-resilience/ | Canadian Sphagnum Peat Moss, professional grade without vermiculite. |
| Perlite | INVERFARMS MEXICO | https://inverfarms.com/product/ perlita-hortiperl-saco-125-l/?srsltid =AfmBOorwncGHkTcSpgDb9OS bN2-7Mi3ZwQR-uObQte8QQotaD Li-JgLy | High-quality inert substrate used to optimize soil aeration and improve the retention of water and nutrients. |
| Plant growth regulator (RADIX 3000) | Intercontinental SA DE CV | https://www.interie.net/productos | Induces root formation. Active ingredient: Indole-3-Butyric Acid at 0.3% (v/v). |
| Potassium Nitrate | SQM | https://sqm.com/producto/ultrasol-k-plus/ | Soluble inorganic fertilizer. Composition: 13.7% Nitrogen and 46.3% Potassium. |
| R Studio | Free version | https://www.r-project.org/ | R is a free and open-source programming language and software environment used for statistical computing, data analysis, and visualization, widely adopted in science and data science for its powerful modeling tools, rich package ecosystem, and support for reproducible research. |
| Soil Moisture Sensor | Various (Generic) | FC-28 / HW-080 | Resistive soil moisture sensor with LM393 comparator for analog/digital output. |
| Thermography Software | HIKMICRO | Analyzer | Specialized software for thermal image analysis and temperature extraction.D6 |
| Trichoderma harzianum (PROTRI) | Aguilares SPR de RL | N/A Internal reference | Native strain isolated from agricultural soils in Salamanca, Gto. Cultured and standardized for experimental use at Aguilares SPR de RL |
| Vermiculite | INVERFARMS MEXICO | https://inverfarms.com/product/vermiculita-verlite-saco-114-litros/?srsltid=AfmBOoo61hIX-Eg4N-LXUWTY9NLlc5QC5I-iVe85UZRFrNHWQNQ3FwCZ | Expanded vermiculite for tray covering. Density: 60-120 kg/m3. |
Reprints and Permissions
This article has been published
Video Coming Soon