This protocol details a reproducible fuzzy analytic hierarchy process and fuzzy comprehensive evaluation (FAHP-FCE) workflow to quantify the sustainability of digitally assisted international Chinese literature teaching. It operationalizes sustainability across technical, pedagogical, cultural, and policy dimensions, and outputs indicator weights, dimension scores, and an interpretable sustainability index for cross-context comparison.
Method Article
Sustainability of Digital International Chinese Literature Teaching via Fuzzy Analytic Hierarchy Process and Fuzzy Comprehensive Evaluation
Opens in a new tab
In This Article
Summary
Loading...
$$\rightleftharpoonup{xx}$$
$$\longleftharp{xx}$$,
$$\longrightharp{xx}$$,
Abstract
Loading...
$$\rightleftharpoonup{xx}$$
$$\longleftharp{xx}$$,
$$\longrightharp{xx}$$,
This protocol describes a replicable method to evaluate the sustainability of digitally assisted international Chinese literature teaching using a hybrid FAHP–FCE model. The overall goal is to convert multidimensional sustainability judgments into a transparent, quantitative sustainability index (SI). The workflow constructs a four-dimensional indicator system comprising 19 indicators. Expert judgments derive indicator weights via FAHP, while learner and teacher questionnaire responses are mapped to membership degrees using the FCE procedure. Weighted fuzzy synthesis and defuzzification then yield the SI. Representative implementation across three universities in China (237 learners and 9 teachers) produced an overall SI of 78.2 (“Good”), with meaningful regional variation consistent with differences in cultural adaptation and institutional resources. The protocol is highly dependent on convening a credible expert panel. Furthermore, indicators must be operationalized consistently, as differing local policy definitions or curricular goals may complicate direct cross-site comparisons. Future applications should include longitudinal implementation across multiple semesters to test the stability of weights and membership distributions, alongside comparative studies that benchmark this fuzzy approach against alternative multi-criteria models.
Introduction
Loading...
$$\rightleftharpoonup{xx}$$
$$\longleftharp{xx}$$,
$$\longrightharp{xx}$$,
In recent years, the accelerating convergence of globalization and digitalization has reshaped international Chinese education, shifting from technology-assisted classrooms towards digitally native learning ecosystems1,2. Within this shift, Chinese literature courses occupy a distinctive position because they do more than support language acquisition; they also cultivate cultural identity, aesthetic sensibility, and interpretive competence3,4. These outcomes can be especially fragile in digital environments, where prevailing evaluation approaches often prioritize immediate, easily quantifiable cognitive gains while under-representing longer-horizon goals such as emotional resonance, sustained cultural engagement, and interpretive depth5,6. Crucially, this protocol evaluates educational sustainability through the lens of human behavior. By quantifying the cognitive responses, emotional engagement, and instructional behaviors of learners and teachers interacting with digital literature platforms, the framework translates subjective human experiences into measurable behavioral indicators.
Existing assessments remain limited in both scope and duration. Many studies still rely on simplified measures of knowledge mastery7, leaving complex learner experiences such as aesthetic pleasure, cultural empathy, and dialogic interpretation underspecified or treated as peripheral outcomes8,9. Moreover, short observation windows-often shorter than a single semester-may miss cumulative effects, including how digital tools gradually shape learners’ interpretive routines and how teachers’ digital-pedagogical expertise develops through iterative practice10,11. Evaluation frameworks are also frequently fragmented: technical or pedagogical indicators are reported in isolation, while cultural and policy conditions that can constrain or enable sustainable implementation are rarely integrated into one coherent model12. This fragmentation reduces transferability across sites, particularly in cross-cultural literature classrooms, where meaning-making is inherently open-ended and context-sensitive13,14.
While previous research has extensively explored digital tool adoption and short-term cognitive gains in language acquisition, evaluation frameworks remain frequently fragmented. Existing literature lacks comprehensive models that integrate technical, pedagogical, cultural, and policy dimensions into a single measurable standard. This study needs to be conducted to address this critical gap by introducing a standardized FAHP-FCE framework, transitioning from subjective, short-term evaluations to a transparent, reproducible sustainability index that supports cross-site comparison.
To address these limitations, this protocol introduces a reproducible framework for evaluating the sustainability of digitally assisted international Chinese literature teaching. Building on fuzzy multi-criteria decision-making logic, the method integrates fuzzy analytic hierarchy process (FAHP) with fuzzy comprehensive evaluation (FCE)15 to operationalize sustainability across four linked dimensions: technical functionality, pedagogical effectiveness, cultural adaptability, and policy support. The approach is designed to offer three practical advantages over “crisp” scoring models: it transparently derives indicator weights from expert judgments while accommodating linguistic uncertainty; it converts questionnaire responses into membership degrees that better reflect gradated perceptions; and it yields an interpretable Sustainability Index that supports cross-site comparison and sensitivity analysis14,16,17. By embedding interpretive transparency, cross-cultural adaptability, and long-term reliability into the evaluation workflow, the protocol moves beyond short-term outcome checks and provides a transferable assessment tool for other digitally mediated and cross-cultural teaching contexts18.
Access restricted. Please log in or start a trial to view this content.
Protocol
Loading...
$$\rightleftharpoonup{xx}$$
$$\longleftharp{xx}$$,
$$\longrightharp{xx}$$,
Ensured the study complies with institutional human research ethics guidelines and applicable data-protection regulations19,20. Written informed consent was obtained from each participant before any study procedure. Assigned each participant a study code, anonymized all datasets, and stored the linkage key (identifiers <> codes) in a separate, access-restricted file. Restricted raw data access to authorized personnel only, and document the retention period and deletion plan in the ethics application.
1. Preparation of evaluation context and materials
- Define the instructional context (i.e., the specific educational environment, learner demographic profile, and pedagogical framework in which the digitally assisted teaching occurs).
- Specify the course type (international Chinese literature), target population, and delivery mode (in-person, blended, or online).
- Define the minimum learner proficiency threshold (e.g., Chinese Proficiency Test [HSK] level 5 or equivalent) and state the operational eligibility criteria (test certificate, placement result, or instructor confirmation)21,22.
- Specify the term length (weeks), contact hours, platform/tooling constraints (without brand names), and the single evaluation objective: quantify teaching sustainability using a FAHP–FCE workflow23,24,25.
- Compile the materials list
- Record all supplies (forms, instruments, scripts, software, and storage) in the Table of Materials, including: (i) the 19-item learner questionnaire (Supplementary File S1), (ii) the expert pairwise-comparison form (Supplementary File S2), (iii) informed-consent forms, (iv) data-capture templates, and (v) analysis scripts and their versions.
- Assign file names and version identifiers for reproducibility (e.g., Supplementary File S1_questionnaire_items.pdf, Supplementary File S2_expert_form.pdf, fahp_weighting.py, fce_membership.py, si_compute.py, and analysis_readme.txt)26,27.
- Create the workflow diagram (Figure 1)
- Draw a one-page flowchart summarizing sections 1–10, and label inputs/outputs at each handoff (expert judgments > fuzzy matrices > weights; learner responses > membership matrices; synthesis > Sustainability Index).
- Mark PAUSE POINTS (Section 3.2, 4.2, 8.3), which indicate critical stages where the procedure can be safely halted and where specific data artifacts must be archived to ensure reproducibility, and indicate what artifacts must be saved at each point.
2. Construct the indicator framework
- Build a three-level hierarchy.
- Map the evaluation objective to four dimensions (technical functionality, pedagogical effectiveness, cultural adaptability, policy support).
- Define the 19 indicators under the four dimensions (Objective > Dimension > Indicator), and ensure each indicator is measurable via questionnaire response or documented evidence.
- Define indicators and the response format.
- Write an operational definition for each indicator, specify whether it is positive (higher is better) or negative (lower is better), and record the indicator–dimension mapping in a data dictionary (Table 1).
- Specify the learner response scale as a 7-point Likert format with anchors: 1 = strongly disagree; 7 = strongly agree.
NOTE: Finalize and freeze the indicator set for reuse across cohorts and archive the data dictionary and Table 1 version.
3. Assemble the expert panel and collect pairwise judgments (FAHP)
- Recruit an expert panel.
- Recruit a cross-role panel (e.g., literature instructors, educational-technology specialists, assessment researchers, and administrators).
- Define eligibility criteria (years of experience, familiarity with digital instruction, and cross-cultural teaching exposure), and document the panel composition for transparency.
- Collect fuzzy pairwise comparisons.
- Train experts with a short briefing on the dimensions/indicators and the meaning of triangular fuzzy numbers (TFNs)28,29,30.
- Provide explicit anchors and examples to reduce variability (e.g., TFN [2, 3, 4] = “important”; TFN [4, 5, 6] = “very important”).
- Collect pairwise judgments for (i) the four dimensions and (ii) indicators within each dimension and verify completeness before closing the session.
4. Build fuzzy judgment matrices and test consistency
- Construct fuzzy judgment matrices.
- Convert each expert’s pairwise responses into a fuzzy reciprocal matrix at each hierarchy level25.
- Check for missing entries and enforce reciprocity rules before aggregation.
- Test consistency and reconcile disagreements.
- Defuzzify each expert matrix to a crisp matrix using a prespecified rule, such as the centroid of a triangular fuzzy number (TFN)31,32,33. The crisp value is calculated using the following equation:
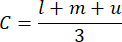
where C is the defuzzified crisp value, and , , and represent the lower bound, modal (most likely) value, and upper bound of the TFN, respectively. - Compute the consistency ratio (CR) on the crisp matrix using the Analytic Hierarchy Process (AHP) procedure34,35. This involves calculating the principal eigenvalue (λmax) of the matrix, determining the consistency index (
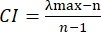 , where n is the matrix size), and dividing it by the appropriate random index (RI) to obtain the CR (
 ). Set the acceptance threshold as CR < 0.10.
 - If CR ≥ 0.10, return the inconsistent comparisons to the expert, reconcile disagreements using facilitated discussion, and recollect only the disputed judgments.
PAUSE POINT: Archive each matrix, CR report, and reconciliation log as replication artifacts.
- Defuzzify each expert matrix to a crisp matrix using a prespecified rule, such as the centroid of a triangular fuzzy number (TFN)31,32,33. The crisp value is calculated using the following equation:
5. Derive fuzzy weights (FAHP output)
- Aggregate individual judgments.
- Aggregate expert matrices into a group-level fuzzy matrix using a specified operator (e.g., fuzzy geometric mean)17,36.
- Record the aggregation operator and parameters in Supplementary File S2.
- Defuzzify and normalize weights.
- Defuzzify the group-level fuzzy priorities to obtain crisp weights using the same prespecified defuzzification rule10.
- Normalize weights within each level (dimensions sum to 1; indicators within each dimension sum to 1) and output the final dimension and indicator weight vectors.
- Populate Table 1 with final weights and lock the table version used for the subsequent FCE section.
6. Design and administer the learner questionnaire
- Prepare the instrument.
- Provide the full 19 items verbatim in Supplementary File S1, each mapped to one indicator in Table 1.
- Use a 7-point Likert scale with clear anchor text printed on every page/screen (1 = strongly disagree; 7 = strongly agree).
- Pilot-test the questionnaire with a small group (e.g., 10–15 learners) to confirm comprehension and completion time37.
- Administer the questionnaire and enforce one unique response per participant.
- Invite eligible learners (HSK 5+ or operational equivalent) and establish a standardized data collection protocol. Specify the exact administration window (e.g., a defined two-week period at the end of the term) and the completion mode (e.g., in-class supervised sessions lasting 15–20 min to ensure focused participation, or controlled online distribution via secure, timed survey links). Instructors or researchers must provide a standardized briefing before questionnaire distribution, clearly explaining the study's purpose, assuring data anonymity, and defining the 7-point Likert scale anchors to all respondents.
- Enforce one response per participant by issuing a single-use access token per learner (or an equivalent one-time code), disabling repeat submissions, and checking for duplicates using the token log.
- If anonymity is required, store tokens separately from responses and hash any login identifiers before analysis.
- Document all exclusion rules (e.g., incomplete responses, duplicate token entries) before data cleaning to prevent post hoc bias.
- Record metadata for subgroup analysis.
- Record comprehensive non-identifying metadata to clearly define the respondent profile for subgroup analysis. For learners, this must include demographic and academic characteristics such as native language group, age, gender, years of Mandarin study, current HSK proficiency level, academic major, course type, and study site. For the expert panel, explicitly record professional demographics including years of teaching experience, highest academic degree obtained, and specific domain expertise (e.g., literature instruction, educational technology).
CAUTION: Protect personally identifiable information and follow approved data-handling procedures.
- Record comprehensive non-identifying metadata to clearly define the respondent profile for subgroup analysis. For learners, this must include demographic and academic characteristics such as native language group, age, gender, years of Mandarin study, current HSK proficiency level, academic major, course type, and study site. For the expert panel, explicitly record professional demographics including years of teaching experience, highest academic degree obtained, and specific domain expertise (e.g., literature instruction, educational technology).
7. Compute membership degrees (FCE)
- Define evaluation grades and numeric scores.
- Define a five-grade evaluation set: Excellent, Good, Moderate, Relatively Poor, Poor.
- Assign numeric scores for grade-to-index conversion (e.g., 90, 80, 70, 60, 50), and record the scoring scheme in Supplementary File S338.
- Specify membership functions and build membership matrices.
- Specify membership functions for mapping Likert responses to grade memberships (e.g., trapezoidal functions)39,40.
- Provide explicit parameters for each grade boundary in Supplementary File S3, and state whether the same parameters apply across all indicators.
- For each indicator, convert each learner response to a 5-element membership vector, then aggregate across learners (e.g., by averaging memberships) to form the indicator-level membership vector.
- Stack all indicator-level membership vectors to construct the indicator-by-grade membership matrix.
8. Perform fuzzy synthesis and derive the sustainability index (SI)
- Apply a weighted fuzzy operator.
- Combine the indicator weight vector with the indicator membership matrix using a specified weighted fuzzy synthesis operator (e.g., weighted average operator) to obtain the comprehensive membership vector41,42.
- Report the operator’s name and formula in Supplementary File S3 to ensure standalone reproducibility.
- Defuzzify to compute SI on a 0–100 scale.
- Convert the comprehensive membership vector to a single SI value by weighted averaging of grade scores (as defined in section 8.1.2).
- Output dimension-level SI values by repeating section 9.1–9.2 within each dimension using dimension-specific indicator weights.
- Classify SI values using prespecified cutoffs: 85–90 = Excellent; 75–84 = Good; 65–74 = Moderate; 55–64 = Relatively Poor; ≤ 54 = Poor.
PAUSE POINT: Store intermediate vectors, matrices, and calculation sheets (or script outputs) with file hashes in a repository.
9. Optional qualitative validation (mixed methods)
- Sample participants for interviews.
- Sample instructors and learners using a purposive scheme aligned with SI patterns (e.g., high vs. low cultural adaptability) and obtain additional consent for recording.
- Use a semi-structured interview guide focused on interpretability of scores, perceived drivers of sustainability, and contextual constraints (Supplementary File S4)43.
- Code and triangulate findings.
- Transcribe recordings verbatim and de-identify transcripts before coding.
- Code transcripts using a prespecified coding scheme, and document coder training, inter-coder agreement (if applicable), and resolution rules44,45.
- Triangulate qualitative themes with dimension-level SI results to contextualize strengths and weaknesses without overriding the quantitative procedure.
10. Report and archive (reproducibility package)
- Report on core outputs.
- Report dimension and indicator weights, membership matrices (or summaries), SI values, grade labels, and subgroup comparisons (e.g., site or proficiency groups).
- State all exclusion rules and the final analyzed sample sizes (ensure consistency with Abstract/Results).
- Archive materials and code.
- Archive anonymized datasets, scripts, and spreadsheets used for FAHP weighting, membership computation, synthesis, and defuzzification.
- Provide software/runtime versions (e.g., programming language version; package versions) and fixed random seeds (if used)46,47.
- Run sensitivity analysis (recommended).
- Perturb indicator weights by ±10% (one-at-a-time or within dimension) while renormalizing, recompute SI, and summarize SI fluctuations to identify leverage points (Table 2).
- Interpret indicators with low weight but high sensitivity as potential “threshold risks,” and report these explicitly.
Access restricted. Please log in or start a trial to view this content.
Results
Loading...
$$\rightleftharpoonup{xx}$$
$$\longleftharp{xx}$$,
$$\longrightharp{xx}$$,
Dimension weights and key indicators
Using the fuzzy analytic hierarchy process (FAHP), the dimension weights indicated that the technical dimension (T) contributed the largest share to sustainability (0.32), followed by the cultural dimension (C, 0.26) and the pedagogical dimension (P, 0.23), whereas the policy dimension (G) received the lowest weight (0.19)17. At the indicator level, the technical dimension prioritized functional iteration efficiency (T3, 0.25)
Access restricted. Please log in or start a trial to view this content.
Discussion
Loading...
$$\rightleftharpoonup{xx}$$
$$\longleftharp{xx}$$,
$$\longrightharp{xx}$$,
This protocol demonstrates that a hybrid FAHP–FCE workflow can operationalize “teaching sustainability” in digitally assisted international Chinese literature courses as a transparent, reproducible index rather than a loosely defined outcome. The results indicate that technical functionality functions as a prerequisite layer for sustainability, with algorithmic interpretability showing the highest sensitivity to sustainability index (SI) fluctuations31. Practically, this pattern ...
Access restricted. Please log in or start a trial to view this content.
Disclosures
Loading...
$$\rightleftharpoonup{xx}$$
$$\longleftharp{xx}$$,
$$\longrightharp{xx}$$,
The authors declare no competing financial interests or personal relationships that could have appeared to influence the work reported in this paper. Artificial intelligence (AI) tools were used solely for language polishing and grammatical editing during the revision of this manuscript; the authors take full responsibility for the content and integrity of the published work.
Acknowledgements
Loading...
$$\rightleftharpoonup{xx}$$
$$\longleftharp{xx}$$,
$$\longrightharp{xx}$$,
The author thanks Yulin Normal University for institutional support. We are grateful to the participating teachers and students for their time and contributions, and to the expert panel members for providing judgments used in the FAHP procedures. We also thank colleagues in the School of Literature and Media for feedback that improved the clarity of the protocol.
Funding: This research is supported by the 2025 Guangxi Universities' Research Capacity Enhancement Program for Young and Middle-aged Teachers: Enhancing Cultural Identity of International Students in Guangxi through Telling Guangxi Stories Well (Project No. 2025KY0659). It is also funded by the 2025 Guangxi Undergraduate Teaching Reform Project: Reconstruction and Practice of the International Chinese Education Curriculum System Oriented Toward ASEAN under the New Liberal Arts Perspective (Project No. 2025JGB347).
Access restricted. Please log in or start a trial to view this content.
Materials
| Name | Company | Catalog Number | Comments |
|---|---|---|---|
| Learner Questionnaire (19-item) | Self-designed | N/A | Used to collect learners’ evaluations of technology, pedagogy, culture, and policy dimensions; 7-point Likert scale |
| Expert Pairwise-Comparison Form | Self-designed | N/A | Used to collect experts’ fuzzy pairwise comparisons for FAHP weight calculation |
| Data-Capture Template & Scripts | Excel / Python | N/A | Used for data storage, membership matrix computation, and Sustainability Index (SI) generation |
Reprints and Permissions
Request permission to reuse the text or figures of this JoVE article
Request Permission