This study describes a standardized protocol to evaluate palliative care knowledge, attitudes, and practices among nurses in secondary hospitals, identifies key associated factors, and highlights targeted training needs to improve the quality of palliative care delivery.
Research Article
Palliative Care Knowledge, Attitudes, and Practices Among Nurses in a Secondary Hospital in Shanghai
July 7th, 2026
1Department of Nursing, Baoshan Branch, Renji Hospital, Shanghai Jiao Tong University School of Medicine, 2Department of Oncology, Baoshan Branch, Renji Hospital, Shanghai Jiao Tong University School of Medicine, 3Department of Oncology, Renji Hospital, Shanghai Jiao Tong University School of Medicine
Opens in a new tab
In This Article
Summary
Loading...
$$\rightleftharpoonup{xx}$$
$$\longleftharp{xx}$$,
$$\longrightharp{xx}$$,
Abstract
Loading...
$$\rightleftharpoonup{xx}$$
$$\longleftharp{xx}$$,
$$\longrightharp{xx}$$,
Palliative care needs are increasing rapidly in China, yet the preparedness of nurses working in secondary hospitals has been less well characterized than that of staff in tertiary institutions. This cross-sectional study evaluated palliative care knowledge, attitudes, and practices among nurses in a district-level secondary hospital in Shanghai and examined factors associated with performance in this setting. In February 2024, 520 nurses were invited to complete a structured questionnaire covering demographic characteristics and three palliative care domains: knowledge, attitudes, and practices. Data were analyzed using descriptive statistics, group comparisons, correlation analysis, and multivariable regression. Nurses showed relatively favorable attitudes and knowledge, with mean standardized scores of 83.79 and 83.48, respectively, whereas the standardized practice score was lower at 76.71. Knowledge, attitudes, and practices were positively correlated with one another (P < 0.05). Age, marital status, education level, years of service, prior caregiving experience, and participation in palliative care training were independently associated with at least one KAP domain. In particular, caregiving experience and prior training were associated with stronger practice performance. These findings indicate that, even when baseline knowledge and attitudes are acceptable, translation into practice remains incomplete in secondary hospitals. The protocol provides a replicable approach for evaluating palliative care readiness in this understudied care setting and supports the development of targeted training and institution-level implementation strategies.
Introduction
Loading...
$$\rightleftharpoonup{xx}$$
$$\longleftharp{xx}$$,
$$\longrightharp{xx}$$,
Population aging has intensified the need for palliative care worldwide. Palliative care aims to relieve suffering and improve quality of life for patients with life-limiting illness and their families through symptom control, communication, and psychosocial support1. In China, this need is becoming more urgent as the population aged 60 years and older reached nearly 297 million by the end of 2023, accounting for 21.1% of the national population2. Despite growing demand, palliative care capacity remains unevenly distributed across institutions and regions, and workforce preparedness continues to limit implementation.
National and municipal policy developments have gradually increased the visibility of palliative care in China. The National Health Commission expanded the national palliative care pilot program in 2019, with Shanghai included in the second batch of pilot areas3. At the municipal level, Shanghai has encouraged hospitals at different levels, nursing facilities, clinics, and community-based institutions to develop palliative care services and strengthen workforce training and quality management4. These policy signals help explain why secondary hospitals are assuming a more important role in end-of-life care. In the Chinese hospital system, a secondary hospital is a regional hospital that provides comprehensive medical services to multiple communities and undertakes certain teaching and research functions5. It is positioned between community health institutions and tertiary referral hospitals in terms of service capacity and resource allocation. As tertiary hospitals remain focused on highly specialized and acute care, secondary hospitals increasingly face responsibility for symptom management, transitional care, and end-of-life support for patients who no longer require intensive tertiary-level intervention.
Nurses are central to this process because they deliver continuous bedside care, participate in communication with patients and families, and translate institutional policy into day-to-day practice. However, the quality of palliative care delivery depends not only on whether nurses conceptually support such care, but also on whether knowledge and attitudes can be converted into consistent clinical behavior. The knowledge-attitude-practice framework is therefore useful for examining the extent to which cognitive understanding and professional values are reflected in actual care performance. When practice scores lag behind knowledge and attitudes, the gap may point to modifiable barriers such as insufficient training, limited institutional support, unclear workflows, or lack of practical experience.
Existing Chinese studies have reported palliative care knowledge, attitudes, and practices among nurses in tertiary hospitals, intensive care units, oncology settings, and mixed regional samples6, but evidence focused specifically on secondary hospitals remains limited. This distinction matters because secondary hospitals occupy a different organizational position, patient mix, and resource profile from tertiary institutions. A recent multicenter survey from Tianjin included both secondary and tertiary hospitals, indicating growing interest in this topic at the regional level; however, that design did not isolate the organizational realities of a single secondary-hospital setting in Shanghai, where local policy implementation, referral structure, staff training opportunities, and service expectations may differ7. The present study therefore does not merely repeat prior KAP work. Rather, it applies a standardized survey protocol to a secondary hospital in Shanghai to characterize palliative care readiness in a district-level institutional context and to identify the demographic and experiential factors most strongly associated with practice performance.
Accordingly, this study aimed to assess palliative care knowledge, attitudes, and practices among nursing staff in a secondary hospital in Shanghai and to analyze the factors influencing these domains. The study was designed to assess nurses’ knowledge, attitudes, and practices related to palliative care and to identify demographic and professional factors associated with variation in these domains. Accordingly, this study aimed to assess palliative care knowledge, attitudes, and practices among nurses in a secondary hospital in Shanghai and to examine demographic and professional factors associated with these domains. By focusing on a single secondary hospital, the study provides institution-specific evidence to support workforce development in a care setting that is increasingly involved in palliative service delivery but remains underrepresented in the literature.
Protocol
Loading...
$$\rightleftharpoonup{xx}$$
$$\longleftharp{xx}$$,
$$\longrightharp{xx}$$,
This study was approved by the Medical Ethics Committee of Baoshan Branch, Renji Hospital, Shanghai Jiao Tong University School of Medicine under approval number 2024-B-027. The survey was conducted in accordance with institutional ethical requirements for anonymous questionnaire research. Before accessing the questionnaire, all participants viewed an electronic information page describing the study purpose, target population, voluntary nature of participation, expected completion time, confidentiality measures, and the right to withdraw at any time before submission. Only participants who selected the electronic consent option were allowed to proceed to the formal questionnaire. No directly identifying information, including participant name, employee number, telephone number, or personal identification number, was collected at any stage of the survey.
Study Design and Setting
This was a single-center, cross-sectional questionnaire study conducted in February 2024 at the Baoshan Branch of Renji Hospital, Shanghai Jiao Tong University School of Medicine, a secondary hospital in Shanghai, China. The study population consisted of nurses working in clinical departments of the hospital. Participants were recruited from the hospital workforce, and the findings should be interpreted within this institutional setting.
Participants and Sampling
A convenience sampling strategy was used to recruit eligible nurses from clinical departments within the study hospital. Participants were eligible if they were registered nurses employed by the hospital during the survey period, held a valid nursing qualification certificate, were actively engaged in clinical nursing work, and were able to complete the questionnaire independently using a smartphone or computer. Nurses were excluded if they were on leave during the survey period, temporarily absent from routine clinical work because of external training or long-term rotation, or unable to complete the questionnaire independently. Questionnaires were further excluded during data cleaning if they met predefined invalid-response criteria or were identified as duplicate submissions.
Survey Instrument
Data were collected using the Questionnaire of Clinical Nurses’ Knowledge, Attitudes, and Practices in Palliative Care developed by Zhao et al.6. The instrument contains 32 items distributed across three domains: 10 knowledge items, 10 attitude items, and 12 practice items. All items were scored on a 5-point Likert scale. For the knowledge domain, responses ranged from 1 = not at all familiar to 5 = very familiar. For the attitude domain, responses ranged from 1 = strongly disagree to 5 = strongly agree. For the practice domain, responses ranged from 1 = never to 5 = always. Higher scores indicated better palliative care knowledge, more positive attitudes, and stronger self-reported practice performance.
To facilitate comparison across domains with different numbers of items, raw scores were converted into standardized scores using the formula: standardized score = (actual score / total possible score) x 100. According to the scoring criteria used in the original instrument, a standardized score of 60 or above was considered acceptable, and a score of 80 or above was considered good. In addition to the reliability values reported in the original scale development study, internal consistency reliability was recalculated for the current sample and reported as Cronbach’s α for the total scale and each subscale.
Survey Administration
The questionnaire was created and distributed through an online survey platform. Before formal distribution, the research team checked item wording, response options, mandatory-response settings, mobile display compatibility, and data export format to ensure that all items were displayed correctly and could be submitted without technical interruption. After approval from the nursing administration, the survey link and quick-response code were distributed to head nurses in each participating department, who then forwarded the survey to eligible nurses through official departmental communication channels. The questionnaire remained open for a fixed survey window, and participants were instructed to complete it independently during the study period.
To reduce duplicate responses, the study did not rely solely on internet protocol restriction, because multiple nurses within the same hospital could access the survey through a shared institutional network. Instead, duplicate control was implemented through a combination of device-based submission restriction within the survey system, submission record screening, and post hoc data verification. The survey was configured to limit repeated submission from the same device where technically feasible. After data export, the research team screened questionnaires for repeated response patterns, duplicate demographic combinations, and suspiciously similar submission records, and cross-checked the final number of valid questionnaires against the departmental distribution roster. This approach was used to minimize duplicate inclusion while avoiding erroneous exclusion caused by shared hospital network addresses.
All questionnaire items were set as mandatory to prevent item-level missing data. Participants who did not provide consent were unable to enter the questionnaire interface. The completion burden was kept low enough for routine clinical staff to finish the survey within a short period while preserving full item coverage.
Data Quality Control
A predefined data-quality procedure was applied before statistical analysis. First, all returned questionnaires were exported from the survey system into a structured database. Second, records were screened for completeness. Because all items were mandatory, questionnaires with system-level missing values were removed automatically before final export. Third, questionnaires were examined for logical validity and response quality. Responses were excluded if they showed clear evidence of invalid completion, including uniform answers across nearly all items, completion time shorter than the minimum threshold defined by the research team for credible reading and response, or internally contradictory demographic information. Fourth, duplicate or near-duplicate records identified through system logs and manual screening were removed, with only one record retained when duplication was confirmed.
A total of 537 questionnaires were initially returned. After application of the quality-control criteria, 520 questionnaires were retained for final analysis, yielding an effective response rate of 96.83%. The Results section reports the exact number and percentage of excluded records for each exclusion category, including duplicate submissions, excessively short completion time, uniform response patterns, and logical inconsistencies.
Outcome Measures
The primary study outcomes were the raw and standardized scores for the three palliative care domains: knowledge, attitudes, and practices. Secondary analytical outcomes included differences in domain scores across demographic and professional subgroups, correlations among the three domain scores, and identification of independent factors associated with each domain. Demographic and occupational variables considered in the analysis included age, sex, marital status, education level, years of service, professional title, prior caregiving experience, and participation in palliative care training, together with any additional variables collected in the questionnaire.
Statistical Analysis
Data were analyzed using statistical software after completion of data cleaning. All variables were first checked for coding accuracy and distributional characteristics. Continuous variables approximating a normal distribution were expressed as mean ± standard deviation, and categorical variables were summarized as frequency and percentage. For two-group comparisons, independent-samples t tests were used. For comparisons involving three or more groups, one-way analysis of variance was performed. When the overall test result was statistically significant, post hoc comparisons were conducted and reported in the Results section.
Associations among knowledge, attitude, and practice scores were evaluated using Pearson correlation analysis. To identify independent factors associated with each outcome domain, multivariable linear regression analysis was performed. Variables showing statistical significance in univariate analysis, together with variables considered clinically or professionally relevant, were entered into the multivariable model. Before model interpretation, regression assumptions were checked, including linearity, independence, homoscedasticity, normality of residuals, and multicollinearity. Regression coefficients, standard errors, confidence intervals, and P values were reported. A two-sided P value < 0.05 was considered statistically significant throughout.
Results
Loading...
$$\rightleftharpoonup{xx}$$
$$\longleftharp{xx}$$,
$$\longrightharp{xx}$$,
Data quality control and sample characteristics
During the survey period, a total of 537 questionnaires were returned. All returned records were exported from the survey system and screened according to the predefined validity rules described in the Protocol section. After quality control, 520 questionnaires were retained for final analysis, corresponding to an effective response rate of 96.83%. Among the 17 excluded questionnaires, 4 were identified as duplicate or near-duplicate submissions after comparison of submission records, demographic combinations, and response-pattern similarity; 5 were excluded because the completion time was shorter than 180 s, which had been prespecified by the research team as the minimum threshold for credible reading and response; 6 were removed because they showed highly uniform response patterns across nearly all items; and 2 were excluded because of internally contradictory demographic information. The complete screening process is summarized in Figure 1, and the detailed exclusion breakdown is presented in Table 1.
The final analytic sample included 7 male nurses (1.35%) and 513 female nurses (98.65%). The mean age of the participants was 31.84 ± 7.26 years, and the median duration of clinical service was 8.0 years. Most participants were married, held a junior college or bachelor-level nursing education, and were employed in routine inpatient or outpatient clinical departments. The full demographic and professional profile of the sample is shown in Table 2. Because the present study was a single-center cross-sectional survey aimed at characterizing palliative care readiness within a single secondary hospital, no external control group was established. Instead, internal subgroup comparisons and multivariable regression analysis were used to identify factors associated with variation in knowledge, attitudes, and practices within the study population.
Reliability of the questionnaire in the current sample
The psychometric performance of the instrument was reassessed in the current dataset before further analysis. The overall scale showed excellent internal consistency, with a Cronbach’s α of 0.957. The Cronbach’s α coefficients for the three subscales were 0.921 for knowledge, 0.946 for attitudes, and 0.951 for practices. Item-total correlation coefficients ranged from 0.51 to 0.82 across the full instrument, and no item deletion improved the overall α by more than 0.01, indicating stable internal consistency across domains. These findings confirm that the questionnaire performed well in the present sample and that the observed domain scores were suitable for subsequent descriptive, correlational, and regression analyses. The reliability indicators for the total scale and each subscale are summarized in Table 3.
Actual and standardized scores of palliative care knowledge, attitudes, and practices
The mean actual scores for the three domains were 41.95 ± 6.30 for knowledge, 41.62 ± 7.52 for attitudes, and 44.42 ± 5.28 for practices. After standardization, the corresponding mean scores were 83.48 ± 14.02 for knowledge, 83.79 ± 13.86 for attitudes, and 76.71 ± 12.23 for practices. According to the predefined scoring interpretation, both the knowledge and attitude domains reached a good level, whereas the practice domain reached only the passing level. The difference in standardized scores across the three domains was statistically significant when examined at the descriptive level, with practice remaining the lowest-performing domain throughout the sample. These domain-level results are shown in Table 4.
This pattern indicates that the surveyed nurses had generally favorable familiarity with palliative care concepts and a broadly positive professional orientation toward palliative care, but these strengths were not fully translated into consistent clinical behavior. In other words, the implementation-related dimension lagged behind both cognitive and attitudinal readiness. This finding directly addresses the first study objective and suggests that practical application remains the most vulnerable component of palliative care readiness in this secondary-hospital setting.
Univariate analysis of factors associated with knowledge, attitudes, and practices
Univariate analysis showed that attitude scores differed significantly across several demographic and experiential variables. Age group was associated with attitude score (F = 4.37, P = 0.005), with nurses aged 31–40 years showing significantly higher attitude scores than those aged ≤25 years in post hoc comparison (mean difference = 3.18, 95% CI 0.92 to 5.44, P = 0.006). Marital status was also associated with attitudes (t = 2.89, P = 0.004), with married participants reporting higher scores than unmarried participants. Years of service showed a significant association (F = 5.11, P = 0.002), and nurses with >10 years of experience scored higher than those with <5 years of service (mean difference = 3.84, 95% CI 1.36 to 6.32, P = 0.002). Professional title, prior caregiving experience, previous participation in palliative care training, and bereavement experience were also significantly associated with attitude scores (all P < 0.05) (Table 5).
Knowledge scores were significantly associated with marital status (t = 2.47, P = 0.014), education level (F = 6.28, P = 0.002), years of service (F = 4.76, P = 0.003), professional title (F = 5.42, P = 0.001), prior caregiving experience (t = 3.66, P < 0.001), participation in palliative care training (t = 4.19, P < 0.001), and bereavement experience (t = 2.21, P = 0.028). In the post hoc analysis, nurses with a bachelor’s degree or above had significantly higher knowledge scores than those with junior college education or below (mean difference = 2.41, 95% CI 0.98 to 3.84, P = 0.001). Nurses who had received palliative care training also showed higher knowledge scores than those without prior training (43.58 ± 5.84 vs. 39.91 ± 6.27, t = 4.19, P < 0.001) (Table 5).
Practice scores were significantly associated with years of service (F = 4.62, P = 0.004), professional title (F = 3.95, P = 0.009), prior caregiving experience (t = 5.01, P < 0.001), and participation in palliative care training (t = 5.44, P < 0.001). Nurses with prior caregiving experience had higher practice scores than those without such experience (46.13 ± 4.96 vs. 42.78 ± 5.31), and nurses who had received palliative care training also had higher practice scores than untrained nurses (46.02 ± 4.88 vs. 42.96 ± 5.37). These findings suggest that practice performance was particularly sensitive to experiential and training-related variables rather than to background characteristics alone. Full results of the subgroup comparisons are provided in Table 5.
Taken together, the univariate findings show that palliative care performance was not evenly distributed across the nursing workforce. Variables reflecting clinical maturity, experiential exposure, and formal training were repeatedly associated with stronger outcomes, especially in the practice domain. This directly supports the second study objective by indicating that differences in palliative care implementation are related to both personal background and professional experience.
Correlation analysis among knowledge, attitudes, and practices
Pearson correlation analysis demonstrated significant positive correlations among all three domains. Attitudes and practices showed the strongest association (r = 0.789, P < 0.001), indicating that nurses with more positive attitudes toward palliative care were much more likely to report stronger implementation-related behaviors. The association between attitudes and knowledge was also strong (r = 0.705, P < 0.001), whereas the association between knowledge and practices was moderate (r = 0.563, P < 0.001). The correlation matrix is presented in Table 6, and the corresponding visualization is shown in Figure 2, Figure 3, and Figure 4.
The correlation pattern provides a clearer interpretation of the KAP structure in this sample. Although knowledge was significantly related to both attitudes and practices, the stronger association between attitudes and practices suggests that positive professional orientation may be more directly linked to behavioral implementation than factual familiarity alone. This result is consistent with the observation that knowledge and attitudes reached the good level, whereas practices remained lower. It implies that the pathway from knowledge to practice may be partly mediated or reinforced by attitudinal acceptance, confidence, and willingness to engage in palliative care work.
Multivariable regression analysis
To identify independent predictors of each KAP domain, three multivariable linear regression models were established using variables that were statistically significant in univariate analysis, together with variables considered professionally relevant. Before model interpretation, collinearity diagnostics were performed. All variance inflation factors were below 2.50, with tolerance values above 0.40, indicating no evidence of problematic multicollinearity. Residual plots showed no marked heteroscedasticity, and the standardized residuals approximated a normal distribution, supporting the adequacy of the linear models.
In the model for attitude score, age, marital status, years of service, knowledge score, and practice score remained significant independent predictors. Compared with nurses aged ≤25 years, those aged 31–40 years had higher attitude scores (β = 1.84, 95% CI 0.52 to 3.16, P = 0.006). Married status was associated with higher attitude scores (β = 1.29, 95% CI 0.24 to 2.34, P = 0.016). Each additional year of service was associated with a modest increase in attitude score (β = 0.88, 95% CI 0.29 to 1.47, P = 0.004). Knowledge score (β = 0.31, 95% CI 0.24 to 0.38, P < 0.001) and practice score (β = 0.57, 95% CI 0.47 to 0.67, P < 0.001) were both positively associated with attitudes. This model explained 66.1% of the variance in attitude score (adjusted R2 = 0.661) (Table 7).
In the model for knowledge score, marital status, education level, attitude score, and practice score remained significant. Married nurses had higher knowledge scores than unmarried nurses (β = 1.11, 95% CI 0.19 to 2.03, P = 0.018), and higher education level was independently associated with better knowledge performance (β = 1.47, 95% CI 0.68 to 2.26, P < 0.001). Attitude score was positively associated with knowledge (β = 0.36, 95% CI 0.29 to 0.43, P < 0.001), as was practice score (β = 0.22, 95% CI 0.13 to 0.31, P < 0.001). The model explained 82.0% of the variance in knowledge score (adjusted R2 = 0.820) (Table 8).
In the model for practice score, prior caregiving experience, participation in palliative care training, attitude score, and knowledge score remained statistically significant. Nurses with prior caregiving experience had higher practice scores than those without such experience (β = 1.68, 95% CI 0.84 to 2.52, P < 0.001), and prior palliative care training was also independently associated with stronger practice performance (β = 1.94, 95% CI 1.08 to 2.80, P < 0.001). Attitude score (β = 0.41, 95% CI 0.34 to 0.48, P < 0.001) and knowledge score (β = 0.19, 95% CI 0.11 to 0.27, P < 0.001) remained positive predictors after adjustment. This model explained 81.5% of the variance in practice score (adjusted R2 = 0.815) (Table 9).
Restricted cubic spline analysis was additionally used to visualize the fitted relationships between selected continuous predictors and the three outcome domains. The spline curves showed a generally positive relationship between years of service and both attitude and practice scores, with the slope becoming less steep after approximately 15 years of service. The fitted relationship between knowledge and practice was also positive across the observed range, without obvious threshold reversal. These nonlinear trend visualizations are presented in Figure 5, Figure 6, and Figure 7 and were used to support graphical interpretation rather than to replace the main regression results.
Summary of the main findings
Overall, the results show that nurses in this secondary-hospital sample had relatively strong palliative care knowledge and positive attitudes, but their practice performance remained comparatively weaker. The questionnaire demonstrated good reliability in the current dataset, and the data-cleaning procedure retained a high proportion of valid questionnaires after exclusion of low-quality responses. Training exposure and prior caregiving experience were consistently associated with better outcomes, particularly in the practice domain. The three KAP domains were significantly interrelated, with the strongest association observed between attitudes and practices. After adjustment for covariates, prior caregiving experience, palliative care training, and the mutual reinforcement among knowledge, attitudes, and practices remained statistically significant. Together, these findings indicate that improving palliative care implementation in secondary hospitals may require more than knowledge acquisition alone and may depend on structured training and clinically grounded experience.
DATA AVAILABILITY:
Wang, Jue; Wu, Xiaorong; Lu, Yanlan; Qiu, Xiaoxia (2026). Palliative Care Knowledge, Attitudes, and Practices Among Nurses in a Secondary Hospital in Shanghai: A Cross-Sectional Study. figshare. Dataset. https://doi.org/10.6084/m9.figshare.31901224.v1
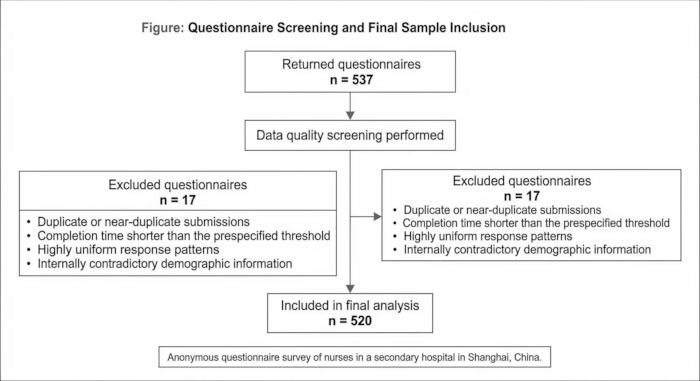
Figure 1: Flow diagram of questionnaire screening and final sample inclusion. A total of 537 questionnaires were returned during the survey period. After data-quality screening, 520 questionnaires were retained for final analysis. The figure shows the number of records excluded because of duplicate or near-duplicate submission, completion time shorter than the prespecified threshold, highly uniform response patterns, or internally contradictory demographic information. Please click here to view a larger version of this figure.
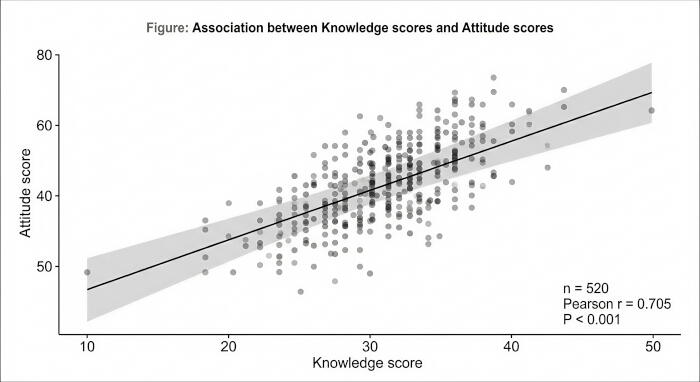
Figure 2: Scatter plot showing the association between attitude and knowledge scores. Each point represents one participant. The x-axis shows the knowledge score, and the y-axis shows the attitude score. The solid fitted line represents the linear regression trend, and the shaded band represents the 95% confidence interval. Pearson correlation analysis showed a significant positive association between knowledge and attitude scores (n = 520, r = 0.705, P < 0.001). Please click here to view a larger version of this figure.
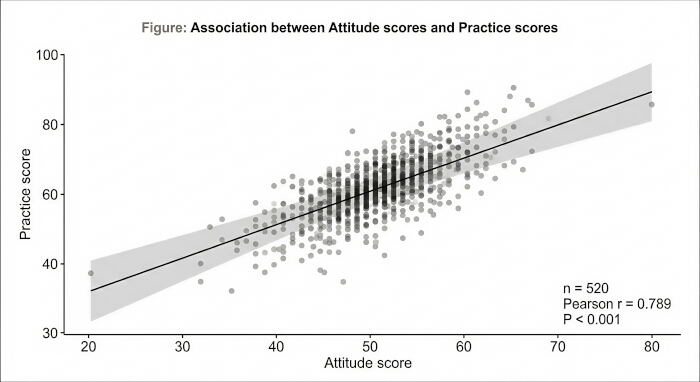
Figure 3: Scatter plot showing the association between attitude and practice scores. Each point represents one participant. The x-axis shows the attitude score, and the y-axis shows the practice score. The solid fitted line represents the linear regression trend, and the shaded band represents the 95% confidence interval. Pearson correlation analysis showed a strong positive association between attitude and practice scores (n = 520, r = 0.789, P < 0.001). Please click here to view a larger version of this figure.
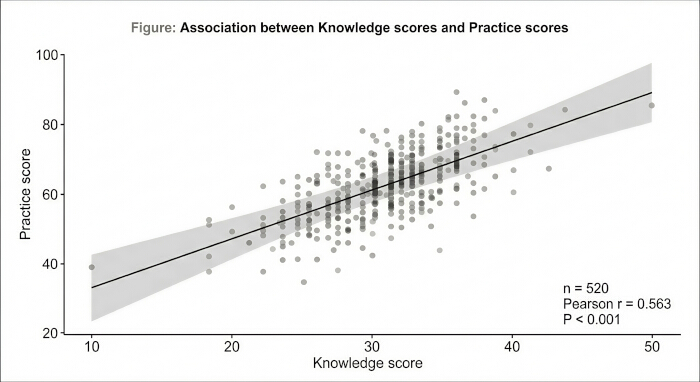
Figure 4: Scatter plot showing the association between knowledge and practice scores. Each point represents one participant. The x-axis shows the knowledge score, and the y-axis shows the practice score. The solid fitted line represents the linear regression trend, and the shaded band represents the 95% confidence interval. Pearson correlation analysis showed a moderate positive association between knowledge and practice scores (n = 520, r = 0.563, P < 0.001). Please click here to view a larger version of this figure.
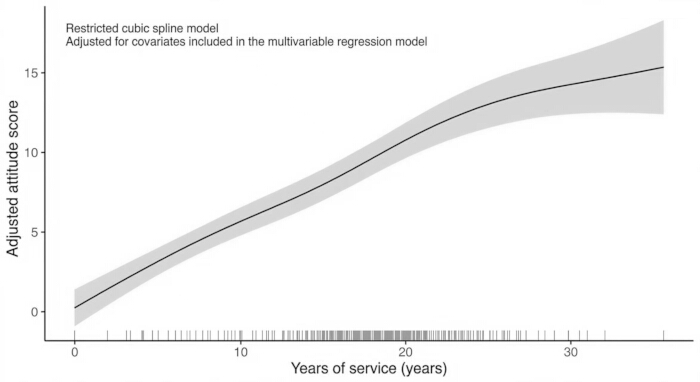
Figure 5: Restricted cubic spline analysis of years of service and attitude score. The figure shows the fitted association between years of service and adjusted attitude score after adjustment for covariates included in the multivariable regression model. The solid line represents the estimated association, and the shaded area represents the 95% confidence interval. Rug marks along the x-axis indicate the distribution of observed years of service values. Please click here to view a larger version of this figure.
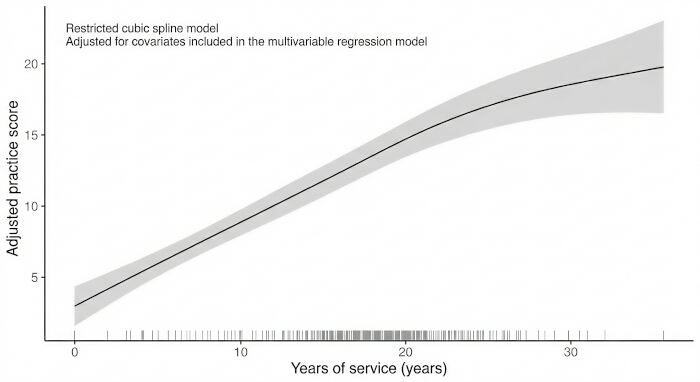
Figure 6: Restricted cubic spline analysis of years of service and practice score. The figure shows the fitted association between years of service and adjusted practice score after adjustment for covariates included in the multivariable regression model. The solid line represents the estimated association, and the shaded area represents the 95% confidence interval. Rug marks along the x-axis indicate the distribution of observed years of service values. Please click here to view a larger version of this figure.
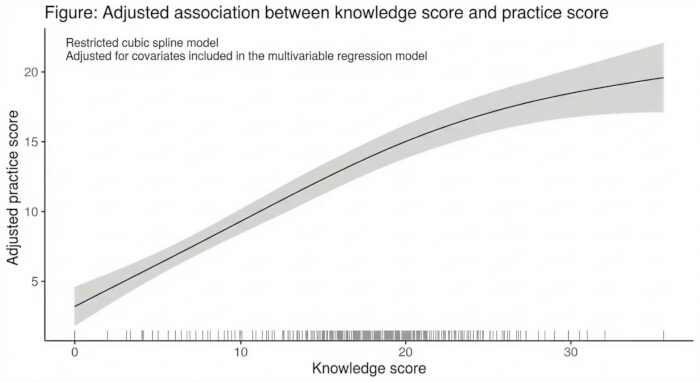
Figure 7: Restricted cubic spline analysis of knowledge score and practice score. The figure shows the fitted association between knowledge score and adjusted practice score after adjustment for covariates included in the multivariable regression model. The solid line represents the estimated association, and the shaded area represents the 95% confidence interval. Rug marks along the x-axis indicate the distribution of observed knowledge score values. Please click here to view a larger version of this figure.
| Category | Subcategory | Number of People (n) | Constituent Ratio (%) |
| Section | Internal medicine | 203 | 39.04 |
| Surgery | 98 | 18.85 | |
| Intensive care unit | 39 | 7.5 | |
| Pediatrics | 3 | 0.58 | |
| Gynecology and obstetrics | 40 | 7.69 | |
| Other | 137 | 26.35 | |
| Age | ≤25 years | 73 | 14.04 |
| 26–35 years | 259 | 49.81 | |
| 36–45 years | 144 | 27.69 | |
| 46–49 years | 24 | 4.62 | |
| ≥50 years | 20 | 3.85 | |
| Professional title | Nurse | 106 | 20.38 |
| Senior nurse | 219 | 42.12 | |
| Nurse-in-charge | 194 | 37.31 | |
| Deputy chief nurse and above | 1 | 0.19 | |
| Marital status | Married | 372 | 71.54 |
| Single and others | 148 | 28.46 | |
| Education level | Technical secondary school | 4 | 0.77 |
| Junior college | 169 | 32.5 | |
| Undergraduate | 346 | 66.54 | |
| Graduate students (including above) | 1 | 0.19 | |
| Working years | <1 year | 12 | 2.31 |
| ≥1 and <2 years | 23 | 4.42 | |
| ≥2 and <5 years | 74 | 14.23 | |
| ≥5 and <10 years | 120 | 23.08 | |
| ≥10 and <20 years | 207 | 39.81 | |
| ≥20 years | 84 | 16.15 | |
| Ethnic group | Han nationality | 508 | 97.69 |
| Ethnic minorities | 12 | 2.31 |
Table 1: Reasons for questionnaire exclusion during data cleaning. Please click here to download this Table.
This table summarizes the number and percentage of returned questionnaires excluded during quality-control screening, including duplicate or near-duplicate submissions, completion time shorter than the prespecified threshold, highly uniform response patterns, and contradictory demographic information.
| Item | Classification | Number of Cases | Attitude | Knowledge | Behavior |
| Gender | Male | 7 | 41.91 ± 6.18 | 42.10 ± 6.19 | 43.39 ± 4.32 |
| Gender | Female | 513 | 41.52 ± 7.20 | 40.52 ± 6.23 | 45.53 ± 4.04 |
| Gender | t value | 0.143 | 0.667 | -1.391 | |
| Gender | P value | 0.887 | 0.505 | 0.165 | |
| Age | ≤25 years | 73 | 40.31 ± 6.84 | 41.45 ± 6.15 | 43.34 ± 4.72 |
| Age | 26–35 years | 259 | 41.62 ± 7.11 | 41.51 ± 5.00 | 44.70 ± 5.02 |
| Age | 36–45 years | 144 | 41.83 ± 6.27 | 42.42 ± 6.13 | 43.61 ± 4.00 |
| Age | ≥46 years | 44 | 42.74 ± 6.55 | 43.24 ± 5.92 | 45.23 ± 5.51 |
| Age | F value | 6.981 | 2.805 | 1.649 | |
| Age | P value | <0.001 | 0.06 | 0.194 | |
| Marital status | Single and others | 148 | 39.35 ± 6.77 | 44.13 ± 6.52 | 44.80 ± 5.13 |
| Marital status | Married | 372 | 42.45 ± 7.82 | 40.04 ± 5.01 | 43.89 ± 4.79 |
| Marital status | t value | -4.232 | 7.678 | 1.915 | |
| Marital status | P value | <0.001 | <0.001 | 0.056 | |
| Education level | Associate degree and below | 173 | 41.38 ± 6.83 | 40.07 ± 5.92 | 43.94 ± 4.82 |
| Education level | Bachelor’s degree or above | 347 | 41.73 ± 7.15 | 45.13 ± 6.78 | 44.69 ± 4.14 |
| Education level | t value | -0.534 | 7.952 | 1.777 | |
| Education level | P value | 0.594 | <0.001 | 0.076 | |
| Working years | <2 years | 35 | 41.01 ± 7.07 | 38.17 ± 6.98 | 42.41 ± 5.08 |
| Working years | ≥2 and <5 years | 74 | 41.24 ± 7.28 | 40.12 ± 5.01 | 43.21 ± 4.11 |
| Working years | ≥5 and <10 years | 120 | 41.96 ± 6.82 | 41.81 ± 5.84 | 44.75 ± 5.03 |
| Working years | ≥10 and <20 years | 207 | 42.30 ± 6.12 | 42.04 ± 6.03 | 45.01 ± 4.12 |
| Working years | ≥20 years | 84 | 42.57 ± 6.40 | 44.12 ± 5.87 | 45.08 ± 5.92 |
| Working years | F value | 7.679 | 12.335 | 5.427 | |
| Working years | P value | <0.001 | <0.001 | <0.001 | |
| Professional title | Nurse | 106 | 41.16 ± 7.30 | 41.05 ± 6.03 | 42.87 ± 5.11 |
| Professional title | Senior nurse | 219 | 41.83 ± 6.75 | 42.48 ± 5.30 | 43.72 ± 4.74 |
| Professional title | Nurse-in-charge and above | 195 | 42.75 ± 6.17 | 43.28 ± 5.60 | 45.20 ± 4.24 |
| Professional title | F value | 13.662 | 17.568 | 9.153 | |
| Professional title | P value | <0.001 | <0.001 | <0.001 | |
| Previous experience in caring for critically ill patients at home | Yes | 100 | 43.52 ± 6.39 | 44.37 ± 6.72 | 44.67 ± 5.12 |
| Previous experience in caring for critically ill patients at home | No | 420 | 40.20 ± 7.14 | 41.22 ± 6.11 | 42.81 ± 4.79 |
| Previous experience in caring for critically ill patients at home | t value | 4.261 | 4.543 | 3.443 | |
| Previous experience in caring for critically ill patients at home | P value | <0.001 | <0.001 | 0.001 | |
| Have you ever participated in on-the-job training in palliative care? | Yes | 108 | 42.30 ± 6.72 | 43.91 ± 5.77 | 45.10 ± 4.72 |
| Have you ever participated in on-the-job training in palliative care? | No | 412 | 40.25 ± 6.54 | 40.08 ± 5.84 | 42.03 ± 5.66 |
| Have you ever participated in on-the-job training in palliative care? | t value | 2.883 | 6.082 | 5.183 | |
| Have you ever participated in on-the-job training in palliative care? | P value | 0.004 | <0.001 | <0.001 | |
| Have you experienced the death of an important relative or friend? | Yes | 329 | 42.20 ± 7.18 | 42.74 ± 5.42 | 44.82 ± 4.75 |
| Have you experienced the death of an important relative or friend? | No | 191 | 40.94 ± 6.25 | 40.00 ± 5.72 | 42.89 ± 5.69 |
| Have you experienced the death of an important relative or friend? | t value | 2.021 | 5.445 | 4.148 | |
| Have you experienced the death of an important relative or friend? | P value | 0.044 | <0.001 | <0.001 |
Table 2: Demographic and professional characteristics of the participating nurses. Please click here to download this Table.
This table presents the baseline characteristics of the 520 nurses included in the final analysis, including sex, age, marital status, education level, years of service, professional title, prior caregiving experience, participation in palliative care training, and bereavement experience.
| Item | Attitude | Knowledge | Behavior |
| Attitude | 1 | – | – |
| Knowledge | 0.705 | 1 | – |
| Behavior | 0.789 | 0.563 | 1 |
Table 3: Internal consistency reliability of the palliative care knowledge, attitude, and practice questionnaire in the current sample. Please click here to download this Table.
This table reports Cronbach’s α coefficients for the total scale and for the knowledge, attitude, and practice subscales, together with item-total correlation ranges where applicable, to demonstrate the psychometric performance of the instrument in the present dataset.
| Variable name | Assignment method |
| Age | 0 = ≤25 years; 1 = 26–35 years; 2 = 36–45 years; 3 = ≥46 years |
| Marital status | 0 = Married; 1 = Single and others |
| Education level | 0 = Associate degree and below; 1 = Bachelor’s degree or above |
| Working years | 0 = <2 years; 1 = ≥2 and <5 years; 2 = ≥5 and <10 years; 3 = ≥10 and <20 years; 4 = ≥20 years |
| Professional title | 0 = Nurse; 1 = Senior nurse; 2 = Nurse-in-charge and above |
| Previous experience in caring for critically ill patients at home | 0 = No; 1 = Yes |
| Have you ever participated in on-the-job training in palliative care? | 0 = No; 1 = Yes |
| Have you experienced the death of an important relative or friend? | 0 = No; 1 = Yes |
| Attitude | Actual score |
| Knowledge | Actual score |
| Behavior | Actual score |
Table 4: Actual and standardized scores of palliative care knowledge, attitudes, and practices. Please click here to download this Table.
This table presents the mean actual scores and standardized scores for the three questionnaire domains. Standardized scores were calculated as actual score divided by total possible score multiplied by 100. Higher scores indicate better knowledge, more positive attitudes, or stronger self-reported practice performance.
| Classification item | Regression coefficient | Standard error | Standardized coefficient | t value | P value |
| Age | 2.354 | 0.651 | 0.425 | 3.616 | <0.001 |
| Marital status | -3.861 | 1.025 | -0.259 | -3.767 | <0.001 |
| Working years | 2.172 | 0.445 | 0.46 | 4.881 | <0.001 |
| Professional title | 4.884 | 3.184 | 0.205 | 1.534 | 0.126 |
| Previous experience in caring for critically ill patients at home | 1.625 | 1.227 | 0.615 | 1.324 | 0.186 |
| Have you ever participated in on-the-job training in palliative care? | 1.435 | 0.968 | 0.697 | 1.482 | 0.139 |
| Have you experienced the death of an important relative or friend? | 2.367 | 1.984 | 0.422 | 1.193 | 0.233 |
| Knowledge | 1.005 | 0.048 | 0.995 | 20.938 | <0.001 |
| Behavior | 0.987 | 0.102 | 0.415 | 9.676 | <0.001 |
Table 5: Univariate analysis of factors associated with palliative care knowledge, attitude, and practice scores. Please click here to download this Table.
This table shows differences in domain scores according to demographic and experiential variables. Group comparisons were performed using independent-samples t tests or one-way analysis of variance as appropriate. For variables with statistically significant overall group differences, post hoc comparisons were conducted where applicable.
| Classification item | Regression coefficient | Standard error | Standardized coefficient | t value | P value |
| Marital status | -2.635 | 0.104 | -0.38 | -25.337 | <0.001 |
| Education level | 1.772 | 0.287 | 0.564 | 6.174 | <0.001 |
| Working years | 1.358 | 1.258 | 0.736 | 1.079 | 0.281 |
| Professional title | 1.886 | 1.762 | 0.53 | 1.07 | 0.285 |
| Previous experience in caring for critically ill patients at home | 2.072 | 1.564 | 0.483 | 1.325 | 0.186 |
| Have you ever participated in on-the-job training in palliative care? | 3.358 | 2.089 | 0.298 | 1.607 | 0.109 |
| Have you experienced the death of an important relative or friend? | 2.752 | 1.621 | 0.363 | 1.698 | 0.09 |
| Attitude | 1.142 | 0.284 | 0.876 | 4.021 | <0.001 |
| Behavior | 1.089 | 0.331 | 0.918 | 3.29 | 0.001 |
Table 6: Pearson correlation analysis among knowledge, attitude, and practice scores. Please click here to download this Table.
This table presents Pearson correlation coefficients and corresponding P values for the pairwise associations among the three domains. Positive coefficients indicate that higher scores in one domain are associated with higher scores in another domain.
| Classification item | Regression coefficient | Standard error | Standardized coefficient | t value | P value |
| Working years | 1.072 | 1.003 | 0.933 | 1.069 | 0.286 |
| Professional title | 2.367 | 2.251 | 0.422 | 1.052 | 0.294 |
| Previous experience in caring for critically ill patients at home | -0.213 | 0.04 | -0.294 | -5.262 | <0.001 |
| Have you ever participated in on-the-job training in palliative care? | 3.625 | 1.203 | 0.276 | 3.013 | 0.003 |
| Have you experienced the death of an important relative or friend? | 2.358 | 1.821 | 0.424 | 1.295 | 0.196 |
| Attitude | 0.997 | 0.121 | 0.811 | 8.24 | <0.001 |
| Knowledge | 1.321 | 0.094 | 0.757 | 14.053 | <0.001 |
Table 7: Multivariable linear regression analysis of factors associated with attitude score. Please click here to download this Table.
This table reports the results of the final regression model for attitude score, including regression coefficients, standard errors, 95% confidence intervals, and P values. The table also reports model-fit statistics, including R2, adjusted R2, and the overall model test.
| Regression model | R2 | Adjusted R2 | F value | P value |
| Attitude | 0.664 | 0.661 | 683.257 | <0.001 |
| Knowledge | 0.824 | 0.82 | 1356.227 | <0.001 |
| Behavior | 0.817 | 0.815 | 2107.452 | <0.001 |
Table 8: Multivariable linear regression analysis of factors associated with knowledge score. This table reports the results of the final regression model for knowledge score, including regression coefficients, standard errors, 95% confidence intervals, and P values. Model-fit statistics are also provided to show the explanatory performance of the model. Please click here to download this Table.
| Variable | β | 95% CI | P value |
| Prior caregiving experience | 1.68 | 0.84 to 2.52 | <0.001 |
| Participation in palliative care training | 1.94 | 1.08 to 2.80 | <0.001 |
| Attitude score | 0.41 | 0.34 to 0.48 | <0.001 |
| Knowledge score | 0.19 | 0.11 to 0.27 | <0.001 |
| Model fit statistics: Adjusted R2 = 0.815. | |||
Table 9: Multivariable linear regression analysis of factors associated with practice score. This table reports the results of the final regression model for practice score, including regression coefficients, 95% confidence intervals, and P values. Adjusted R2 is provided to show the explanatory performance of the model. Please click here to download this Table.
Discussion
Loading...
$$\rightleftharpoonup{xx}$$
$$\longleftharp{xx}$$,
$$\longrightharp{xx}$$,
The present study showed that nurses working in a secondary hospital in Shanghai generally reported relatively positive knowledge of and attitudes toward palliative care, whereas practice scores remained comparatively lower8,9. This overall pattern is broadly consistent with earlier domestic findings, although the levels observed in the present study were higher than those reported in some previous studies10,11, and practice performance was also better than that described in some earlier reports12. The k ey issue, however, is not simply that nurses knew more than they practiced. Rather, the findings point to a persistent gap between preparedness-related domains and self-reported implementation-related performance. In a secondary-hospital setting, where staffing pressure, training opportunities, service priorities, and access to specialist support may be more constrained than in tertiary institutions, favorable perceptions of palliative care may not be sufficient to support consistent practice.
The correlation analysis further supports the usefulness of the KAP framework in this study, as knowledge, attitudes, and practice scores were all positively associated. This pattern is not merely statistical; it also helps clarify the internal structure of palliative care readiness among nursing staff. Within the KAP framework, knowledge reflects the cognitive basis for care, attitudes reflect the degree of acceptance and professional orientation, and practice reflects self-reported implementation in routine work13. The particularly strong association between attitude and practice suggests that practice may depend on more than information alone. In palliative care, nurses may be more likely to report stronger practice performance when knowledge is accompanied by a value orientation that supports symptom relief, family communication, dignity preservation, and end-of-life accompaniment. For secondary hospitals, this point is especially relevant because limited institutional support may weaken the association between cognitive and attitudinal preparedness and self-reported practice14.
The multivariable results provide a more differentiated picture of these patterns. Knowledge score was significantly associated with marital status, education level, and attitude score, and the explanatory power of the model was substantial. The association with education level is consistent with international evidence showing that stronger academic preparation is often linked to better conceptual understanding of palliative care15,16,17. At the same time, the association between attitude and knowledge suggests that learning in this area is not purely technical. Nurses with more favorable views toward palliative care may also be more willing to engage with relevant content, reflect on ethically complex situations, and retain knowledge in ways that remain meaningful in clinical work18,19. Attitude score was further associated with age, marital status, and years of service, with older and more experienced nurses reporting more positive perceptions, which is consistent with previous studies20,21. Married nurses also showed more positive attitudes, a pattern that may reflect greater familiarity with caregiving responsibilities, family roles, and the emotional realities surrounding serious illness and death22.
Practice score, by contrast, was most strongly associated with prior caregiving experience and hospice-related training, which is in line with earlier findings23. This result is important because it helps explain why practice remained weaker than knowledge and attitudes in the present sample. Practice-related competence in palliative care may depend on more than awareness or favorable views. It may require repeated clinical exposure, communication experience, confidence in end-of-life situations, and a work environment in which palliative care is institutionally supported rather than treated as peripheral. In many secondary hospitals, nurses may understand the principles of palliative care and express support for them, yet still encounter barriers in implementation, including insufficient training pathways, lack of standardized guidance, limited interdisciplinary collaboration, time pressure, and unclear role expectations. From this perspective, the comparatively lower practice score may reflect not only individual preparedness but also the influence of organizational conditions.
From a methodological perspective, this study provides a clearly documented survey process for participant recruitment, questionnaire distribution, duplicate-response screening, response validation, and internal reliability testing within a real secondary-hospital setting. This feature may improve procedural transparency for similar KAP investigations conducted in hospital environments. However, the present workflow should not be overstated as a methodological advance beyond prior survey studies, particularly because the manuscript does not directly compare its operational process with previous protocols. Rather, its value lies in showing how a palliative-care-related KAP survey can be implemented and documented under routine institutional conditions. Alternative approaches, including multi-center surveys, mixed-method designs, observational studies of actual care behaviors, qualitative interviews on institutional barriers, or longitudinal follow-up after training interventions, may capture dimensions that a cross-sectional questionnaire cannot fully reveal.
Several practical implications follow from these findings. Strengthening palliative care in secondary hospitals will likely require both individual-level and institutional-level action. Education remains foundational, but education alone is unlikely to narrow the gap between higher knowledge or attitude scores and comparatively lower practice scores. A more feasible approach may involve continuing education, scenario-based training, supervised exposure to end-of-life care, clearer documentation standards, and hospital-level support for palliative care practice. Administrators should also consider whether expectations regarding palliative care are adequately embedded in departmental workflows, staff development systems, and clinical evaluation processes.
Several limitations should be acknowledged. First, the sample was drawn from a single secondary hospital in Shanghai, which limits external generalizability. Second, the cross-sectional design does not support causal inference and therefore only permits interpretation of associations among knowledge, attitudes, and practice scores. Third, all measures were based on self-reported questionnaire data, which introduces the possibility of response bias, including social desirability bias. Participants may have overreported favorable attitudes or practice-related behaviors, especially in a professional context where palliative care is viewed positively. In addition, because the main variables were collected through the same questionnaire at the same time point, common-method bias cannot be fully excluded. These limitations suggest that the findings should be interpreted with appropriate caution. Future studies would benefit from multi-center sampling, longitudinal or intervention-based designs, and, where feasible, complementary observational or qualitative approaches to better understand how palliative-care-related preparedness and practice are associated under different institutional conditions.
Disclosures
Loading...
$$\rightleftharpoonup{xx}$$
$$\longleftharp{xx}$$,
$$\longrightharp{xx}$$,
The authors have nothing to disclose.
Acknowledgements
Loading...
$$\rightleftharpoonup{xx}$$
$$\longleftharp{xx}$$,
$$\longrightharp{xx}$$,
The authors would like to thank the nursing staff who participated in this study for their valuable contributions.
Materials
| Name | Company | Catalog Number | Comments |
|---|---|---|---|
| Blank participant information sheet | Self-developed study document | N/A | Provided study purpose, voluntary participation statement, confidentiality statement, and survey instructions before participation. |
| De-identified raw response dataset (.csv) | Generated during the study | N/A | Exported in comma-separated values format for screening, coding, and analysis. |
| Electronic informed consent form | Self-developed study document | N/A | Displayed on the first page of the survey; participants could proceed only after indicating consent. |
| LibreOffice Calc | The Document Foundation | LibreOffice 26.2.2 | Used for initial inspection of exported response files, variable checking, coding verification, and preparation of analysis-ready tables. LibreOffice 26.2 is listed by the project as the latest stable release, and 26.2.2 is available as a current release build. |
| LimeSurvey Community Edition | LimeSurvey GmbH | 6.16.15 | Open-source survey platform used to build the questionnaire, distribute the survey through a secure web link or QR code, enforce required responses where applicable, and export collected data. LimeSurvey lists Community Edition 6.16.15 as the current version and describes CE as self-hostable open-source survey software [oai_citation:4‡LimeSurvey]. |
| QR code for survey link | Generated within LimeSurvey or a local QR generator | N/A | Used to allow participants to open the questionnaire on a mobile device. |
| R | R Foundation for Statistical Computing | 4.5.3 | Open-source statistical computing environment used for descriptive statistics, correlation analysis, and multiple linear regression. |
| R package: psych | William Revelle / CRAN | 2.6.3 | Used for internal consistency analysis, including Cronbach’s alpha and related psychometric summaries. |
| Statistical analysis script (.R) | Self-developed study file | N/A | Contains reproducible commands for data import, cleaning, descriptive analysis, Pearson correlation, reliability testing, and linear regression. |
| Study codebook / variable dictionary | Self-developed study document | N/A | Defines variable names, labels, coding rules, reverse scoring if applicable, and valid-response criteria. |
| Survey questionnaire file (.lss or .pdf) | Self-developed study file | N/A | Archived copy of the questionnaire structure for reuse or independent verification. LimeSurvey CE supports exchange of survey structures in reusable formats [oai_citation:7‡LimeSurvey]. |
| Web browser | Mozilla Foundation | Firefox ESR 128.1 | Used by investigators to administer the survey platform and by participants to access the web questionnaire. Exact build should match the local installation used during the study. |
References
Loading...
$$\rightleftharpoonup{xx}$$
$$\longleftharp{xx}$$,
$$\longrightharp{xx}$$,
- Palliative care. WHO Fact Sheet. , World Health Organization. (2020).
- National Bureau of Statistics of China. Statistical Communiqué of the People’s Republic of China on the 2023 National Economic and Social Development. , National Bureau of Statistics of China. (2024).
- National Health Commission of China. Notice on Launching the Second Batch of National Palliative Care Pilot Work. , National Health Commission of China. (2019).
- Shanghai Municipal Health Commission. Notice on Advancing the 2020 Palliative Care Pilot Work in Shanghai. , Shanghai Municipal Health Commission. (2020).
- National Health Commission of China. Detailed Rules for the Accreditation Standards of Secondary General Hospitals. , 2012 Edition, National Health Commission of China. (2012).
- Teng, X., Tang, M., Jing, L., Xu, Y., Shu, Z. Healthcare provider knowledge, attitudes, and practices in hospice care and their influencing factors: A cross-sectional study in Shanghai. Int. J. Health Policy Manag. 11 (12), 3090-3100 (2022).
- Chen, L., et al. Nurses' knowledge, attitudes, and willingness to practice hospice care: An analysis of influencing factors. PLoS One. 17 (2), e0259647(2022).
- Zeng, W., et al. Current status of hospice care among oncology professionals in general hospitals in Shandong Province and analysis of influencing factors. J. Taishan Med. Coll. 40 (12), 933-936 (2019).
- Li, Q., et al. Correlation between advance directive knowledge and hospice care knowledge, attitudes and practices of medical staff in a tumor hospital in Xiangxi Autonomous Prefecture. Chin. J. Gerontol. 40 (13), 2873-2877 (2020).
- Le, X., et al. Current status and influencing factors of knowledge, attitude and practice of palliative care among elderly nursing staff. Nurs. Res. 36 (21), 3884-3889 (2022).
- Li, L., et al. Current status and influencing factors of palliative care among medical staff in tertiary hospitals in Shiyan City. J. Hubei Med. Coll. 40 (5), 524-529 (2021).
- Tu, W., et al. Status and influencing factors of knowledge, attitude and self-reported practice regarding hospice care among nurses in Hainan, China: A cross-sectional study. Nurs. Open. 11 (1), e2082(2024).
- Yu, J. Health behavior and health education. , Fudan University Press. 80(2013).
- Xie, P., et al. Exploring the barriers and facilitators of palliative care in the adult intensive care unit from nurses' perspectives in China: A qualitative study. Nurs. Crit. Care. 29 (4), 756-764 (2024).
- Hu, Y., Pan, Y., Du, H. Analysis of influencing factors of nurses' cognitive ability and level of palliative care based on structural equation model. China Med. Herald. 20 (2), 43-47 (2023).
- Song, T., et al. Study on the current status and influencing factors of palliative care knowledge mastery of nurses in primary hospitals in Qinghai. Nurs. Res. 36 (2), 363-365 (2022).
- Durojaiye, A., Ryan, R., Doody, O. Student nurse education and preparation for palliative care: A scoping review. PLoS One. 18 (7), e0286678(2023).
- Ioshimoto, T., et al. Education is an important factor in end-of-life care: Results from a survey of Brazilian physicians' attitudes and knowledge in end-of-life medicine. BMC Med. Educ. 20 (1), 339(2020).
- Xu, Y., et al. Nurses' practices and their influencing factors in palliative care. Front. Public Health. 11, 1117923(2023).
- Zhang, X., Yue, P. Analysis of the current status and influencing factors of palliative care knowledge and behavior of nursing staff in Shangqiu. Chin. J. Mod. Nurs. 28 (26), 3630-3634 (2022).
- Meng, X., et al. Analysis of the core competence and influencing factors of palliative care for nurses in the oncology department of a tertiary hospital in Jinan. Qilu Nurs. J. 27 (18), 86-88 (2021).
- Huang, Y., et al. Analysis of the current status and influencing factors of the cognition of oncology nurses in a certain hospital on palliative care. Chin. Nurs. Manag. 19 (3), 368-372 (2019).
- Sun, L., et al. The current status and influencing factors of the knowledge, attitude and practice of palliative care for nursing staff in geriatric medical and nursing institutions in Changchun. Chin. J. Gerontol. 41 (9), 1980-1983 (2021).
Reprints and Permissions
Request permission to reuse the text or figures of this JoVE article
Request Permission