This study presents a describes a deep learning-based workflow for early detection of diabetic retinopathy using preprocessed fundus images and optimized convolutional neural network architectures, enabling accurate disease classification and explainable lesion localization for scalable clinical application.
A subscription to JoVE is required to view this content. Sign in or start your free trial.
Method Article
Robust Deep Learning Framework for Early Diabetic Retinopathy Detection Using Preprocessed Fundus Images and Optimized CNNs
In This Article
Summary
Abstract
Diabetic retinopathy (DR) is a leading cause of vision loss globally, particularly among patients with poorly controlled diabetes. Early detection through automated image analysis has emerged as a scalable solution to support timely intervention. Deep learning-based models, particularly convolutional neural networks (CNNs), have shown significant promise in DR detection from retinal fundus images. This study aimed to (i) develop an ensemble deep learning framework using EfficientNetB0 and DenseNet121 for five-stage DR classification, (ii) systematically evaluate the impact of fundus image preprocessing on diagnostic performance, (iii) incorporate Grad-CAM-based visual explanations for lesion localization, and (iv) achieve high diagnostic accuracy with computational efficiency suitable for scalable screening. A dataset comprising 53,412 fundus images from EyePACS, APTOS 2019, and a tertiary-care centre in China was curated. Preprocessing steps included contrast-limited adaptive histogram equalization (CLAHE), artifact removal, and normalization. Transfer learning was applied using EfficientNetB0 and DenseNet121 backbones, followed by hybrid assembling. The models were evaluated using accuracy, macro-AUC, sensitivity, specificity, and F1-score. Grad-CAM was used to visualize lesion localization. The hybrid ensemble model achieved 91.2% accuracy, 0.961 macro-AUC, 92.1% sensitivity, and an F1-score of 0.913. Preprocessing improved performance by 3-4%, and the ensemble approach outperformed standalone CNNs. Grad-CAM overlays confirmed accurate lesion localization. Model performance was evaluated for both five-stage DR grading and binary referable DR detection to reflect clinical screening requirements. This study presents a clinically viable, explainable deep learning model for DR detection. Future work will include external validation on independent datasets, prospective real-world evaluation, and model optimization (e.g., pruning and quantization) for mobile and point-of-care screening applications.
Introduction
DR is a microvascular complication of diabetes mellitus and remains one of the leading causes of avoidable visual impairment worldwide1. Chronic hyperglycemia induces damage to retinal capillaries, leading to increased vascular permeability, microaneurysm formation, hemorrhages, exudates, and in advanced stages, neovascular proliferation. Without timely intervention, these changes may progress to vitreous haemorrhage, tractional retinal detachment, and irreversible vision loss1,2. Epidemiological studies estimate that approximately 35 percent of individuals with diabetes exhibit some degree of DR, with nearly 10 percent developing vision-threatening retinopathy each year2. Global trends indicate that the prevalence of DR has risen substantially over the past two decades. A landmark meta-analysis reported an increase in DR prevalence from 13.6 percent in the early 2000s to over 20 percent by 20202. Similarly, the incidence of sight-threatening DR and diabetic macular edema has demonstrated an upward trajectory, particularly in low and middle-income regions3. Limited access to ophthalmic screening services in rural and economically disadvantaged areas contributes to delayed diagnosis and treatment5.
Early detection of DR is critical, as interventions during non-proliferative stages, such as focal or pan-retinal laser photocoagulation, intravitreal anti-vascular endothelial growth factor (anti-VEGF) therapy, and vitrectomy, can effectively prevent progression to visual loss6. Nevertheless, conventional screening programs often rely on manual grading of color fundus photographs by trained specialists, a resource-intensive process that constrains scalability and timely coverage5. Teleophthalmology initiatives have partially addressed these gaps, yet they still depend on limited expert availability and standardized imaging protocols 7. Advances in artificial intelligence (AI), particularly deep learning (DL), have introduced automated solutions capable of detecting and grading DR from fundus images with high accuracy and speed. CNNs extract hierarchical features such as microaneurysms, hemorrhages, and exudates and have achieved sensitivities and specificities exceeding 90 percent on benchmark datasets8,9. Landmark studies by Gulshan et al., and Ting et al. demonstrated that DL algorithms can match or surpass expert graders in identifying referable DR, paving the way for regulatory approvals of autonomous screening systems8,9. Subsequent work has explored transfer learning, ensemble modelling, and hybrid CNNrecurrent neural network architectures to improve generalizability across diverse imaging conditions and patient populations10,11.
Despite these promising results, several challenges hinder the clinical translation of DLbased DR screening. First, robust performance requires large, well-annotated datasets that capture variability in imaging devices, ethnicities, and disease presentations12. Annotation inconsistency among graders further complicates model training and evaluation. Second, image preprocessing steps such as contrast enhancement via CLAHE, noise reduction, and color normalization significantly affect the visibility of subtle lesions and, consequently, the reliability of feature extraction13. Third, model interpretability remains an active area of research; clinicians require transparent decisionsupport tools that highlight salient image regions driving algorithmic predictions14. Finally, regulatory frameworks and cost-effectiveness analyses are needed to guide integration of AI tools into existing screening pathways, particularly in resource-limited settings15. The present study addresses these challenges by proposing a comprehensive DL framework for early DR detection that integrates optimized preprocessing of fundus images, stateoftheart CNN architectures, and transferlearning strategies. We employ CLAHE and automated artifact removal to enhance lesion contrast, followed by fine-tuning of pretrained CNN backbones to leverage large-scale natural image features. Accordingly, this work proposes an explainable deep learning framework for early DR detection that integrates optimized fundus image preprocessing with efficient ensemble CNN architectures (Figure 1). The key contributions of this study include a systematic evaluation of preprocessing strategies, the design of a computationally efficient hybrid ensemble, and the incorporation of visual explainability to support clinical interpretation. By addressing accuracy, transparency, and deployability together, this study seeks to advance the practical applicability of AI-assisted DR screening. DR progresses through five clinically defined stages: No DR, Mild, Moderate, Severe non-proliferative DR, and Proliferative DR. Early stages are characterized by microaneurysms and mild hemorrhages, while advanced stages involve extensive vascular damage, neovascularization, and risk of vision loss. Symptoms often remain asymptomatic until late stages, making automated screening critical for early intervention.
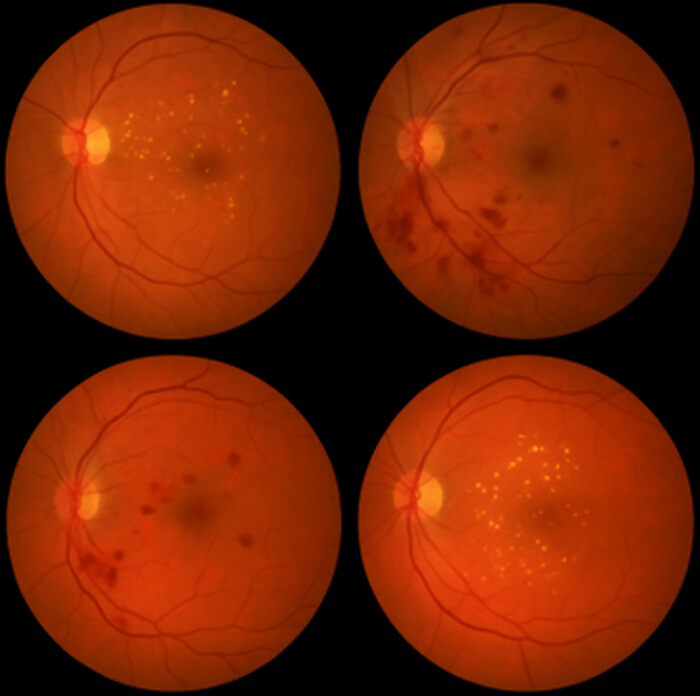
Figure 1: Graphical representation of the work presented in the manuscript Please click here to view a larger version of this figure.
To address these challenges, this study presents a structured deep learning protocol for DR detection that integrates standardized fundus image preprocessing, optimized convolutional neural network training, and interpretable model outputs within a unified workflow. The protocol is designed to improve reproducibility and methodological transparency by explicitly detailing preprocessing strategies, model architecture, and training configurations. By emphasizing a computationally efficient lightweight ensemble and incorporating Grad-CAM-based visual explanations, the proposed method defines a practical and interpretable framework intended for consistent evaluation across heterogeneous, multicenter retinal imaging datasets.
Access restricted. Please log in or start a trial to view this content.
Protocol
This study involved a retrospective analysis. In accordance with institutional and national regulations, formal ethics committee approval and informed consent were waived, as no identifiable patient information was accessed or used.
1. Data sources and acquisition
- Re-label all images according to the International Clinical Diabetic Retinopathy (ICDR) Severity Scale (Grades 0-4)10, to ensure consistency across datasets obtained from EyePACS, APTOS 2019, and the tertiary-care cohort.
- Map the original labels for datasets with existing annotations to the ICDR scale to maintain uniformity.
- Independently grade all fundus images by two board-certified ophthalmologists with experience in DR screening.
- Fully mask both graders to the dataset source, patient identifiers, clinical history, and model predictions to minimize assessment bias. Present images in a randomized order using anonymized file identifiers.
- Perform grading strictly according to the ICDR Severity Scale (Grades 0-4).
- Quantify inter-grader agreement prior to consensus labeling using Cohen's weighted kappa (κw) with quadratic weights to account for the ordinal nature of DR severity grades.
- Interpret agreement strength according to standard thresholds (κ < 0.20, poor; 0.21-0.40, fair; 0.41-0.60, moderate; 0.61-0.80, substantial; > 0.80, near-perfect). Resolve discrepant grades through joint consensus review. Use the consensus grade as the final reference standard for model training and evaluation.
- Before model training, standardize all images to a uniform resolution of 512 × 512 pixels and a consistent color space, and apply identical preprocessing procedures to minimize inter-dataset variability arising from differences in camera devices, acquisition protocols, and illumination conditions.
NOTE: Specifically, preprocessing consisted of: (i) image resizing and RGB standardization, (ii) green-channel CLAHE for contrast enhancement, (iii) background artifact removal via circular masking and adaptive thresholding, (iv) channel-wise intensity normalization, and (v) noise reduction and edge enhancement using Gaussian filtering and unsharp masking. - Acquire fundus images using multiple commercially available color fundus cameras (Topcon, Canon, and Zeiss) under routine clinical screening conditions (Figure 2).
- Allow image acquisition parameters to vary by device, but standardize them within typical screening ranges, including a field of view of 30°-45°, native image resolutions ranging from approximately 2,048 × 1,536 to 3,872 × 2,592 pixels, and a 24-bit color depth (8 bits per RGB channel).
- Use both mydriatic and non-mydriatic imaging protocols to reflect real-world screening practice. Capture all images as single-field, macula-centered fundus photographs under variable illumination conditions, and subsequently resize and preprocess the images using an identical pipeline prior to model training (Figure 2).
- Anonymize all images before use in compliance with HIPAA guidelines12,13,14.
NOTE: Use only one image per eye to avoid intra-subject bias. Exclude images that meetone or more of the following predefined quality criteria: (i) poor focus or blur that obscures retinal vessels and microaneurysms, as assessed by edge sharpness and vessel visibility; (ii) excessive motion blur or defocus affecting more than 25% of the retinal field; (iii) field loss defined as incomplete visualization of the optic disc or macular region; or (iv) severe illumination artifacts such as saturation or shadowing that interfered with lesion visibility. - Perform quality assessment independently by two reviewers and resolve any disagreements through consensus.
- EyePACS Dataset: Use the EyePACS dataset obtained from Kaggle. Include all available color fundus images and retain the provided DR grades as supplied with the dataset metadata.
- APTOS 2019 Dataset: Use the APTOS 2019 dataset sourced from Kaggle, consisting of approximately 3,600 single-field color fundus images acquired under standardized screening conditions.
- Indian Clinical Dataset: Use a hospital-derived Indian clinical dataset consisting of color fundus images. Record the total image count and use DR grades assigned by qualified ophthalmologists as reference labels.
Figure 2: Representative color fundus photographs depicting varying stages of diabetic retinopathy. Please click here to view a larger version of this figure.
2. Preprocessing (CLAHE, normalization, artifact removal)
- Employ a multi-stage preprocessing pipeline to enhance lesion visibility and reduce variability due to imaging conditions.
- Resize each color fundus image to 512 × 512 pixels to maintain uniform input dimensions for deep learning models.
- Perform contrast enhancement using CLAHE applied exclusively to the green channel of each fundus image, as this channel provides optimal vessel and microaneurysm contrast.
- Implement CLAHE using the OpenCV library with a clip limit of 2.0 to prevent noise over-amplification and a tile grid size of 8 × 8 to enable localized contrast enhancement across the retinal field.
- Recombine the processed green channel with the red and blue channels to reconstruct the enhanced RGB image. Fix all CLAHE parameters and apply them identically to all images across training, validation, and test sets to ensure reproducibility.
- Subsequently, normalize images to zero mean and unit variance using channel-wise normalization.
- Remove background artifacts such as black borders and illumination halos using circular masking and adaptive thresholding.
- Apply Gaussian filtering and unsharp masking for noise reduction and edge preservation, respectively. Apply the following contrast enhancement, Gaussian filtering for noise suppression: use a 5 × 5 kernel with a standard deviation (σ) of 1.0, implement symmetrically in both horizontal and vertical directions.
NOTE: This step reduces the high-frequency noise while preserving fine vascular structures. - Perform unsharp masking through subtraction of a blurred version of the image from the original image, to enhance lesion boundaries.
- Specifically, subtract a Gaussian-blurred image (kernel size 5 × 5, σ = 1.0) from the original image with a sharpening weight of 1.5, and add the resulting detail image back to the original to generate the final sharpened output.
- Fix all parameters and apply them uniformly across all datasets.
- Include the additional preprocessing mentioned below to simulate real-world variability and augment training data:
- Apply random horizontal flipping to each training image with a probability of 0.5 to account for left-right anatomical symmetry of the retina.
- Apply random vertical flipping with a probability of 0.5, ensuring that orientation variability commonly encountered during fundus image acquisition is represented.
- Apply random rotation within a range of -15° to +15°, sampled uniformly, with a probability of 0.7 to simulate minor camera tilt and patient head movement.
- Apply random zooming within a range of ± 10% of the original image size, with a probability of 0.5, followed by center cropping or padding to restore the input resolution of 512 × 512 pixels.
- Apply random brightness adjustment by scaling pixel intensities within a factor range of 0.9-1.1, with a probability of 0.4, to model illumination variability across imaging devices.
- Apply random contrast adjustment by scaling image contrast within a factor range of 0.9-1.1, with a probability of 0.4, to improve robustness to exposure differences.
- Ensure that all augmentations are applied only to the training set and are performed on-the-fly during model training, while validation and test images remain un-augmented.
- Maintain fixed augmentation parameters throughout training to ensure reproducibility and consistent exposure of the model to controlled variability.
- Implement the preprocessing steps using Python's OpenCV and image libraries, and ensure consistent transformations across training and validation sets.
3. Model architecture (CNN variants, optimized layers)
- Explore multiple CNN architectures for DR classification and investigate the three model variants mentioned below.
- Baseline CNN - A custom 6-layer CNN with batch normalization, ReLU activation, max-pooling, and dropout (p = 0.5).
- Transfer Learning Models - Pretrained CNN backbones including ResNet50, EfficientNetB0, and DenseNet121 initialized with ImageNet weights and fine-tuned on DR images.
- Optimized Hybrid Model - An ensemble model combining feature extractors from EfficientNetB0 and DenseNet121, followed by a multi-layer perceptron (MLP) with softmax output.
- Following fine-tuning, construct the classification head for each pretrained model using a global average pooling layer, a dense layer with ReLU activation (512 units), a dropout layer(p = 0.5), and a softmax output layer.
- Place a global average pooling (GAP) layer before the classification head in each model.
- To reduce overfitting, L2 weight regularization was applied to all fully connected (dense) layers in the classification head using a regularization coefficient (λ) of 1 × 10⁻4. This value was selected to provide effective penalization of large weights while preserving model convergence and classification performance during fine-tuning.
- Employ a softmax activation function in the classification layer to enable 5-class DR prediction.
- Base model design choices on prior work demonstrating the superior performance of hybrid and transfer learning-based approaches in retinal image analysis3,4.
- Use efficientNetB0 and DenseNet121 as parallel feature extractorsin the optimized hybrid ensemble model.
- Simultaneously feed the input fundus images into both pretrained backbones and extract the final convolutional feature maps after the global average pooling (GAP) layer of each network.
- Concatenate the resulting feature vectors to form a unified representation and feed them into an MLP consisting of two fully connected layers (with ReLU activation and dropout) followed by a softmax output layer for five-class DR classification.
- Adopt this late-fusion strategy to integrate EfficientNetB0's fine-grained feature efficiency with DenseNet121's dense feature propagation, resulting in balanced performance across early and advanced DR stages.
- Leverage the MLP to enable non-linear integration of complementary feature representations while reducing overfitting compared to end-to-end fusion.
4. Model training and optimization (transfer learning, hyperparameters)
- Conduct all the experiments on a workstation running Ubuntu Linux (version 20.04 LTS) with Python 3.8.10.
- Implement deep learning models using TensorFlow 2.10.0 with the Keras backend and execute on an NVIDIA Tesla V100 GPU (32 GB VRAM).
- Enable GPU acceleration using CUDA Toolkit version 11.2 and cuDNN version 8.1, which are compatible with the specified TensorFlow release.
- Implement all preprocessing and data augmentation steps using OpenCV 4.7.0, NumPy 1.23, and imgaug 0.4.0.
- Split the dataset into training (70%), validation (15%), and test (15%) sets, and ensure class balance within each partition.
- Train all the models on an NVIDIA Tesla V100 GPU with 32 GB VRAM.
- Leverage transfer learning by freezing the initial layers of pretrained networks and fine-tuning the top layers on fundus images.
- Randomly initialize the final dense layers and train from scratch.
- Optimize the following hyperparameters:
Optimizer: Adam with β1=0.9, β2=0.999
Learning rate: 1 × 10⁻⁴ with ReduceLROnPlateau scheduler
Batch size: 32
Epochs: 50-100 with early stopping (patience = 10)
Loss function: Categorical Cross-Entropy - Save model checkpoints based on the minimum validation loss.
- Address class imbalance by applying categorical class weights inversely proportional to class frequency during training.
- Apply data augmentation on-the-fly using the Keras ImageDataGenerator. Employ a 5-fold cross-validation strategy to ensure model robustness and minimize selection bias. Average performance metrics across all folds, and report the corresponding standard deviations.
- Select hyperparameter values based on established best practices in transfer learning for medical image classification and validate them through preliminary pilot experiments on the validation set.
- Use the Adam optimizer for its stable convergence and adaptive learning rate behavior, and set an initial learning rate of 1e−4 to balance training stability and convergence speed during fine-tuning.
- Empirically determine the batch size and early stopping criteria to minimize overfitting while maintaining computational efficiency.
5. Evaluation metrics and validation (AUC, accuracy, sensitivity/specificity)
- Evaluate model performance using standard classification metrics. Conduct a primary evaluation on the hold-out test set (n ≈ 8,000 images), and report results for both 5-class classification and binary classification (referable DR vs. non-referable DR).
- Compute the following metrics:
Accuracy: Percentage of correct predictions across all classes
Area Under the Receiver Operating Characteristic Curve (AUC): Calculated for each class and averaged (macro AUC)
Sensitivity (Recall): True positive rate = TP / (TP + FN)
Specificity: True negative rate = TN / (TN + FP)
F1-Score: Harmonic mean of precision and recall
Confusion Matrix: 5 × 5 matrix for classification error analysis - Plot Receiver Operating Characteristic (ROC) curves and precision-recall curves to visualize model discrimination.
- Generate Grad-CAM (Gradient-weighted Class Activation Mapping) visualizations for a subset of correctly and incorrectly classified images to highlight the retinal regions driving model predictions.
NOTE: The optimized hybrid model achieved the best performance with a macro AUC of 0.961, a sensitivity of 92.1%, a specificity of 89.4%, and an overall accuracy of 91.2% for referable DR detection. - Benchmark the performance against existing published models on the same datasets, and assess statistical significance using paired t-tests and McNemar's test.
- Evaluate the statistical significance of performance differences between the hybrid ensemble model and individual CNN architectures using paired t-tests for continuous metrics (AUC, accuracy, F1-score) across cross-validation folds, and McNemar's test for paired classification outcomes on the test set.
NOTE: The hybrid model demonstrated statistically significant improvements over all single-backbone models, with p-values < 0.05 for accuracy and AUC, confirming that the observed performance gains were not due to random variation. Precision is a critical evaluation metric in DR screening, particularly to minimize false positive predictions that may lead to unnecessary referrals, patient anxiety, and increased healthcare burden. Precision is defined as the proportion of correctly predicted positive cases among all cases predicted as positive and is expressed as:
Precision=TPTP+FP\text{Precision} = \frac{TP}{TP + FP}Precision=TP+FPTP
where TP represents true positives, and FP represents false positives. - In the context of DR detection, interpreting high precision as indicating that images classified as having DR truly contain pathological signs, thereby improving the reliability of automated screening systems. Emphasize that this metric is especially relevant for large-scale population screening, where excessive false positives can overwhelm referral systems. In this study, evaluate the precision for each DR grade as well as for binary referable DR detection to assess the model's ability to accurately distinguish pathological cases from healthy controls.
Access restricted. Please log in or start a trial to view this content.
Results
Dataset summary and preprocessing effects
The curated dataset consisted of 53,412 color fundus images distributed across the five DR severity classes: No DR (0) - 39.2%, Mild (1) - 18.4%, Moderate (2) - 22.5%, Severe (3) - 12.1%, and Proliferative DR (4) - 7.8%. Data originated from EyePACS, APTOS 2019, and a tertiary Chinese ophthalmology center, ensuring diversity in ethnicity, imaging conditions, and camera specifications.
Preprocessing significa...
Access restricted. Please log in or start a trial to view this content.
Discussion
In this study, we developed and rigorously evaluated a hybrid ensemble model combining EfficientNetB0 and DenseNet121, fine-tuned using transfer learning and enhanced with classical preprocessing steps, CLAHE, artifact removal, and intensity normalization, for five-class DR grading. The ensemble achieved outstanding performance: accuracy 91.2%, macroAUC 0.961, and F₁score 0.913 for referable DR detection, and sensitivity 92.1% as reported in Section 6. These metrics substantially outperformed both a baseline CNN (a...
Access restricted. Please log in or start a trial to view this content.
Disclosures
The authors affirm that they do not have any financial conflicts of interest.
Acknowledgements
This work was supported by the 2024 Wenzhou Fundamental Research Project. (Grant No.: Y20240360)
Access restricted. Please log in or start a trial to view this content.
Materials
| Name | Company | Catalog Number | Comments |
|---|---|---|---|
| Fundus Camera (Topcon, Canon, Zeiss) | Topcon / Canon / Zeiss | Used to capture high-resolution color fundus photographs under varying illumination conditions | |
| NVIDIA Tesla V100 GPU | NVIDIA Corporation | Tesla V100 | 32 GB VRAM; used for training deep learning models |
| Python (OpenCV, imgaug libraries) | Open-source community | Image preprocessing including CLAHE, artifact removal, normalization, augmentation | |
| TensorFlow 2.10 + Keras | Google Brain | Deep learning framework used for CNN model building and training | |
| EfficientNetB0 & DenseNet121 pretrained backbones | Open-source (TensorFlow/Keras Applications) | Transfer learning backbones pretrained on ImageNet used for DR classification |
References
- Cheung, N., Mitchell, P., Wong, T. Y. Diabetic retinopathy. Lancet. 376 (9735), 124-136 (2010).
- Yau, J. W. Y., et al. Global prevalence and major risk factors of diabetic retinopathy. Diabetes Care. 35 (3), 556-564 (2012).
- Ting, D. S. W., et al. Development and validation of a deep learning system for diabetic retinopathy and related eye diseases using retinal images from multiethnic populations with diabetes. JAMA. 318 (22), 2211-2223 (2017).
- Rajalakshmi, R., Subashini, R., Anjana, R. M., Mohan, V. Automated diabetic retinopathy detection in smartphone-based fundus photography using artificial intelligence. Eye. 32 (6), 1138-1144 (2018).
- Wilson, C., Horton, M., Cavallerano, J., Aiello, L. P. Telemedicine and diabetic retinopathy: screening and diagnosis. Curr Diabetes Rep. 20 (1), 2(2020).
- Early Treatment Diabetic Retinopathy Study Research Group. Photocoagulation for diabetic macular edema. Arch Ophthalmol. 103 (12), 1796-1806 (1985).
- Silva, P. S., Cavallerano, J. D., Kwak, H., Aiello, L. M., Aiello, L. P. Potential utility of ultrawidefield imaging for telemedicine diabetic retinopathy screening. Arch Ophthalmol. 129 (3), 279-284 (2011).
- Gulshan, V., et al. Development and validation of a deep learning algorithm for detection of diabetic retinopathy in retinal fundus photographs. JAMA. 316 (22), 2402-2410 (2016).
- Abràmoff, M. D., Lavin, P. T., Birch, M., Shah, N., Folk, J. C. Pivotal trial of an autonomous AI-based diagnostic system for detection of diabetic retinopathy in primary care offices. NPJ Digit Med. 1, 39(2018).
- Zhang, Z., et al. Deep learning for detecting retinal diseases: a survey. Front Neurosci. 15, 703(2021).
- Li, Z., et al. An attention-based algorithm for automated diabetic retinopathy grading on color fundus photographs. IEEE Trans Med Imaging. 39 (7), 2501-2512 (2020).
- Krause, J., et al. Grader variability and the importance of reference standards for evaluating machine learning models for diabetic retinopathy. Ophthalmology. 125 (8), 1264-1272 (2018).
- Hernández, C., et al. Preprocessing of fundus images for automated diabetic retinopathy detection. Med Biol Eng Comput. 58 (2), 243-253 (2020).
- Holzinger, A., Samek, W., Müller, H. Evaluating explainable AI: which algorithmic explanations help users predict model behavior? In: Explainable AI: Challenges and Pitfalls. Lecture Notes in Computer Science. 11700, Springer. 3-11 (2019).
- Abramoff, M. D., et al. Improved automated detection of diabetic retinopathy on a publicly available dataset through integration of deep learning. Invest Ophthalmol Vis Sci. 57 (13), 5200-5206 (2016).
- Chetoui, M., Akhloufi, M. A. Explainable diabetic retinopathy using EfficientNet. Proc IEEE Eng Med Biol Soc. (EMBC). , 1966-1969 (2020).
- Chilukoti, S. V., Shan, L., Maida, A. S., Hei, X. A reliable diabetic retinopathy grading via transfer learning and ensemble learning with quadratic weighted kappa metric. BMC Med Inform Decis Mak. 24, 37(2024).
- Rasta, S. H., Eisazadeh Partovi, M., Seyedarabi, H., Javadzadeh, A. A comparative study on preprocessing techniques in diabetic retinopathy retinal images: illumination correction and contrast enhancement. J Med Signals Sens. 5 (1), 40-48 (2015).
- Grad-CAM: visual explanations from deep networks via gradient-based localization. Selvaraju, R. R., et al. Proc. IEEE Int Conf Comput Vis (ICCV), , 618-626 (2017).
- Grzybowski, A., et al. Artificial intelligence for diabetic retinopathy screening: a review. Eye (Lond). 34 (3), 451-460 (2020).
- Lee, K. J. Autonomous diabetic retinopathy screening system gains FDA approval. American Academy of Ophthalmology. , (2020).
- FDA clears first fully autonomous AI for portable diabetic retinopathy screening. PRNewswire. , AEYE Health. (2024).
- Akune, Y., et al. Cost-effectiveness of AI-based diabetic retinopathy screening in nationwide health checkups and diabetes management in Japan: a modeling study. Diabetes Res Clin Pract. 221, 112015(2025).
Access restricted. Please log in or start a trial to view this content.