This protocol evaluates the influence of rich (TSB) and minimal (FAB) nutrient media compositions on Pseudomonas aeruginosa PAO1 and PA14 biofilm development in a steady state flow environment in a microchannel.
A subscription to JoVE is required to view this content. Sign in or start your free trial.
Method Article
Real-Time Visualization of Nutrient Media Impact on Pseudomonas aeruginosa Biofilm Development Using a Microfluidic System
In This Article
Summary
Abstract
The pathogenic bacterium Pseudomonas aeruginosa is a major cause of numerous nosocomial infections, and its growing antimicrobial resistance has led to it posing a significant public health threat. This article presents a comprehensive protocol detailing the use of a microfluidic system for the real-time visualization and quantification of biofilm development in two key P. aeruginosa strains, PAO1 and PA14. The method employs optically transparent, multichannel microchannel plates to subject bacterial cultures to a continuous, steady flow of media, including tryptic soy broth (TSB) or modified minimal fastidious anaerobic broth (FAB) with varying carbon source concentrations, thereby mimicking conditions found in the clinical environments. Over a 24-h period, automated real-time imaging captures the growth and maturation of biofilms in the form of biofilm surface area coverage, thickness, and surface roughness in a highly reproducible manner. The experimental objective is to use the results to demonstrate that biofilm formation for both strains is significantly impacted by changes in nutrient media composition. The goal of this visualized protocol is to provide a method for researchers to study biofilm dynamics under steady laminar flow conditions, and the insights gained could be leveraged to develop alternative, non-antimicrobial strategies for eradicating early-stage P. aeruginosa biofilms in nosocomial settings.
Introduction
The goal of this method is to observe the impact of two different culture media, i.e., tryptic soy broth (TSB) and modified minimal fastidious anaerobic broth (FAB), on the biofilm growth of two Pseudomonas aeruginosa strains, namely PAO1 and PA14. Though P. aeruginosa PAO1 and PA14 are both common laboratory reference strains, the PA14 strain infects a greater proportion of hosts from plants to invertebrates1. The TSB nutrient broth is a general-purpose culture medium with 2.5 g/L of glucose as a carbon source and is able to cultivate a wide range of bacteria due to its composition of casein and soy peptones for organic nitrogen and a natural sugar supply, as well as sodium chloride to maintain osmotic equilibrium2. The minimal FAB medium, in contrast, is formulated with minimal concentrations (50-fold reduction) of a single carbon source, at levels of 0.05 g/L to explore growth requirements of anaerobic bacteria. Both the PAO1 and PA14 strains were exposed to unidirectional, laminar flow, resulting in a low wall shear stress of 0.01 Pa. This shear stress value is often present in P. aeruginosa-colonized locations, including the bronchi of cystic fibrosis patients and the gastrointestinal tract. The biofilm growth was measured over a 24-h period by assessing real-time biofilm percentage surface area coverage, thickness, and arithmetic mean of the surface roughness.
P. aeruginosa biofilms are responsible for a significant percentage of nosocomial infections and are a leading cause of death for people with cystic fibrosis3,4,5. Previous investigations into the impact of carbon source levels on bacterial biofilm development have neglected the critical role of hydrodynamic flow during biofilm development, used shear stress values that are not representative of P. aeruginosa infection sites, or have undertaken only biofilm kinetic and morphological analysis post-experiment6,7. These limitations are addressed in this method by utilizing real-time imaging of biofilm development, under steady state flow conditions within a microfluidic channel that closely replicates physiological environments found in cystic fibrosis patients.
This method offers significant advantages over alternative techniques that are used to study biofilm development. The application of real-time imaging during the 24-h biofilm growth period ensures that the developing biofilm is undisturbed, as no drying or chemical alterations are required, avoiding changes to its composition and yielding more representative results than methods that require sample manipulation8. Additionally, by applying steady hydrodynamic flow conditions and varying the carbon source concentrations over a large magnitude, this procedure more accurately replicates the physiological environments found at sites of P. aeruginosa nosocomial infections. This makes it a more representative method compared to those utilizing static assays, such as 96-well microtiter plates or coupons, which fail to capture the critical impact of fluid flow on biofilm development9,10,11.
The microfluidic device employed was specifically chosen as its dimensions are similar to parts of the lung, such as bronchioles and bronchi12. Furthermore, P. aeruginosa infections are a major concern for patients with severe burn wounds, where glucose levels can fluctuate significantly from the patient's normal range13,14.
While this protocol specifically uses two strains of P. aeruginosa, the method is also applicable to investigations into the early-stage development of other bacteria that cause infections or colonize areas under similar conditions. Additionally, other nutrient media compositions as well as flow conditions (e.g., pulsatile and oscillating flows, or higher wall shear values) could also be investigated using the same methodology.
Access restricted. Please log in or start a trial to view this content.
Protocol
1. Glassware cleaning
- Submerge two 200 mL glass bottles to be used for media and agar, and three 1 L glass bottles in a 10% hydrochloric acid (HCl) bath for approximately 5 min at room temperature.
CAUTION: Hydrochloric acid is corrosive. Perform all acid handling in a chemical fume hood while wearing appropriate personal protective equipment (lab coat, gloves, and eye protection). - Subsequently, remove glassware from the HCl bath and rinse twice with tap water and once with distilled water (dH2O).
2. Tryptic soy broth media preparation
- Prepare the TSB solution, weigh 6 g/200 mL of TSB powder using a clean weighing boat, and a precision balance.
NOTE: The composition of the TSB powder used is as follows: Dextrose (2.5 g∙L-1), Dipotassium phosphate (2.5 g∙L-1), Pancreatic digest of casein (17 g∙L-1), Papaic digest of soy meal (3.0 g∙L-1), and Sodium chloride (5.0 g∙L-1). - Measure 200 mL of dH2O using a measuring cylinder and pour it into one of the previously cleaned glass bottles.
- Add the 6 g of TSB into the clean glass bottle containing the 200 mL of dH2O, seal the bottle tightly and mix for approximately 2 min to dissolve the powder, creating the TSB solution media.
- Autoclave TSB media solution for 15–20 min at a temperature of 121 °C and pressure of 1.5 atm, to sterilize the solution.
NOTE: (PAUSE POINT) TSB solution can be stored at room temperature (approximately 20 °C) between uses and used for future experiments.
3. Fastidious anaerobic broth media preparation
- Prepare FAB media trace metal solution.
- Use separate, clean weighing boats and a spatula, and a precision balance when weighing masses between 0.5–210 g, and an analytical balance when weighing masses between 0.001–0.5 g. Measure out the following components and their quantities: CaSO4.2H2O (200 mg∙L-1), FeSO4.7H2O (200 mg∙L-1), MnSO4.H2O (20 mg∙L-1), CuSO4.5H2O (20 mg∙L-1), ZnSO4.7H2O (20 mg∙L-1), CoSO4.7H2O (10 mg∙L-1), NaMoO4.H2O (10 mg∙L-1), and H3BO3 (5 mg∙L-1)7,9.
- Add each of the components into a 1 L cleaned glass bottle containing 1 L of dH2O and mix thoroughly with the dH2O.
- Add 1 mL of the mixture to each of the two remaining 1 L sterilized glass bottle with 1 L of dH2O and mix thoroughly.
- Prepare 20 mM sodium citrate-supplemented FAB for overnight cultures
- Measure out the following components and their quantities using separate, clean weighing boats and a spatula, a precision balance when weighing out masses between 0.5-200 g and an analytical balance when weighing out masses between 0.001-0.5 g,: Sodium citrate (20 mM), (NH4)2SO4 (2 g∙L-1), Na2HPO4.2H2O (6 g∙L-1), KH2PO4 (3 g∙L-1), NaCl (3 g∙L-1), MgCl2 (93 mg∙L-1) and CaCl2 (11 mg∙L-1)7,9.
- Add all components into one of the remaining 1 L sterilized glass bottles containing 1 L of dH2O with 1 mL of trace metal solution.
- Mix thoroughly.
- Prepare 0.3 mM Glucose-supplemented FAB for biofilm growth.
- Replace the 20 mM of sodium citrate with 0.3 mM of glucose. Use the same components and masses listed in step 3.2.1.
- In the remaining cleaned 1 L glass bottle, add the 0.3 mM glucose FAB components to 1 mL of dH2O with 1 mL of trace metal solution and mix well.
- Autoclave for 15-20 min at a steam temperature of 121 °C and pressure of 1.5 atm, to sterilize the media.
NOTE: (PAUSE POINT) FAB medium solution can be stored at room temperature (approximately 20 °C) between uses and used for future experiments.
4. TSB agar preparation
- Measure out 8 g/200 mL of TS agar using the precision balance and washed weighing boats and spatula.
- Measure out 1 g/200 mL of across bacteriological grade agar, on a separate weighing boat, using the same precision balance.
- Using a measuring cylinder, measure 200 mL of dH2O and pour it into the final, previously cleaned glass bottle.
- Pour both agar components into the 200 mL of dH2O and mix well.
- Autoclave for 15–20 min at a temperature of 121 °C and pressure of 1.5 atm, to sterilize the medium.
NOTE: (PAUSE POINT) TSB agar can be stored at room temperature (approximately 20 °C) between uses and requires re-heating before use in future experiments.
5. Petri dish Pseudomonas Aeruginosa culturing
- Melt agar in the microwave for approximately 5 min, or until the solution is liquid.
- Open and disinfect a class II safety cabinet surface with 70% ethanol solution, ready for use. Undertake all the steps below in this section within this class II safety cabinet.
- Measure 25 mL of agar solution into a 50 mL vial and pour it into a 90 mm Petri dish, and wait for the agar to set.
- Retrieve P. aeruginosa PAO1 and PA14 frozen stocks from -80 °C freezer. Place stocks in the incubator at 37 °C for approximately 5 min, or until contents are completely thawed.
- Dip the inoculation loop inside either of the thawed P. aeruginosa stocks and spread the sample across the agar.
- Repeat step 5.5 for the other P. aeruginosa strain, creating two separate P. aeruginosa Petri dish cultures, one with the PAO1 strain and the other with the PA14 strain.
- Label each Petri dish with the strain of P. aeruginosa within it, date of revival, and initials, then place in incubator for 16–18 h at 37 °C.
NOTE: (PAUSE POINT) P. aeruginosa PAO1 and PA14 Petri dishes can be stored at 4 °C for a storage period of up to 4 weeks and used for future experiments.
6. Pseudomonas aeruginosa PAO1 and PA14 glycerol stocks
- Open and disinfect a class II safety cabinet for use, select eight 50 mL vials to contain the overnight cultures.
- Using the previously fabricated TSB and sodium citrate FAB media (section 3), pour 5 mL of TSB medium into four of the eight vials and the sodium citrate minimal FAB medium into the remaining four.
- Using the previously incubated Petri dishes and an inoculation loop, touch five separate colonies in the P. aeruginosa PAO1 Petri dish and transfer to one of the TSB vials. Repeat this for the sodium citrate FAB medium and for the P. aeruginosa PA14 strain Petri dish.
- Submerge a clean inoculation loop directly into the remaining four TSB and sodium citrate FAB media vials, forming controls.
- Incubate all eight vials in a shaking incubator for 16–18 h at 200 RPM and 37 °C and clearly label.
- Retrieve the culture vials, ensure that those inoculated with P. aeruginosa are turbid and those used as controls remain clear.
- Centrifuge the four P. aeruginosa-inoculated vials at 4000 × g for 5 min at 20 °C to separate the P. aeruginosa from the culture media. Ensure that the centrifuge is balanced.
- Disregard the supernatant and resuspend the P. aeruginosa pellet after centrifugation with 1 mL of solution containing 15% glycerol, with 150 µL glycerol and 850 µL fresh TSB or sodium citrate FAB media.
- Transfer resuspended cultures to 1 mL vials and place in the -80 °C freezer.
NOTE: (PAUSE POINT) Glycerol stocks can be stored at -80 °C for long-term storage and used for future experiments.
7. Measuring optical density of overnight cultures
- Repeat steps 6.1–6.5, for two TSB medium vials only, with one as a control and the other with the PAO1 P. aeruginosa strain.
- Pipette 1 mL of TSB medium into a 1 mL spectrophotometer vial, within a class II safety cabinet, and transfer 0.9 mL of TSB medium into the second vial, supplementing with 0.1 mL of the overnight culture.
- Set the spectrophotometer to a light wavelength of 600 nm and, using the 1 mL TSB spectrophotometer vial to calibrate the machine, measure the optical density of the 0.1 mL suspension vial15.
- If the absorbance measured does not read 0.1, recalculate the suspension volume needed.
NOTE: The volume of suspension needed to achieve an absorbance reading of 0.1 (V1) can be calculated using the initial 0.1 mL suspension vial absorbance reading, C1, the desired absorbance that the suspension is being adjusted to, C2, and the volume of concentrated overnight suspension wanted, V2:
C1V1 = C2V2
In the example above, if C1 = 3.59, C2 = 0.1 and V2 = 10 mL, the volume of overnight suspension wanted would be 0.279 mL in a 10 mL solution.
- If the absorbance measured does not read 0.1, recalculate the suspension volume needed.
- Measure 10 mL of TSB medium into a 50 mL vial and remove the same volume of TSB medium as the volume of suspension needed to create a 10 mL 0.1 OD 600 nm suspension. Using the overnight culture, add the suspension volume calculated and vortex for approximately 5 s to mix.
- Transfer 1 mL of the 10 mL adjusted suspension into a spectrophotometer vial and re-measure the absorbance to ensure it is 0.1.
- Repeat the above 7.1–7.5 for PA14 and TSB medium and for both P. aeruginosa strains and the sodium citrate FAB medium.
8. Viable cell count
- Transfer dH2O into a square Petri dish within a class II safety cabinet and use a multi-channel pipette to transfer 180 µL into columns 2–9 of a clear 96-well polystyrene plate16.
- Transfer the 10 mL 0.1 OD 600 suspension into a separate square Petri dish and, using the multichannel pipette, transfer 200 µL of the suspension into column 1 of the 96-well, polystyrene plate.
- Transfer over 20 µL of suspension using the multichannel pipette from column 1 of the 96-well, polystyrene plate into channel 2, followed by transferring 20 µL of diluted suspension in channel 2 to channel 3, repeating to channel nine, creating suspension dilutions from 10-1 to 10-8.
- Transfer 50 mL of TS agar (section 4 and step 5.1), in a class II safety cabinet using a vial, into a square Petri dish and leave until agar becomes turbid.
- Transfer 10 µL from each of the wells along columns 2–9 onto the TS agar Petri dish in a column formation, using a multichannel pipette, ensuring the columns do not contact each other.
- Incubate TS agar for 24 h at 37 °C, after waiting until the transferred dilutions have settled.
- Calculate colony-forming units (CFU) per milliliter (mL) by determining if the Petri dish is countable (between 30 and 300 colonies).
- Determine the dilution factor of the 10 mL suspension used; in this case, the suspension was diluted to 1/10 (0.1 OD 600).
- Calculate the individual dilution factors of each plated column. This is the amount of diluted suspension added to each column divided by the total volume of the column after the suspension is added. In the case of column 2 of the 96-well plate (column 1 of the Petri dish), 20 µL/200 µL = 1/10.
- Calculate the total series dilution factor by multiplying each of the columns' individual dilution factors together.
NOTE: In this case, since 20 µL was transferred from each column to the next, making the total volume of each column well 200 µL, each individual series dilution was 1/10. Making the total series dilution 1 × 10⁻⁸. - Determine the plating dilution factor as the dilution is transferred from the 96-well plate to the Petri dish. To determine CFU/mL, divide the volume of each column plated (10 µL) by 1 mL. In this case:
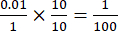 .
. - Determine the final dilution factor by multiplying the original suspension dilution factor (0.1) by the total series dilution factor (1 × 10⁻⁸) and the plating dilution factor (
 ).
). - Calculate the CFU∙mL-1 in the original sample, multiply the CFU on the plate by the inverse of the final dilution factor.
NOTE: In this case, if 200 CFU were counted, this would mean carrying out 200 × 1/1 × 10-8 resulting in the CFU/mL being 2 × 10¹⁰ CFU∙mL-1 17.
9. Microfluidic system setup and experimental run
- Inoculate 5 mL broth of culture medium with each strain of P. aeruginosa to form an overnight culture and incubate for 16–18 h at 37 °C.
- Set up the microfluidic system and associated software.
- Activate the microfluidic system components in the following order: Power supply, microfluidic system controller, CMOS camera, enclosure heaters, microscope, computer, and associated monitors.
- Activate the microfluidic software and initiate the accompanying control module interface by inputting the 48-well 0–2 Pa multichannel plate-associated barcode when prompted, found on the side of the multichannel plate.
- Set P. aeruginosa multichannel plate well inoculation procedure.
- Adjust the optical density of the overnight culture to 0.1 OD600.
- Transfer 50 µL of 0.1 OD 600 suspension into the outlet well of each of the six channels in parallel inside a class II safety cabinet.
NOTE: Six channels were run in parallel at any one time to maximize the likelihood of anomalous result identification. - Replace the 48-well multichannel plate cover and transfer it to the movable stage situated inside the system incubator and secure it.
- Set P. Aeruginosa multichannel plate channel inoculation procedure.
- Seed the microfluidic channels using the microfluidic system control module by selecting: Manual > Columns 1–4 > Fluid: TSB at 37 °C > Max Shear (Pa): 0.1 (1 dyne∙cm-2 = 0.1 Pa) and select an outlet well of the 48-well 0–2 Pa multichannel plate diagram.
- Select the abort button to stop the flow after 2–4 s and leave the plate for 30 min, to ensure the cells attach to the channel substrate before starting the continuous flow.
NOTE: A 30 min duration allows gravitational force to help adhere the planktonic P. aeruginosa bacteria to the bottom channel wall. This time will vary depending on the bacteria and the type of nutrient media. - Remove the multichannel plate from the movable incubator stage and transfer 1 mL of fresh TSB into the inlet well of each of the six channels in a class II safety cabinet.
- Transfer the multichannel plate to the movable stage inside the incubator and secure it in place.
- Set up AutoRun.
- Ensure the flow used throughout the 24 h experiments is relevant to where P. aeruginosa is found in nature, by navigating to manual > shear stress: 0.01 Pa, and record the volume flow rate (µL⋅h-1) displayed. Ensure this value, for the 48-well microchannel plate is 8.2 µL⋅h-1.
- Convert the volume flow rate to m3∙s-1, calculate the channel cross-sectional area (m2), and determine the flow velocity when at a hydrodynamic shear stress of 0.01 Pa.
NOTE: By using and rearranging the fluid volume flow rate equation, the fluid velocity through the channel can be calculated:

Where U is the fluid velocity (m∙s-1) and A is the microchannel cross-sectional area (m2) of the channels in the multichannel plate. - Calculate the flow Reynolds number using the density, ρ, and dynamic viscosity, µ, of the TSB medium, and ensure it is within a range of fluid flow that P. aeruginosa biofilms are found. For a hydrodynamic shear stress of 0.01 Pa, ensure the Reynold's number is 0.0117 and 0.0165 for TSB and FAB media, respectively. If outside of this range, check that the fluid conditions are set to TSB.

Where Dh is the hydraulic diameter of the microchannel used, obtained using:

Where, w, and h, represent the width (m) and height (m) of the microchannel used. - Calculate the fluid development length to ensure the fluid flow within the image acquisition region is fully developed.
NOTE: The development length for laminar fluid through a channel can be calculated using the Reynolds number, Re, and the channels' hydraulic diameter, Dh:
Ldev = 0.06ReDh - Set up the autorun: Edit AutoRun > Protocol Setup > time duration: 24 h, with a repeat of 1 and a shear stress of 0.01 Pa. Save the Protocol.
- Create a new sequence in the Sequence Setup tab by applying the newly created protocol with one repetition, to channels 1–6 and select fluid: TSB at 37 °C. Save this sequence.
- Set up image acquisition using the Multi Dimensional Acquisition window.
- Select Multi Dimensional Acquisition using the system software, then the live button (bottom left of Multi Dimensional Acquisition window). Navigate the microscope stage to view channels 1–6 using the live view button and camera magnifications 5× to 40× on the microscope touchscreen, showing one channel in the camera field of view at a time.
- Prepare the camera for image acquisition: Multi Dimensional Acquisition > Saving: select a directory for the images to be saved to > Timelapse: Duration: 24 h, the same duration as the hydrodynamic flow > Time Interval: Time between each acquired image, set to 10 min.
- Input the camera settings by selecting Wavelength > Illumination: brightfield 50% camera 50%: black and white > auto expose: every acquisition > acquire: every time point > auto focus: never.
- Determine the camera positions to capture the biofilm images by setting the magnification to 20×, producing a field of view with dimensions 665.6 µm × 665.6 µm and navigate to the middle of the channel viewing region, where the channel number will be engraved at the center.
- Add the stage position so it is captured by the camera, navigate to Stage label the position, and select the addition button to add it to the directory.
- Repeat this for upstream points 0.9984 mm and downstream points 3.0016 mm from the inlet of the channel viewing region, where the position represents the middle point of the camera field of view.
NOTE: These imaging positions were selected to provide representations of biofilm growth along the viewing region, whilst ensuring the flow within is fully developed. This results in three images acquired for each microchannel, in this case, resulting in 18 images taken every 10 min.
- Repeat this for upstream points 0.9984 mm and downstream points 3.0016 mm from the inlet of the channel viewing region, where the position represents the middle point of the camera field of view.
- Perform experimental run
- In the system control module window select AutoRun > Run Setup > Sequence: select the 0.01 Pa sequence created, then select start.
- Immediately after, navigate to the Multi Dimensional Acquisition window > Acquire. This begins the acquisition of the 18 images every 10 min of the 24 h experimental procedure, producing 2610 images when the experiment terminates.
NOTE: The above section was reproduced over a further six microchannels approximately 48-h following the initial experiment with identical conditions.
10. Z-stack accumulation
- At the end of each experimental run, select three channels and obtain z-stacks of three sections along them at 40× magnification, by opening the Multi Dimensional Acquisition > Main: untick all options except 'Z Series'.
- Navigate to Z-series after a section along a channel has been selected within Multi Dimensional Acquisition and alter > Interactive settings: Increment: 0.5 and untick both tick boxes.
- Use the microscope focusing knob and rotate it just until the biofilm becomes out of focus, and input the z-distance by selecting Set Top To Current. Repeat this procedure, but by rotating the focusing knob in the opposite direction and selecting Set Bottom To Current. This gives the microscope the range to capture the z-stack.
- Select a folder within the Saving window to save the z-stack and select Acquire to the bottom right of the window to start acquisition.
11. Post experiment image and data analysis
- Obtain biofilm percentage surface area coverage data.
- Load the acquired images into the system software by choosing: Analysis tools > Review Multi Dimensional Data > Select Base File > Select Directory: navigate to and select the folder with the saved images > View > Wavelength 1, and in the central square section horizontally displaying the number of images acquired, right-click the small, gray box in the top, left-hand corner.
- Load the images of each channel section, one by one, choose Stage position: select the position to view > Load Image(s). Save the image series as a TIFF file.
- Threshold the image by selecting Threshold Image > Auto Threshold for Dark Objects highlighting the biofilm, then border the image using the Rectangular Region tool.
NOTE: The slider on the left-hand side of the thresholded image can be moved up and down to alter threshold intensity to better differentiate between biofilm and background. If the image has shadows, border the section without, as the shadows may have been highlighted by default, altering measurement values. - Obtain data on the percentage surface area coverage of the biofilm in the image over the 24 h experiment by selecting MM Standard > Measure > Region Measurements in the system software window to generate a table of data on the highlighted biofilm within the rectangular border, including Threshold Area %. Select Open Log to open and save a log file and F9: Log Data to input the data into the log file.
- Open a spreadsheet and, using the 24 h Biofilm data for each channel section, create a graph showing the biofilm percentage surface area coverage over 24 h.
- Obtain biofilm thickness and arithmetic mean surface roughness.
- Saved the z-stack to Fiji (ImageJ) by dragging the saved file into the Fiji control bar and convert to and 8-bit image: Image > Type > 8-bit.
- Increase the contrast between the biofilm and the channel surface to eliminate any unwanted noise: Image > Adjust > Brightness/Contrast.
- Threshold the image, setting the biofilm pixel value 255 (white) and the background pixel value 0 (black): Image > Adjust > Threshold.
- Set the scale of the image, Analyze > Set Scale > Distance in Pixels: 2048 > Known distance: 332.8 > Pixel aspect ratio: 1.0 > Unit of length: µm.
NOTE: The known distance is 332.8 µm, as the Hamamatsu camera used has a 2048 × 2048 pixel field of view, with each pixel having a size of 6.5 µm and images were taken at 40 × magnification. - Analyze the Z-stack using a custom macro18 (Supplementary File 1) which calculates and sums the surface area of biofilm on each z-stack slice and uses the input scale values to calculate the series' thickness, enabling the volume to be found. Alternatively, find the biofilm thickness by dividing the calculated volume by the surface area.
- Obtain the arithmetic mean surface roughness values of the biofilm from each z-series by downloading ImageJ (not Fiji) plugin SurfCharJ and save it in the plugins folder.
- Upload the z-stack to ImageJ by dragging the saved stack to the control bar and converting it to a 32-bit image: Image > Type: 32-bit.
- Create a surface plot, showing the variation in gray values across the surface of the stack: Analyze > Plot Profile > More: High-Resolution Plot. Convert the high-resolution plot to 32-bit.
- Obtain the arithmetic mean surface roughness value by initiating the SurfCharJ plugin: Plugins > SurfCharJ > Roughness calculation: Mean sampling length (): 10.
NOTE: The SurfCharJ plugin uses the various gray values along the surface of the z-stack to calculate the arithmetic mean surface roughness. A table containing surface roughness parameters will be produced, the only parameter of interest is the arithmetic means surface roughness, Ra. The table values will need to be converted to micrometer from pixels.
Access restricted. Please log in or start a trial to view this content.
Results
This section outlines the representative outcomes when applying the above protocol procedure. All experiments were performed with at least three independent biological replicates, each consisting of six parallel channels, and data are presented as mean ± standard deviation. Error bars in all graphs represent standard deviation, as defined in the figure legends.
The growth of the PAO1 and PA14 strains at 37 °C, in TSB media, and under 0.01 Pa hydrodynamic wall shear stress over a 24 h ...
Access restricted. Please log in or start a trial to view this content.
Discussion
The several critical steps that collectively form this protocol enable a more comprehensive and accurate analysis of biofilm formation than alternative, more traditional methods. A key component is the use of a 48-well microchannel plate, with microscale channels of dimensions 350 µm × 70 µm × 4 mm (W × H × L). These dimensions specifically replicate the flow conditions and microenvironments found in hospital settings, such as urinary catheters or the lung bronchioles of cystic fibrosis pati...
Access restricted. Please log in or start a trial to view this content.
Disclosures
The authors have nothing to disclose.
Acknowledgements
The authors would like to thank the School of Mechanical, Aerospace and Civil Engineering (MAC) at the University of Sheffield for funding.
Access restricted. Please log in or start a trial to view this content.
Materials
| Name | Company | Catalog Number | Comments |
|---|---|---|---|
| (NH4)2SO4 | Acros Organics | 7783-20-2 | For modified FAB medium |
| 48-well 0-2 Pa microchannel plate - glass coverslip | Cell Microsystems | 910-0047-5Pack | Microchannels for media flow and biofilm growth with real-time imaging |
| -80 °C Freezer | Thermo Fisher Scientific | 1.16057E+15 | To store glycerol stocks until further use |
| Agar, Bacteriological Grade | Acros Organics | 443570010 | For Agar plates - culturing bacteria |
| Analytical Balance | VWR | VWRI611-2297 | To measure components of media used |
| Autoclave | Priorclave | 4304 | To sterilize glassware |
| BioFlux 1000HT | I&L Biosystems | https://il-biosystems.com/cell- microsystems/device/bioflux-1000ht- shear-flow-system/ | For Microchannel flow and biofilm growth experiments |
| BioFlux Control Module | I&L Biosystems | https://il-biosystems.com/cell- microsystems/device/bioflux-1000ht- shear-flow-system/ | To set up and monitor media flow and biofilm growth within the microchannels |
| BioFlux Montage Software | I&L Biosystems | https://il- biosystems.com/app/uploads/2025/01/Bi oFlux_Overview_.pdf | To set up and monitor media flow and biofilm growth within the microchannels |
| CaCl2 | Fisher Scientific | 10043-52-4 | For modified FAB medium |
| CaSO4.2H2O | ChemCruz | A1719 | For 1 L minimal metal solution |
| Clear Polystyrene 96-well Plate | Corning, Costar | CLS7007 | For viable cell count |
| CoSO4.7H2O | Sigma-Aldrich | 10026-24-1 | For 1 L minimal metal solution |
| CuSO4.5H2O | Honeywell | 209198-100G | For 1 L minimal metal solution |
| Eppendorf Tubes 3810X | Eppendorf | 30125150 | For P. aeruginosa glycerol stocks |
| FeSO4.7H2O | VWR International Ltd. | 284005E | For 1 L minimal metal solution |
| Fiji (ImageJ) | National Institutes of Health | https://imagej.net/software/fiji/downloa ds | Z-stack image processing |
| Glucose | Sigma-Aldrich | 50-99-7 | For glucose modified FAB Medium |
| Glycerol | Sigma-Aldrich | 56-81-5 | For P. aeruginosa glycerol stocks |
| H3BO3 | Fisher Scientific | 10043-35-3 | For 1 L minimal metal solution |
| Hamamatsu Orca-Flash 4.0 Camera Model C11440- 42U | Hamamatsu | C11440-42U | For Microchannel flow and biofilm growth experiment real-time imaging |
| KH2PO4 | Fisher BioReagents | 7778-77-04 | For modified FAB medium |
| Methylated-Spirit | Sigma-Aldrich | 2857 | To clean microbiology cabinet before and after use |
| MgCl2 | Sigma-Aldrich | M8266-100G | For modified FAB medium |
| Microbiology Cabinet Class II | Thermo Fisher Scientific | 42111226 | To carry-out protocol steps without contaminating bacteria, broth or agar |
| Mini Incubator | Labnet International | sn03171014 | To thaw PAO1 and PA14 after -80 °C freezer and for initial 24 h bacterial agar plate growth |
| MnSO4.H2O | Sigma-Aldrich | 10034-96-5 | For 1 L minimal metal solution |
| Na2HPO4.2H2O | Sigma-Aldrich | 10102-40-6 | For modified FAB medium |
| NaCl | Sigma-Aldrich | S5886-500G | For modified FAB medium |
| NaMoO4.H2O | Sigma-Aldrich | 10102-40-6 | For 1 L minimal metal solution |
| Precision Balance | VWR | VWRI611-2299 | To measure components of media used |
| Refrigerated Centrifuge | Heraeus | 40289841 | Separating P. aeruginosa culture from supernatant for glycerol stocks |
| Semi-Micro Cuvettes | Alpha Laboratories | X72053 | For optical density measurements |
| Shaking Incubator | INFORS HT | https://infors- ht.com/en/products/incubator- shakers/multitron-standard | For overnight cultures |
| Sodium citrate | Sigma-Aldrich | 71498-250G | For Sodium citrate modified FAB medium |
| Sterile Plastic Inoculation Loops | Microspec | 15782105 | For P. aeruginosa PAO1 and PA14 innoculation into agar plates and falcon tubes |
| Tryptic Soy Agar, vegitone | Millipore | 14432-500G-F | For Agar plates - culturing bacteria |
| Tryptic Soy Broth | Sigma-Aldrich | T8907 | Dehydrated culture media - 6 g/200 mL |
| Type 1 Water Dispenser | Thermo Fisher Scientific | sn42103311 | For distiled water |
| ZnSO4.7H2O | Fisher Scientific | 7446-20-0 | For 1 L minimal metal solution |
References
- Grace, A., Sahu, R., Owen, D. R., Dennis, V. A. Pseudomonas aeruginosa reference strains PAO1 and PA14: A genomic, phenotypic, and therapeutic review. Front Microbiol. 13, 1023523(2022).
- T8907 Tryptic Soy Broth. , Sigma-Aldrich. Available from: https://www.merckmillipore.com/deepweb/assets/sigmaaldrich/product/documents/275/615/t8907dat.pdf (2018).
- Donlan, R. M. Biofilms and device-associated infections. Emerg Infect Dis. 7 (2), 277-281 (2001).
- Pseudomonas Aeruginosa - Biofilm Formation, Infections and Treatments. , IntechOpen. (2021).
- Tuon, F. F., Dantas, L. R., Suss, P. H., Tasca Ribeiro, V. S. Pathogenesis of the Pseudomonas aeruginosa biofilm: A Review. Pathogens. 11 (3), 300(2022).
- She, P., et al. Effects of exogenous glucose on Pseudomonas aeruginosa biofilm formation and antibiotic resistance. MicrobiologyOpen. 8 (12), e933(2019).
- Klausen, M., et al. Biofilm formation by Pseudomonas aeruginosa wild type, flagella and type IV pili mutants. Mol Microbiol. 48 (6), 1511-1524 (2003).
- Preda, V. G., Săndulescu, O. Communication is the key: biofilms, quorum sensing, formation and prevention. Discoveries (Craiova). 7 (3), e100(2019).
- Heydorn, A., et al. Quantification of biofilm structures by the novel computer program COMSTAT. Microbiology (Reading). 146 (Pt 10), 2395-2407 (2000).
- Seneviratne, C. J., Yip, J. W. Y., Chang, J. W. W., Zhang, C. F., Samaranayake, L. P. Effect of culture media and nutrients on biofilm growth kinetics of laboratory and clinical strains of Enterococcus faecalis. Arch Oral Biol. 58 (10), 1327-1334 (2013).
- Rajewska, M., Maciąg, T., Narajczyk, M., Jafra, S. Carbon source and substrate surface affect biofilm formation by the plant-associated bacterium Pseudomonas donghuensis P482. Int J Mol Sci. 25 (15), 8351(2024).
- Goswami, S., Dey, C. COVID-19 and SARS-CoV-2: The Science and Clinical Application of Conventional and Complementary Treatments. , CRC Press. Boca Raton. (2022).
- Jeschke, M. G. Clinical review: Glucose control in severely burned patients - current best practice. Crit Care. 17 (4), 232(2013).
- Badoiu, S. C., et al. Glucose metabolism in burns—What happens. Int J Mol Sci. 22 (10), 5159(2021).
- Wacogne, B., et al. Concentration vs. optical density of ESKAPEE bacteria: A method to determine the optimum measurement wavelength. Sensors. 24 (24), 8160(2024).
- Meyer, C. T., et al. A high-throughput and low-waste viability assay for microbes. Nat Microbiol. 8 (12), 2304-2314 (2023).
- Allen, T. Serial Dilution Problem Help. , The University of Vermont. Available from: https://www.uvm.edu/~btessman/calc/serhelp.html (2012).
- Blog Post: Loading and Measurement of Volumes in 3D Confocal Image Stacks with ImageJ. , VISIKOL. Available from: https://visikol.com/blog/2018/11/29/blog-post-loading-and-measurement-of-volumes-in-3d-confocal-image-stacks-with-imagej/ (2024).
- Kasetty, S., Katharios-Lanwermeyer, S., O'Toole, G. A., Nadell, C. D. Differential surface competition and biofilm invasion strategies of Pseudomonas aeruginosa PA14 and PAO1. J Bacteriol. 203 (22), e0026521(2021).
- Shen, Y. Role of biofilm roughness and hydrodynamic conditions in Legionella pneumophila adhesion to and detachment from simulated drinking water biofilms. Environ Sci Technol. 49 (7), 4274-4282 (2015).
- Sankari, A., Sharma, S. Cystic Fibrosis. , StatPearls Publishing. Treasure Island, FL. (2025).
- Cameron, K., Jarvis, K. Urinary Catheterisation for Adults Clinical Guideline. , Available from: https://www.rightdecisions.scot.nhs.uk/media/2210/urinary-catheterisation-adultsfinal.pdf (2022).
- IV access improvement project guidelines: choosing catheter sizes. , Children's Hospital of Philadelphia. Available from: https://www.chop.edu/clinical-pathway/iv-access-improvement-project-guidelines-choosing-catheter-sizes (2017).
- Casadevall, A., Fang, F. C. Reproducible science. Infect Immun. 78 (12), 4972-4975 (2010).
- Sutlief, A. L., et al. Live cell analysis of shear stress on Pseudomonas aeruginosa using an automated higher-throughput microfluidic system. J Vis Exp. (143), e58926(2019).
- Shear Flow BioFlux Plates. , Cell Microsystems. Available from: https://cellmicrosystems.com/wp-content/uploads/2024/09/BioFlux-Brochure_v6-Single-page.pdf (2024).
- Wijesinghe, G., et al. Influence of laboratory culture media on in vitro growth, adhesion, and biofilm formation of Pseudomonas aeruginosa and Staphylococcus aureus. Med Princ Pract. 28, 28-35 (2019).
- Jahid, I. K., Lee, N. -Y., Kim, A., Ha, S. -D. Influence of glucose concentrations on biofilm formation, motility, exoprotease production, and quorum sensing in Aeromonas hydrophila. J Food Prot. 76 (2), 239-247 (2013).
- De Plano, L. M., Caratozzolo, M., Conoci, S., Guglielmino, S. P. P., Franco, D. Impact of nutrient starvation on biofilm formation in Pseudomonas aeruginosa: An analysis of growth, adhesion, and spatial distribution. Antibiotics. 13 (10), 987(2024).
- Tan, X., et al. Alkaline phosphatase LapA regulates quorum sensing-mediated virulence and biofilm formation in Pseudomonas aeruginosa PAO1 under phosphate depletion stress. Microbiol Spectr. 11 (6), e0206023(2023).
- Quan, K., et al. Water in bacterial biofilms: pores and channels, storage and transport functions. Crit Rev Microbiol. 48 (3), 283-302 (2022).
- Green, A. S. Modelling of peak-flow wall shear stress in major airways of the lung. J Biomech. 37 (5), 661-667 (2004).
- Lee, K., Han, J. Analysis of the urine flow characteristics inside catheters for intermittent catheter selection. Sci Rep. 14, 13273(2024).
- Wang, C., et al. Carbon starvation induces the expression of PprB-regulated genes in Pseudomonas aeruginosa. Appl Environ Microbiol. 85 (22), e01705-e01719 (2019).
- Sarinas, P. S. A., et al. Inspiratory flow rate and dynamic lung function in cystic fibrosis and chronic obstructive lung diseases. Chest. 114 (4), 988-992 (1998).
- Franca, M. J., Valero, D., Liu, X. Turbulence and Rivers. Treatise on Geomorphology. , Elsevier, Academic Press. (2022).
- Shroder, J. F. Treatise on Geomorphology. , Elsevier Science & Technology. San Diego. (2022).
- Narciso, D. A. C., Pereira, A., Dias, N. O., Melo, L. F., Martins, F. G. Characterization of biofilm structure and properties via processing of 2D optical coherence tomography images in BISCAP. Bioinformatics. 38 (6), 1708-1715 (2022).
Access restricted. Please log in or start a trial to view this content.
Reprints and Permissions
This article has been published
Video Coming Soon