We present a protocol for quantitative analysis of molecules or ions in subcellular compartments of live cells using Förster resonance energy transfer (FRET)-based biosensors. It includes standardized imaging, binary mask processing, and ratiometric analysis with linear regression applied to phosphate in Arabidopsis thaliana (A. thaliana) but is broadly applicable to other biosensors and organisms.
A subscription to JoVE is required to view this content. Sign in or start your free trial.
Method Article
Quantitative Ratiometric Analysis of FRET-Based Biosensors in Arabidopsis thaliana Enables Live Measurement of Analytes in Subcellular Compartments
In This Article
Summary
Abstract
Fluorescent biosensors provide a non-invasive and versatile approach to monitor dynamic changes in metabolite or ion concentrations within live cells. Specifically, FRET-based biosensors enable ratiometric measurements that report subcellular analyte levels while being independent of biosensor expression levels. We describe a comprehensive and standardized protocol for the quantitative ratiometric analysis of FRET-based biosensors in plants. The protocol guides users through live-sample preparation, confocal image acquisition of donors, FRET, and acceptor channels, binary mask generation for subcellular regions of interest, followed by regression-based ratiometric data analysis. The primary output is regression-derived ratiometric readout that enables quantitative comparisons between genotypes, tissues, developmental stages, and treatment conditions. Using the cpFLIPPi-5.3m biosensor for inorganic phosphate as an example, we demonstrate measurement of inorganic phosphate levels in the chloroplast stroma of A. thaliana. This analytical framework is broadly applicable to other FRET-based biosensors and model systems, enabling precise spatiotemporal quantification of metabolites and ions in vivo. This strategy delivers measurable insights into the subcellular dynamics of metabolites and ions, supporting comparisons under varied experimental settings.
Introduction
Monitoring metabolite and ion dynamics in live plant cells is essential for understanding how metabolic pathways and signaling networks are coordinated in space and time to support growth and development1,2. Cellular metabolite levels fluctuate rapidly in response to environmental cues such as nutrient availability, light intensity, and stress3. Among these, the level of inorganic phosphate (Pi) is particularly important with key roles in energy transfer, signaling, and metabolic regulation, yet its subcellular dynamics remain difficult to measure4.
Standard colorimetric assays and phosphorus-31 nuclear magnetic resonance, (³¹P)-NMR, can estimate total or compartmental Pi, but they lack single-cell resolution and have limited temporal precision5,6. While synchrotron X-ray spectrometry and radiotracer imaging provide subcellular or flux information, they cannot reliably distinguish Pi from phosphorylated metabolites and are often invasive. Non-aqueous fractionation and enzyme-based kinetic assays offer indirect estimates of stromal and cytosolic Pi, yet these approaches are labor-intensive and susceptible to contamination7,8. Together, these limitations underscore the need for non-destructive methods with high spatial and temporal resolution for monitoring metabolites like Pi such as live imaging of FRET-based biosensors.
Genetically encoded FRET-based biosensors are powerful tools for in vivo analyses of intracellular ion and metabolite dynamics. Early studies demonstrated the utility of such biosensors in monitoring glucose, sucrose, and ATP concentrations within cells9,10,11. More recent advances have extended this approach to monitor calcium, nitrate, phosphate, auxin, abscisic acid and gibberellin providing valuable insight into nutrient and hormone regulation12,13,14,15,16.
cpFLIPPi-5.3m is a FRET-based Pi biosensor optimized to monitor subcellular Pi levels in plant cells17. This biosensor consists of a cyanobacterial Pi-binding protein flanked by a FRET donor (eCFP, enhanced cyan fluorescent protein) and a FRET acceptor (cpVenus, a modified variant of the Venus yellow fluorescent protein), and it undergoes a conformational change upon Pi binding. This change alters the Pi-dependent FRET-derived fluorescence signal which is captured through confocal imaging such that an increase in Pi concentration results in decreased FRET/donor ratio. Pi-dependent ratiometric analysis is performed during post-processing of images by comparing the intensities of the acceptor and donor emissions18.
Quantitative ratiometric FRET analysis in live plant tissues requires correction for spectral bleed-through and cross-excitation of the donor (CFP) and acceptor (cpVenus) fluorophores, respectively18. Bleed-through arises when CFP emission is detected in the FRET channel, whereas cross-excitation results from excitation of cpVenus during CFP excitation. These spectral artifacts may vary across cells and subcellular compartments, particularly in pigmented plant tissues, and therefore confound ratiometric measurements. To obtain corrected or sensitized FRET emission, bleed-through and cross-excitation contributions are subtracted from the raw FRET signal as follows:
Sensitized FRET emission = Raw FRET emission - bleed-through - cross-excitation
Correction factors for bleed-through and cross-excitation are determined by imaging plants expressing CFP or cpVenus individually in the same cellular and subcellular locations as the biosensor18. Sensitized FRET emission is then calculated as follows:
Sensitized FRET emission = Raw FRET emission - (CFP emission × bleed-through correction factor) - (cpVenus emission × cross-excitation correction factor)
The ratio of sensitized FRET emission to donor emission (FRET ratio) reports relative changes in ligand concentration and is independent of biosensor expression levels19.
The cpFLIPPi-5.3m biosensor has been successfully targeted to distinct subcellular compartments of A. thaliana and other species, enabling visualization of Pi dynamics18,20,21,22. This biosensor revealed heterogeneity in cytosolic Pi distribution and transport among tissues and have linked chloroplast stromal Pi fluctuations to transporter activity and photosynthetic performance20,21. Because the biosensor reports changes within a defined dynamic range, interpretation requires the range to encompass in vivo Pi levels under stable imaging conditions. Uneven illumination or very low biosensor abundance can influence ratiometric measurements, highlighting the importance of standardized acquisition settings and appropriate negative controls such as the Pi insensitive control sensor20.When FRET ratio variation across regions-of-interest (ROIs) is minimal, regression analysis may not be appropriate, and pooling ROI means is recommended.
In this article, we present a detailed protocol for quantitative ratiometric analysis of cpFLIPPi-5.3m in A. thaliana, including confocal imaging, image segmentation using binary masks, and FRET ratio calculations for dynamic monitoring of Pi in live cells. This method provides a reproducible workflow for analyzing FRET-based biosensor signals, with ratiometric data analyzed using linear regression and statistical comparisons across experimental conditions. Representative data are shown using altered chloroplast stroma Pi accumulation in pht2;1, a chloroplast Pi transporter mutant expressing the cpFLIPPi-5.3m sensor21,23. This protocol will help researchers apply FRET-based ratiometric imaging to other experimental systems by detailing biosensor spectral corrections, imaging settings, and quantitative analysis steps. By standardizing image acquisition and regression-based analysis within defined experimental contexts, the workflow supports consistent comparison of FRET responses across samples analyzed under matched conditions. It is appropriate for those seeking to measure rapid and compartment-specific changes in analyte levels in living plant tissues, including mutants or transgenic lines with altered metabolite transport or metabolism. This standardized approach will facilitate reproducibility of quantitative live-cell imaging studies in plant biology. In addition to the chloroplast-localized Pi biosensing described here, the analytical strategy can be adapted to other FRET-based biosensors and organism-specific tissues provided that biosensor-specific calibration and control measurements are established.
Access restricted. Please log in or start a trial to view this content.
Protocol
NOTE: Arabidopsis transgenic lines expressing cpFLIPPi-5.3m and cpFLIPPi-null (cytosolic and plastid-targeted variants) were generated previously17,18, and pht2;1-1 (CS19883) was obtained from the Arabidopsis Biological Resource Center, MS medium, cover glasses, perfluorodecalin, confocal microscope and a 40x oil-immersion objective (numerical aperture 1.3), excitation lasers (CFP/445 nm and cpVenus/515 nm or instrument-appropriate emission wavelengths), emission filters for CFP, cpVenus/FRET, and cpVenus acceptor, camera or detectors, image analysis workstation, FIJI24 and Excel.
1 . Sample preparation
- Generation of transgenic A. thaliana lines
- Clone the cpFLIPPi-5.3m biosensor, and Pi-insensitive control (cpFLIPPi-Null), donor-only (CFP), and acceptor-only (cpVenus) controls into plant expression vectors17.
- For stable expression, transform A. thaliana plants in the sgs3-13 mutant background via Agrobacterium tumefaciens floral dip, harvest T1 seeds, and select transformants on 0.5x Murashige & Skoog (MS) agar plates containing the appropriate selection agent, e.g., phosphinothricin (10 µg/mL).
- Sterilize A. thaliana seeds expressing the biosensors by submerging in 70% ethanol for 1 min, transfer to 50% bleach for 1 min, and then rinse 6-10x with sterile water.
CAUTION: Ethanol and bleach are irritants and should be handled while wearing appropriate personal protective equipment (PPE). Perform seed sterilization in a chemical fume hood or well-ventilated area to avoid inhalation of fumes and never mix bleach and ethanol directly. Dispose of waste solutions according to the institutional chemical safety guidelines. - Stratify seeds at 4°C in the dark for 2-3 days to synchronize germination, then transfer seeds to agar-solidified or liquid 0.5x MS medium containing 0.25% sucrose and the desired Pi concentration (250 µM) for the experimental design. Include the selection agent if selecting transformants.
- Transfer plates to a controlled growth chamber set to 21°C, 16 h light: 8 h dark photocycle, 120 µmol·m⁻²·s⁻¹ light intensity, and ~60% relative humidity. Grow seedlings for 4-7 days to image roots or transfer seedlings to soil for 21 days to image leaves.
- If testing Pi treatments, transfer seedlings to the desired Pi media (e.g., 250 µM Pi for Pi replete; 10 µM Pi for Pi-deficient) and maintain treatment for the defined period (e.g., 48 h for acute Pi deprivation).
- If possible, screen plants for adequate sensor expression by imaging for donor or acceptor fluorescence (low-intensity excitation) using a fluorescence stereo microscope (7-10x magnification).
- Evaluate lines in the same genetic background that express cpFLIPPi-null as ligand-insensitive controls.
2 . Confocal imaging
- For roots, mount seedlings in their growth medium/sterile water on a glass slide. Gently overlay with a small coverslip to flatten roots without compression. Image immediately.
- For leaves, excise the target leaf (e.g., 3rd or 4th leaf in 21 day old plants), place the adaxial surface down in a slide.
- Infiltrate with 10-15 µL perfluorodecalin to clear air spaces if needed, and gently overlay with a small glass weight to flatten the sample. Image immediately.
- Use a high-NA objective appropriate for live cells (e.g., 40× / 1.2-1.3 NA). Use the same objective for all samples to maintain comparability.
- Using the Metamorph software, set the excitation and emission channels and capture images (Figure 1).
NOTE: For capturing the Donor (CFP) emission: excitation at ~445 nm (or instrument-appropriate CFP line) and collection of donor emission (e.g., 470-500 nm bandpass) could be used. For example, excitation of the 445 nm laser at 70% (Figure 1A) with an exposure time of 1000 ms (Figure 1B) was used to capture the CFP emission. For capturing the FRET (sensitized acceptor emission): excitation at donor wavelength (445 nm) and collection of acceptor emission band (e.g., 530-560 nm). For capturing the direct acceptor channel: excitation at acceptor excitation (e.g., 500-515 nm) and collection of same acceptor emission band as for FRET. - Acquire images sequentially: capture donor excitation/donor emission, donor excitation/FRET emission, then acceptor excitation/acceptor emission. Keep imaging time per field short to limit photobleaching (500-1000 ms).
NOTE: For each cellular location (root cytosol, leaf mesophyll cytosol, chloroplast stroma), determine optimal laser power, detector gain, and exposure time (Figure 1) such that mean pixel intensities are above the local background but below detector saturation. Maintain identical capture settings for donor excitation-derived channels (donor and FRET) for a given location. Imaging parameters are dependent on the sample, microscope, light source, and detection system, and therefore must be determined empirically, with acceptable ranges evaluated and documented through regression analysis as described in this protocol. The image capture software used here is Metamorph version 7. - Use the same detector sensitivity (for example, here, gain of 2.4x and zero offset was used) across all images for a target location. If using multiple detectors, characterize spectral responses for each detector and document them.
- Acquire control images for each tissue/genotype of interest.
- Image untransformed wild-type tissue to determine background autofluorescence for each channel.
- Image plants expressing donor-only (CFP) and acceptor-only (cpVenus) at the same capture settings for each location to derive spectral correction coefficients (bleed-through and cross-excitation). Capture images from multiple individuals (≥6-8) with a range of emission intensities.
3 . Image processing
- Open the raw images of donor (referred to as CC for donor excitation/emission), FRET (referred to as CY for donor excitation/acceptor emission), and acceptor (referred to as YY for acceptor excitation/emission) channels in analysis software such as FIJI or ImageJ. (Figure 2).
- Determine mean background intensity per channel by sampling multiple (5-10) ROIs in equivalent locations from untransformed plants imaged with the same settings. Subtract the mean background value from each corresponding channel image.
- Steps to follow in FIJI
- Click on Tab Analyze> Set Measurements > Select mean gray value. Measure the background intensity by choosing a specific ROI or a mean of the whole image.
- Click on Tab Analyze> Measure. Save the values to an Excel spreadsheet and calculate mean background values for each channel. Threshold the donor (CFP) image to define the biosensor spatial boundary (donor typically has the lowest signal). Convert the thresholded donor image to a binary mask (Figure 3 A).
- Click on Tab Image> Adjust> Threshold.
- A window for thresholding will open. Choose Max Entropy method for thresholding. Establish the spatial boundary, in this case, the chloroplast stroma, and apply the threshold. This generates a black and white binary image (Figure 3 B).
- Click on Tab Math> Divide> Enter value 255. The image will become all white. Save this binary mask image as a .tiff file.
- Multiply the binary mask with all three background-subtracted images to create masked images for analysis (Figure 3C).
- Open the binary mask file in FIJI.
- Click on Tab Process> Math>Multiply.
- Choose the binary mask as one of the images and the background-subtracted CC image as the other one.
- Repeat the steps for CY and YY.
- Draw ROIs on the masked images appropriate to the structure under study (whole cell, cytosol, chloroplast stromal). For each ROI, extract mean pixel intensities for donor, FRET, and direct acceptor channels. Save ROI metadata (image name, coordinates, experimental condition, replicate ID) for downstream statistical analysis.
- Open CC, CY and YY images.
- Click on Tab Math> Subtract> Enter mean background value. Alternatively, this can be done right before calculating sensitized FRET in Excel.
- Open the masked CC file.
- Click on Tab Process > Image calculator. Multiply CC with the masked CC image file. This will open a new 32-bit image file.
- Draw ROIs using the appropriate FIJI tools in the main taskbar. For example, here the chloroplast stroma is selected using "Oval" ROI tool. Add the ROIs to an ROI manager (ctrl+T). Choose 5-10 ROIs per image. Check "Show All". These ROIs can be stored as a separate metafile (Figure 3D). Do not close the ROI manager.
- Click on Tab Analyze> Set measurements> Select mean gray value.
- Click on "Measure" on the ROI manager.
- The mean pixel values of the chosen ROIs will appear as a list in a separate window.
- Copy these data to Excel. Do not close the ROI manager.
- Repeat the multiplication of the masked CC file with the CY and YY images to obtain measurements of the same ROIs using the ROI manager in each individual channel. Store the values in Excel.
4. Ratiometric analysis
- Open Microsoft Excel to carry out the following operations (Figure 4).
- Calculation of the correction coefficients.
- For each cellular location, plot FRET-channel intensities (Y-axis) from donor-only plants against donor intensities (X-axis). Fit a linear regression. The slope is the donor bleed-through coefficient (designated as a).
- Repeat by plotting FRET-channel intensities from acceptor-only plants (Y-axis) against direct acceptor intensities (X-axis). The slope is the acceptor cross-excitation coefficient (designated as b).
- Use ≥15-20 ROIs from multiple plants to obtain robust coefficients. For the chloroplast stroma, 50-60 chloroplasts are chosen.
- Calculate sensitized FRET for each ROI as
Sensitized FRET = Raw FRET - (a × donor) - (b × acceptor)
where a and b are location-specific coefficients derived above (Figure 4). - Plot sensitized FRET (Y-axis) vs. donor channel intensities (X-axis) for pooled ROIs. Fit a linear regression and Excel will provide a fit in the format y = mx + c, where y corresponds to the sensitized FRET intensities, x to the donor intensities, c to the y intercept, and m to the slope of the regression. Note R² for the fitted regressions. Typically, R² ranges from 0.8-1, representing a good fit (Figure 4).
- For cytosolic and stromal measurements, compute and use the slope of FRET/donor (Sensitized FRET ÷ donor) as the ratiometric readout also referred to as the FRET ratio.
NOTE: The error of the fit for the regression represents standard error of the slope (use LINEST function in Excel). Use location-specific selection consistently across samples and genotypes of interest. Linear regression applied to data from multiple ROIs and independent plants confirms that the FRET ratio is independent of sensor abundance. - Calibration, controls, and distinguishing nonspecific effects.
- Use cpFLIPPi-null (ligand-insensitive variant) expressed in parallel and processed identically to distinguish potential nonspecific changes in FRET ratio (pH, ionic strength, photophysics) from Pi-specific changes.
- Aggregate ROI-level data with fields: genotype, compartment, replicate plant ID, ROI ID, donor, acceptor, raw FRET, sensitized FRET, fitted ratio (as applicable). Preserve raw intensities.
- For population comparisons use the regression-derived slopes as primary statistics; report slopes ± SE and % relative error.
- Apply appropriate inferential statistics (e.g., Student's t-test or ANOVA) on regression-derived parameters. Use nonparametric tests if distributions violate normality. Correct multiple comparisons when applicable.
- Quality control checklist (before accepting data)
- Confirm that all three channels for each image are below detector saturation and have adequate signal to noise ratio (>2-10x background).
- Confirm that donor and acceptor single-fluorophore controls were imaged at identical settings and yielded linear relationships for deriving correction coefficients a and b.
- Confirm image registration is accurate and that masks correctly define biosensor-containing regions.
- Confirm cpFLIPPi-null control shows expected lack of Pi sensitivity.
- Representative quality control metrics to aid in excluding images
- Saturation rate: Fewer than 1-2% of pixels reach the maximum intensity (65,535) for 16-bit images.
- Background level: Mean intensity in cell-free regions ranges from ~50-200 units.
- Pixel-intensity range: Mean intensities are well above background yet remain below saturation (~2,000-20,000 units).
- Signal-to-noise ratio (SNR): Values should exceed 2-10.
5. Statistical test for difference between two regression slopes
- Determine whether two slopes (regression-derived FRET ratio slopes from two genotypes or treatments) differ significantly25.
- Calculate test statistic and degrees of freedom as follows
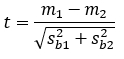
with degrees of freedom df = n1 + n2 - 4.m1 and m2 correspond to the slopes from linear regression, sb1 and sb2 refer to standard error of each slope (obtain from LINEST or regression output) and n1 and n2 are the sample sizes (number of ROIs used to fit each regression). - Obtain a two-tailed p-value for t with df (e.g., use a t-distribution table, or an online calculator26). When using the online calculator (Figure 5C), input the sb1 and sb2 and n1 and n2 obtained in the previous step to calculate the p-value and test statistics.
- Interpretation will be to reject the null hypothesis (slopes are not significantly different) if p < α (e.g., α = 0.05). Report b1, b2, sb1, sb2, t, df, and p.
Access restricted. Please log in or start a trial to view this content.
Results
Confocal imaging
Using confocal microscopy and Metamorph software, separate channels were acquired to visualize the FRET donor and acceptor signals in A.thaliana leaf tissues of wildtype (WT) and the pht2;1 chloroplast Pi transporter mutant (Figure 2). Representative images illustrate clear subcellular localization of the Pi biosensor, with chloroplasts readily distinguishable not only within individual cells but also between dif...
Access restricted. Please log in or start a trial to view this content.
Discussion
This protocol provides a standardized approach for live-cell quantification of metabolites or ions using FRET-based biosensors. Key advantages include non-invasive ratiometric measurement and applicability to multiple subcellular compartments17,20,21,22. The use of binary masks and linear regression improves precision and reproducibility. While demonstrated here for subcellular Pi in A. tha...
Access restricted. Please log in or start a trial to view this content.
Disclosures
The authors declare no conflicts of interest related to this work.
Acknowledgements
We acknowledge the contributions of past members of the W.K.V. lab, whose efforts have supported the development of this protocol. Financial support was provided by the U.S. Department of Energy, Office of Science, Bioimaging Technology Program (DE-SC0014037) and Basic Energy Sciences (DE-FG02-04ER15559). A.S.R. was supported in part by funds from the Hagler Institute for Advanced Study, Texas A&M University.
Access restricted. Please log in or start a trial to view this content.
Materials
| Name | Company | Catalog Number | Comments |
|---|---|---|---|
| 40X oil-immersion objective | Olympus | https://www.edmundoptics.in/p/olympus-uplxapo-40x-oil-immersion-objective/55558/?srsltid=AfmBOoo0cqmgz7SoQ3ZCUvlJn_LeA37O42aX5BbFqF76k40CwQLNVn4P | Objective lens for imaging |
| Cover glasses / coverslips | VWR | 48393-081 | Cover slip for sample placement |
| FIJI (ImageJ) | Open source | 2.9.0 | Image analysis software |
| Inverted Olympus IX81 microscope | Olympus | http://www.olympusconfocal.com/brochures/pdfs/ix81.pdf | Confocal imaging system |
| iXon3 897 EMCCD camera | Andor Technology | https://andor.oxinst.com/products/ixon-emccd-camera-series/ixon-life-897 | Part of confocal imaging system |
| MetaMorph software V7 | Molecular Devices .LLC | Version 7 | Image analysis workstation |
| Microsoft Excel | Microsoft Suite | v16.68 | Data analysis software |
| Murashige & Skoog (MS) medium | Caisson | MSP11-10LT | Plant growth medium |
| Perfluorodecalin (Acros Organic) | Acros Organics | P9900-25G | Imaging medium |
| Phosphinothricin | Sigma | 77182-82-2 | Antibiotic |
| Plant growth chamber | Conviron | Custom | Growth chamber |
| Yokogawa CSU-X1 spinning disk confocal unit | Yokogawa | https://www.yokogawa.com/solutions/products-and-services/life-science/spinning-disk-confocal/csu-x1-confocal-scanner-unit/ | Part of confocal imaging system |
References
- Frommer, W. B., Davidson, M. W., Campbell, R. E. Genetically encoded biosensors based on engineered fluorescent proteins. Chem Soc Rev. 38 (10), 2833-2841 (2009).
- Okumoto, S., Jones, A., Frommer, W. B. Quantitative imaging with fluorescent biosensors. Annu Rev Plant Biol. 63, 663-706 (2012).
- Sweetlove, L. J., Fernie, A. R. The role of dynamic enzyme assemblies and substrate channelling in metabolic regulation. Nat Communications. 9 (1), 2136(2018).
- Plaxton, W. C., Tran, H. T. Metabolic adaptations of phosphate-starved plants. Plant Physiol. 156 (3), 1006-1015 (2011).
- Mimura, T. Regulation of phosphate transport and homeostasis in plant cells. Int. Rev. Cytol. 191, 149-200 (1999).
- Roberts, J. K., Wemmer, D., Ray, P. M., Jardetzky, O. Regulation of cytoplasmic and vacuolar pH in maize root tips under different experimental conditions. Plant Physiol. 69 (6), 1344-1347 (1982).
- Gerhardt, R., Heldt, H. W. Measurement of subcellular metabolite levels in leaves by fractionation of freeze-stopped material in nonaqueous media. Plant Physiol. 75, 542-547 (1984).
- Farquhar, G. D., Caemmerer, S. V., Berry, J. A. A biochemical model of photosynthetic CO2 assimilation in leaves of C3 species. Planta. 149 (1), 78-90 (1980).
- Deuschle, K., Chaudhuri, B., Okumoto, S., Lager, I., Lalonde, S., Frommer, W. B. Rapid metabolism of glucose detected with FRET glucose nanosensors in epidermal cells and intact roots of Arabidopsis RNA-silencing mutants. Plant Cell. 18 (9), 2314-2325 (2006).
- Fehr, M., Takanaga, H., Ehrhardt, D. W., Frommer, W. B. Evidence for high-capacity bidirectional glucose transport across the endoplasmic reticulum membrane by genetically encoded fluorescence resonance energy transfer nanosensors. Mol Cell Biol. 25 (24), 11102-11112 (2005).
- Imamura, H., Nhat, K. P. H., Togowa, H., Noji, H. Visualization of ATP levels inside single living cells with fluorescence resonance energy transfer-based genetically encoded indicators. Proc Natl Acad Sci USA. 106 (37), 15651-15656 (2009).
- Lanquar, V., Grossman, G., Vinkenborg, J. L., Merkx, M., Thomine, S., Frommer, W. B. Dynamic imaging of cytosolic zinc in Arabidopsis roots combining FRET sensors and RootChip technology. New Phytol. 202 (1), 198-208 (2014).
- Sadoine, M., De Michele, R., Župunski, M., Grossmann, G., Castro-Rodríguez, V. Monitoring nutrients in plants with genetically encoded sensors: achievements and perspectives. Plant Physiol. (1), 195-216 (2023).
- Tagliani, A. AuxSens, a FRET-based auxin biosensor. Mol Plant. 14 (7), 1051-1052 (2021).
- Rowe, J., Grangé-Guermente, M., Exposito-Rodriguez, M. Next-generation ABACUS biosensors reveal cellular ABA dynamics driving root growth at low aerial humidity. Nat Plants. 9 (7), 1103-1115 (2023).
- Rowe, J. H., Rizza, A., Jones, A. M. Quantifying Phytohormones in vivo with FRET Biosensors and the FRETENATOR Analysis Toolset. Meth Mol Biol. 2494, 239-253 (2022).
- Mukherjee, P., Banerjee, S., Wheeler, A., Ratliff, L. A., Irigoyen, S., Garcia, L. R., Lockless, S. W., Versaw, W. K. Live imaging of inorganic phosphate in plants with cellular and subcellular resolution. Plant Physiol. 167 (3), 628-638 (2015).
- Banerjee, S., Garcia, L. R., Versaw, W. K. Quantitative imaging of FRET-based sensors for cell and organelle-specifc analyses in plants. Microsc Microanal. 22, 300-310 (2016).
- Xia, Z., Liu, Y. Reliable and global measurement of fluorescence resonance energy transfer using fluorescence microscopes. Biophys J. 81 (4), 2395-2402 (2001).
- Sahu, A., Banerjee, S., Raju, A. S., Chiou, T., Garcia, L. R., Versaw, W. K. Spatial profiles of phosphate in roots indicate developmental control of uptake, recycling, and sequestration. Plant Physiol. 184 (4), 2064-2077 (2020).
- Raju, A. S., Kramer, D. M., Versaw, W. K. Genetically manipulated chloroplast stromal phosphate levels alter photosynthetic efficiency. Plant Physiol. 196 (1), 385-396 (2024).
- Zhang, S., Daniels, D. A., Ivanov, S., Jurgensen, L., Müller, L. M., Versaw, W. K., Harrison, M. J. A genetically encoded biosensor reveals spatiotemporal variation in cellular phosphate content in Brachypodium distachyon mycorrhizal roots. New Phytol. 234 (5), 1817-1831 (2022).
- Versaw, W. K., Harrison, M. J. A chloroplast phosphate transporter, PHT2;1, influences allocation of phosphate within the plant and phosphate-starvation responses. Plant Cell. 14 (8), 1751-1766 (2002).
- Schindelin, J., Carreras, I., Frise, E., Kaynig, V., Longair, M., Pietzsch, T., Preibisch, S., Rueden, C., Saalfeld, S., Schmid, B., Tinevez, J., White, D. J., Hartenstein, V., Eliceiri, K., Tomancak, P. Fiji: an open-source platform for biological-image analysis. Nat methods. 9 (7), 676-682 (2012).
- Cohen, J. Applied multiple regression/correlation analysis for the behavioral sciences. , https://psycnet.apa.org/record/2002-18109-000 (2003).
- Soper, D. S. Significance of the difference between two slopes calculator. , https://www.danielsoper.com/statcalc (2025).
- Castellani, C. M., Torres-Ocampo, A. P., Breffke, J., White, A. B., Chambers, J. J., Stratton, M. M., Maresca, T. J. Live-cell FLIM-FRET using a commercially available system. Meth Cell Biol. 158, 63-89 (2020).
- Kanno, S., Cuyas, L., Javot, H., Bligny, R., Gout, E., Dartevelle, T., Hanchi, M., Nakanishi, T. M., Thibaud, M. C., Nussaume, L. Performance and limitations of phosphate quantification: guidelines for plant biologists. Plant and Cell Physiol. 57 (4), 690-706 (2016).
- Verma, A. K., Noumani, A., Yadav, A. K., Solanki, P. R. FRET based biosensor: principle applications recent advances and challenges. Diagnostics. 13 (8), 1375(2023).
- Banerjee, S., Versaw, W. K., Garcia, L. R. Imaging cellular inorganic phosphate in Caenorhabditis elegans using a genetically encoded FRET-based biosensor. PLoS One. 10 (10), e0141128(2015).
Access restricted. Please log in or start a trial to view this content.