This study presents a combined AlCl₃/Folin–Ciocalteu approach for HPTLC profiling and quantification of flavonols/5-hydroxyflavones and phenolic compounds in citrus peels, complemented by microplate analysis.
Method Article
Integrated Microplate and HPTLC Strategy for Determining and Profiling Total Phenolics and Flavonols in Citrus Peel Extracts
In This Article
Summary
Abstract
Phenolic compounds and flavonoids significantly contribute to the antioxidant activity and functional value of citrus by-products. However, conventional colorimetric assays, while widely used, lack chromatographic separation and may be affected by chemical interferences. This protocol presents an integrated analytical workflow that combines microplate spectrophotometric assays with high-performance thin-layer chromatography (HPTLC) for the determination and profiling of total phenolic content (TPC) and total flavonols plus 5-hydroxyflavones content (TFHC) in citrus peel extracts. Ethanolic extracts of lime (Citrus aurantifolia) and mandarin (Citrus reticulata) peels were evaluated using Folin–Ciocalteu (FC) and aluminum chloride (AlCl₃) assays in a 96-well microplate format, followed by HPTLC analysis employing two sequential mobile phases and dual post-chromatographic derivatization. Microplate measurements yielded TPC values of 74.2 mmol/g for lime and 72.8 mmol/g for mandarin, while TFHC values were 15.5 mmol/g and 6.0 mmol/g, respectively. HPTLC separation resolved four phenolic bands in lime and six in mandarin. Two lime bands were selectively visualized after AlCl₃ derivatization, consistent with flavonols or 5-hydroxyflavones. The sum of phenolic bads estimated by HPTLC was 22.0 and 20.8 mmol/g dry matter for lime and mandarin, respectively, while TFHC reached 13.4 mmol/g in lime and was not detected in mandarin. These findings demonstrate that microplate assays provide rapid and sensitive estimation of total content, whereas HPTLC enhances selectivity through compound separation and functional-group-specific derivatization. The combined strategy enables high-throughput screening followed by chromatographic confirmation, offering a practical and reproducible platform for phytochemical characterization of complex plant matrices.
Introduction
Citrus peels are a by-product of the juice industry and have demonstrated the presence of functional compounds such as antioxidants1. They have been used as neuroprotective foods2, anti-inflammatory, anti-acne cosmeceuticals3, and food additives4. Several of these bioactivities are attributed to flavonoids5, and to phenolic compounds6. General methods to estimate the total amount of flavonoids and phenols have been established in the literature7, the most common being the Folin-Ciocalteu for total phenolic content (TPC)8, and the Aluminum Chloride for total flavonoid compounds (TFC)9 by spectrophotometry. The Folin-Ciocalteau method was published 1927 for the first time10, based on a modification of the Folin-Denis reaction11, both based on a redox reaction of phosphotungstic-phosphomolibdic compounds. Folin-Ciocalteau method measures reductive capacity of phenolic compounds12. The aluminum chloride and flavonoid test was first proposed in 1960, based on complexes between the metal and flavonoid ligands13.
Both spectrophotometric assays are useful tools for estimating and comparing the overall content of phytocompounds commonly found in plant materials. However, they are subject to various limitations. For example, some limitations arise from the use of external standards14, where it is generally assumed that the chemical nature of the standard does not significantly affect the signal response. In practice, this assumption is difficult to validate, since molar absorptivity depends on factors such as conjugation and other structural features that are challenging to standardize in natural products. For instance, Appel et al15 evaluated TPC from eleven oak species and developed the so-called “self-standard” approach, reporting differences greater than 50% in the slopes of the calibration curves. Self-standard utilization is a strategy designed to represent the same compositional mixture of compounds as present in the sample, thereby providing a closer match to the actual Total Phenolic Content (TPC) in the sample16. Self-standards also provide some information about the ratio between reactive groups and average molecular weight; however, it is laborious and difficult to standardize.
The total flavonoid compounds assay based on aluminum chloride complexation has been critically evaluated in recent studies17,18, which concluded that AlCl₃ specifically forms complexes with two subgroups of flavonoids: flavonols and 5-hydroxyflavones. Typically, flavonols exhibit maximum absorption around 440 nm, whereas 5-hydroxyflavones absorb near 415 nm. In addition, certain flavonoids may display intrinsic absorbance within the 415–440 nm range even in the absence of derivatization, and the increase in absorptivity upon complexation varies among individual compounds. Moreover, both colorimetric assays lack separation and therefore cannot distinguish between different phenolic constituents; while this feature may be advantageous for estimating total contents, it results in limited specificity. These considerations highlight the need for an analytical strategy that resolves individual components prior to colorimetric detection, thereby distinguishing true assay responses from spectral or chemical interferences.
Despite these limitations, such assays remain valuable tools for the general screening of bioactive phenolic compounds in plant and fruit extracts19. To assess potential interferences, the use of a high-performance thin layer chromatography (HPTLC) method, which was revealed with both Folin–Ciocalteu and AlCl₃ reagents, represents an effective approach. Chromatographic separation enables the detection of interfering substances with pre-existing absorption bands prior to complexation, while photographic documentation allows simultaneous analysis of multiple absorption maxima. In addition, HPTLC analysis offers several advantages over more comprehensive chromatographic techniques such as HPLC–MS/MS, including lower solvent consumption, shorter analysis time due to the simultaneous processing of multiple samples (up to 18 per plate)20, and facilitated interpretation of complex mixtures owing to the selectivity of post-chromatographic derivatization21.
In this work, we present an integrated protocol for the determination of the specific compounds comprising total polyphenolic content (TPC) and total flavonols plus 5-hydroxyflavones (TFHC) in citrus peel extracts using high-performance thin-layer chromatographic (HPTLC) separation, together with a general content estimation based on a microplate colorimetric assay. Planar chromatographic quantification of phenolic compounds is performed using the Folin–Ciocalteu reagent, while aluminum chloride derivatization is applied exclusively for the chromatographic identification of bands corresponding to flavonols and 5-hydroxyflavones. In this approach, TFHC determination relies on the Folin–Ciocalteu response of chromatographically resolved and chemically identified compounds, rather than on aluminum chloride complexation for quantification. The HPTLC analysis enables compound-specific separation and visualization, allowing the identification of individual phenolic constituents and the detection of potential spectral interferences. In addition, a microplate-based spectrophotometric method is presented for rapid estimation of total TPC and TFHC, providing a complementary high-throughput screening tool for complex plant matrices.
Protocol
1. Fruit peels preparation
- Remove approximately 50 g of peels from each fruit, separating them from the edible portion. For our representative results, mandarins were bought at a local store (imported from Chile, Isabelline variety), and limes were collected from a tree near San José, Costa Rica (voucher specimen JVR-16434).
- Place the peels in a plastic zip-lock bag and freeze them at -20 °C for at least 2 h.
- Transfer the frozen peels to a precooled freeze-dryer, keep the bags open, and apply vacuum (0.1 mbar) overnight until completely dry.
- Grind each dried material to approximately 0.1 mm using a blade mill.
2. Extraction
- Weigh approximately 100 mg of dry, ground citrus peel (lime or mandarin) and place it in a 15 mL glass tube.
- Add 3 mL of 60% ethanol to the tube.
- Sonicate the mixture in an ultrasonic bath for 10 min at 40 °C to disrupt plant cells and facilitate phytochemical release.
- Centrifuge the sample at 850 × g for 10 min.
- Carefully transfer the ethanolic supernatant to a 10 mL volumetric flask using a Pasteur pipette, avoiding the disturbance of the sediment.
- Add an additional 3 mL of 60% ethanol to the tube containing the moist solid residue.
- Repeat the sonication and centrifugation steps described above in steps 2.3 and 2.4.
- Transfer the supernatant to the same volumetric flask and combine it with the previous extract.
- Perform a third extraction by repeating the previous steps (2.6–2.8).
- Acidulate the combined extract (≈9 mL) with two drops of 0.1 mol/L HCl (in order to increase the stability of anthocyanins and other phenolic compounds) and bring the volume to 10 mL with methanol.
- Perform this procedure in triplicate for each sample.
3. Total flavonols and 5-hydroxyflavones content (TFHC) by microplate spectrophotometry
- Prepare a quercetin stock solution (100 µg/mL) or an equivalent flavonoid standard.
- Weigh 10 mg of quercetin using a balance with 0.1 mg precision.
- Dissolve the quercetin in approximately 5 mL of 95% ethanol and transfer the solution to a 10 mL volumetric flask labeled as the stock solution.
- Rinse the beaker twice with 2 mL of 95% ethanol and add the rinses to the flask.
- Bring the volume to the mark with 60% ethanol.
- Prepare standard solutions (10–100 µg/mL) and a blank in 1.5 mL microcentrifuge tubes according to Table 1.
- Ensure that all samples and standards fall within an absorbance range of 0.2–0.8, adjusting concentrations if necessary.
- Prepare the microplate layout by dispensing 60 µL of blank, sample, or standard into each well according to Figure 1. Perform three replicates per sample or standard.
- Dispense aqueous solutions of 2% aluminum chloride, 5% sodium acetate, and 80% methanol into separate reagent reservoirs.
NOTE: Handle aluminum chloride and methanolic solutions with care. Aluminum chloride solutions are irritating, and methanol is toxic by ingestion, inhalation, and skin absorption. Avoid skin and eye contact and wear appropriate PPE - Using an 8-channel multichannel pipette, add 10 µL of AlCl₃ solution, 10 µL of sodium acetate solution, and 200 µL of 80% methanol to each well.
- Shake the plate at intermediate intensity for 10 s and incubate it in the dark for 30 min.
- Measure absorbance at 415 nm. If shaking is unavailable, mix manually with a micropipette before incubation (Figure 2).
- Interpolate sample absorbance values from the calibration curve and apply dilution, volumetric, and mass correction factors as needed.
Table 1: Amounts of quercetin standards for total flavonols and 5-hydroxyflavones content (TFHC) calibration curve. Please click here to download this Table.
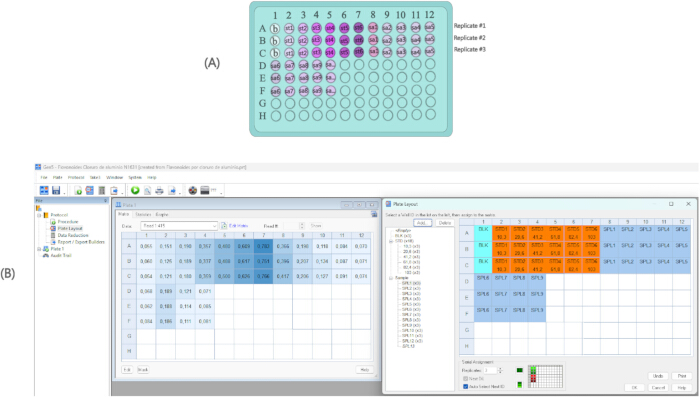
Figure 1: Microplate layout for total flavonols and 5-hydroxyflavones content (TFHC) microplate analysis. (A) Scheme of microplate. (B) Software Gen5 layout program. Please click here to view a larger version of this figure.
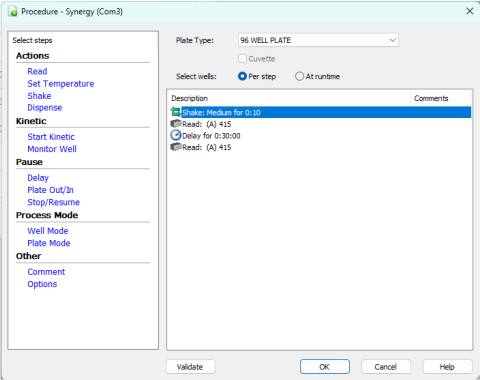
Figure 2: Microplate software set-up for total flavonols and 5-hydroxyflavones content analysis. Please click here to view a larger version of this figure.
4. Total polyphenolic content (TPC) by microplate spectrophotometry
- Prepare a gallic acid standard curve (0.000–0.120 mg/mL).
- Weigh approximately 0.0123 g of gallic acid (98% purity) using an analytical balance and dissolve it in distilled water.
- Transfer the solution to a 10 mL volumetric flask, rinse twice, and fill to the mark with distilled water to obtain the stock solution.
- Prepare a working solution by diluting 1 mL of the stock solution to 10 mL with distilled water.
- Prepare calibration standards by further diluting the working solution according to Table 2.
- Adjust concentrations if absorbance values fall outside the 0.2–0.8 range.
- Prepare the Folin–Ciocalteu working reagent by diluting the commercial reagent 1:14 with distilled water.
NOTE: Folin–Ciocalteu reagent and hydrochloric acid solutions are corrosive. Avoid splashes and direct contact. Perform reagent handling in a fume hood. - Pipette 30 µL of each sample, standard, or blank into a 96-well microplate following the layout in Figure 3A, using three replicates per sample.
- Add 215 µL of Folin–Ciocalteu working reagent to each well using a multichannel pipette.
- Add 50 µL of 20% sodium carbonate solution to each well and mix thoroughly with a micropipette.
- Incubate the plate for 20 min at 40 °C with agitation (Figure 3B).
- Measure absorbance at 755 nm.
Table 2: Amounts of Gallic Acid Standards for Total Phenolic Content (TPC) Calibration Curve. Please click here to download this Table.
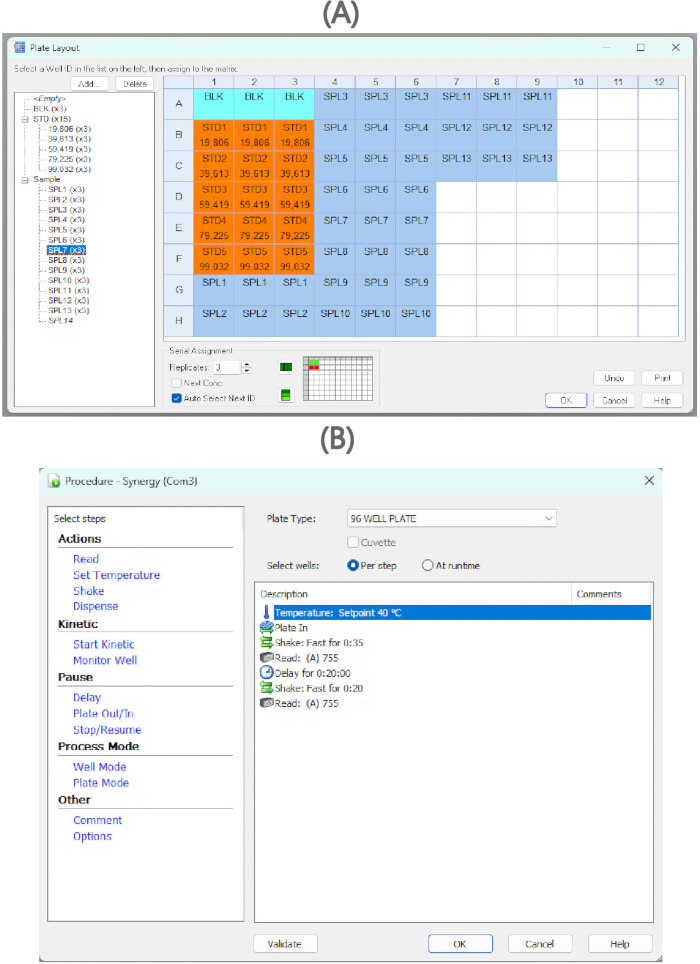
Figure 3: Microplate layout and software set-up for total phenolic content (TPC) microplate analysis. (A) Layout. (B) Software program. Please click here to view a larger version of this figure.
5. General conditions utilized for high-performance thin-layer chromatography analysis
- Standard curves
- Prepare stock solutions of quercetin and gallic acid (100 µg/mL each) as described above in section 3 and section 4.
- Apply gallic acid to six lanes at volumes of 2, 4, 6, 8, 10, and 12 µL.
- Apply 5 µL of gallic acid and quercetin individually to separate lanes for identification.
- Plate layout:
- Use a 10 × 20 cm silica gel 60 F₂₅₄ aluminum-backed TLC plate as the stationary phase.
- Set application parameters as follows: Y position 7.0 mm, band length 6.0 mm, first X position 14.0 mm, distance between tracks 9.4 mm.
- Apply 10 µL of each extract per band using nitrogen as the spraying gas.
- Set the solvent front distance to 70 mm.
- Plate development:
- Develop plates in a manual chamber containing 40 mL of mobile phase, and allow 10 min for chamber saturation using filter paper in contact with the mobile phase and the chamber wall to help the mobile phase's vapors saturate the chamber atmosphere.
- Develop plates using either MP1 or MP2, performing double development when indicated. Mobile Phase 1 (MP1), which is composed of ethyl acetate:formic acid:acetic acid:water (100:11:11:26); and MP2 made of toluene:ethyl acetate: formic acid (5:4:1).
NOTE: Develop HPTLC plates in a fume hood. Mobile phase components (ethyl acetate, toluene, formic acid, and acetic acid) are volatile, and toluene and ethyl acetate are highly flammable. Avoid inhalation of vapor and eliminate ignition sources. - Allow plates to dry at room temperature.
- Derivatization
- Spray plates with Folin–Ciocalteu reagent (300 µL of reagent + 600 µL of 50% ethanol), dry briefly with a heat gun, and spray with 1 mL of 10% sodium carbonate in 50% ethanol.
- Separately, spray other plates with 1% aluminum chloride in 50% ethanol.
- Heat plates uniformly with a heat gun until color development stabilizes and plates are completely dry.
6. Development for total flavonols and 5-hydroxyflavones content (TFHC) and total phenolic content (TPC) analysis by high performance thin-layer chromatography
- Apply samples in triplicate lanes along with gallic acid and quercetin reference lanes (for identification, as described in step 5.1.4).
- Develop a plate using MP1.
- Develop the plate again using MP2.
- Derivatize the plate using FC reagent as previously described.
- Photo-document the plate using white illumination, as well as 254 nm and 366 nm UV illumination.
- Repeat the procedure, replacing the final step for AlCl3 derivatization, as shown in Figure 4.
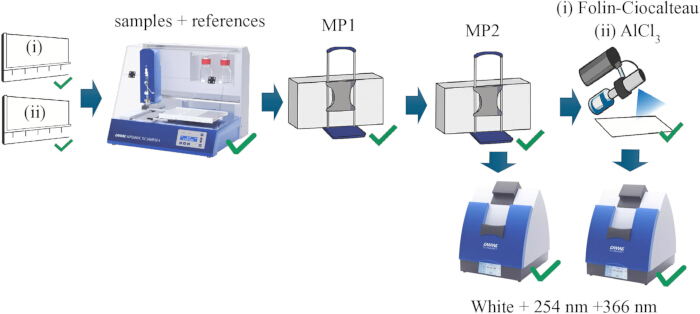
Figure 4: VisionCats steps for analysis of TPC and TFHC by HPTLC. Please click here to view a larger version of this figure.
Results
Extraction conditions
The general extraction protocol described here employs 60% ethanol, as previously reported22. When extrapolated to other vegetable sources, extraction conditions can be optimized in terms of the polarity of the solvent and the number of cycles. A comprehensive rationale for selecting both the solvent and the number of cycles has been detailed elsewhere16. Solvent selection may be guided by prior literature and polarity indices; in general, hydroalcoholic mixtures of ethanol or methanol, as well as acetone, are recommended. The optimal number of extraction cycles (n) can be evaluated by dividing a fixed total volume of 10 mL into 1–5 cycles of 10/n mL, followed by pooling the liquid extracts. The efficiency of different extraction cycle numbers is then statistically compared to identify the condition yielding the maximum absorbance in the TPC assay.
Microplate and HPTLC quantification
The standard calibration curves for both the microplate assay and the HPTLC analysis are presented in Figure 5. For total phenolic content (TPC) determination by the Folin–Ciocalteu microplate method and for HPTLC plates derivatized with the same reagent, calibration curves were established using gallic acid as the reference compound. Gallic acid was selected not only because it is one of the most commonly used standards for TPC quantification, but also because it can be eluted under the same mobile phase conditions applied to the lime and mandarin samples. Quercetin was also evaluated as a potential standard for the HPTLC assay; however, it proved unsuitable for this chromatographic system, as it co-eluted with the solvent front and could not be quantified reliably. Nevertheless, TFHC was determined using quercetin as the reference standard, since gallic acid does not form a colored complex with aluminum chloride, given that it is neither a flavonol nor a 5-hydroxyflavone.
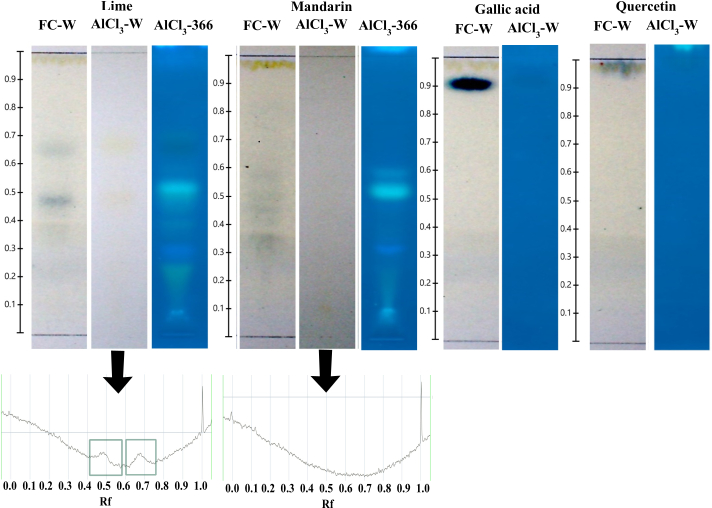
Figure 5: HPTLC plate of lime, mandarin, gallic acid, and quercetin developed sequentially with MP1 followed by MP2, and separately derivatized with aluminum chloride (AlCl₃) and Folin–Ciocalteu (FC) reagents. The chromatographic profile after AlCl₃ derivatization is shown. Abbreviations: FC, Folin–Ciocalteu derivatization; AlCl₃, aluminum chloride derivatization; W, white light illumination; 366, UV illumination at 366 nm. Please click here to view a larger version of this figure.
The results for total phenolic content (TPC) and total flavonoid and hydroxycinnamic acid content (TFHC) are presented in Table 3. As expected, TFHC values were significantly lower than TPC values, being approximately fivefold lower in lime samples and twelvefold lower in mandarin samples.
Table 3: Results for mandarin and lime total phenolic content by microplate method. Abbreviations: Abs: absorbance, CV: coefficient of variation, DF: Dilution factor, GAE: gallic acid equivalents, IR: Independent replicate, QE: quercetin equivalents, Rep: repetition, SD: standard deviation, TFHC: Total flavonols and 5-hydroxiflavone compounds, TPC: Total phenolic content, and  average . *Calculated based on dry matter. Please click here to download this Table.
Similarly, the results obtained from the HPTLC analysis are summarized in Table 4. Chromatographic separation enables the visualization of individual bands corresponding to distinct compounds. Four phenolic constituents were detected in lime samples and six in mandarin samples. None of these bands matched the retention factors of the reference standards employed (gallic acid and quercetin), which is consistent with expectations.
Table 4: Results for Total Phenolic Content and bands corresponding to AlCl3 revealed compounds by HPTLC derivatized with AlCl3. Please click here to download this Table.
Table 4 also reports the total phenolic content estimated from HPTLC analysis, calculated as the sum of the individual compounds detected chromatographically (analogous to TPC). Additionally, the table includes the cumulative content of the bands assigned to flavonols or 5-hydroxyflavans (Rf = 0.46 and 0.62 in lime; none detected in mandarin). These bands appeared yellow after derivatization with AlCl₃ and exhibited yellowish fluorescence under 366 nm UV illumination. However, no visible coloration was observed prior to derivatization, as shown in Figure 5.
For HPTLC analysis, Folin-Ciocalteu (FC) derivatization provides comprehensive detection of phenolic compounds, although minor interferences may occur. Also, aluminum chloride (AlCl₃) derivatization selectively stains a subset of flavonoids. The combined application of both reagents improves method standardization and mitigates some of the inherent limitations of either approach. Notably, it is improbable for a non-flavonoid compound to exhibit both the characteristic blue coloration under FC and the yellow–red absorbance under AlCl₃. Additionally, pre-existing chromophores can be excluded as interferences if visible with the same intensity prior to derivatization.
As shown in Figure 5, the lime extract exhibited two bands at Rf 0.62 and 0.46, which were not detectable on the undeveloped plate but became clearly visible after both Folin–Ciocalteu (FC) and AlCl₃ derivatization. This behavior supports their flavonoid nature, possibly corresponding to neoeriocitrin and hesperidin23. Additional phenolic constituents were observed at Rf 0.21 and 0.37 in lime, and at Rf 0.36, 0.39, 0.42, 0.46, 0.54, and 0.89 in mandarin. These bands were detectable after FC derivatization but not after AlCl₃ treatment, suggesting they may correspond to non-flavonoid phenolic compounds. According to the literature, major non-flavonoid phenolics reported in mandarin include chlorogenic acid and trans-ferulic acid24,25. In lime, other compounds previously described include coumaric acid and dihydroxyferulic acid23. Nevertheless, confirmation of these assignments requires analysis with additional reference standards.
HPTLC mobile phases comparison
Both mobile phases were developed as a modification of previously reported systems26,27,28. The more polar mobile phase (MP1, Figure 6A) provided superior separation of phenolic constituents compared to MP2. In contrast, the less polar mobile phase (MP2) (Figure 6B) enabled the simultaneous retention of both sample components and reference standards within the same chromatographic run. However, under MP2 conditions, the Rf values of the sample constituents were relatively low, with some compounds remaining close to the origin, as shown in Figure 6. To address this limitation, a double development procedure using MP1 followed by MP2 was implemented. This strategy ensured improved migration and resolution of the sample components while allowing quantification against gallic acid standards on the same plate under identical chromatographic conditions. Quercetin exhibited a faint yellow coloration before AlCl₃ treatment, which intensified after derivatization. For both lime and mandarin extracts, two distinct bands were observed in addition to a band remaining at the origin. Furthermore, a yellow band with an Rf value of 0.14 became clearly visible after AlCl₃ derivatization.
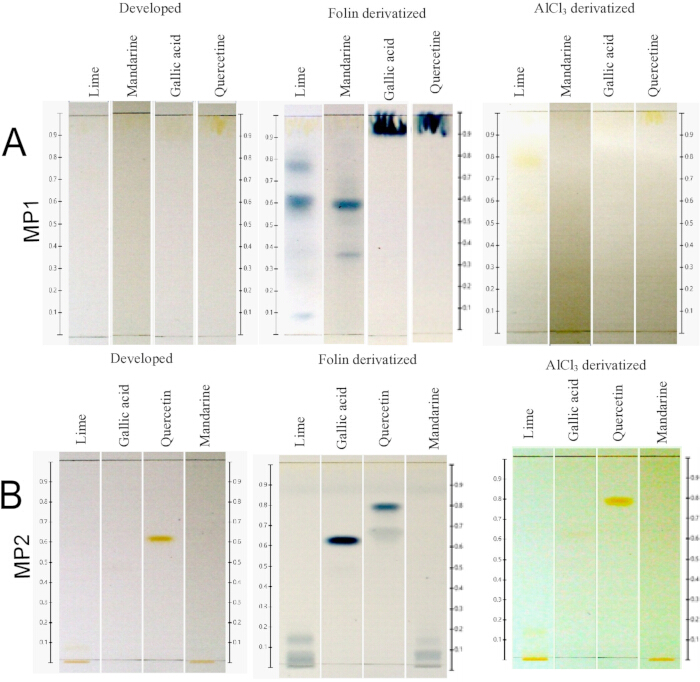
Figure 6: HPTLC plates of lime, mandarin, gallic acid, and quercetin developed with mobile phase 1 (A) and mobile phase 2 (B). For each plate, the tracks from left to right correspond to: developed (non-derivatized), Folin–Ciocalteu derivatized, and AlCl₃ derivatized samples. Visualization was performed under white light illumination. Please click here to view a larger version of this figure.
Discussion
Sample collection and storage are critical steps in ensuring the integrity of phytochemical analyses. After collecting, samples should be transported under refrigerated conditions and freeze-dried as soon as possible to minimize degradation. While dried biological materials are generally stable, extracts in solution are considerably more labile, even when stored under refrigeration. Therefore, analytical determinations are preferably performed on freshly prepared extracts. Prolonged storage, even for a few days under cold and light-protected conditions, or for a few hours at room temperature, can lead to observable changes in chromatographic profiles, including alterations in band intensity and the formation of precipitates. These changes are typically associated with chemical transformations such as oxidation, hydrolysis, or complexation reactions. Consequently, all reagents and extracts should be stored and handled under cold and dark conditions to preserve their chemical stability.
When comparing both techniques (Table 3 and Table 4), systematic quantitative differences are evident. In both lime and mandarin, TPC values obtained by the microplate assay were approximately three times higher than those estimated by HPTLC. In lime, TPC was 74.2 mmol/g by microplate versus 22.0 mmol/g DM by HPTLC, while TFHC values were 15.5 mmol/g and 13.4 mmol/g, respectively. In mandarin, TPC reached 72.8 mmol/g by microplate compared to 20.8 mmol/g by HPTLC. For TFHC, the microplate method yielded 6.0 mmol/g, whereas no corresponding bands were detected by HPTLC.
These discrepancies can be explained by the intrinsic limitations and response mechanisms of each method. The Folin–Ciocalteu (FC) assay is known to react not only with phenolic compounds but also with various non-phenolic reducing substances, including ascorbic acid, tyrosine, formic acid, and acetic acid29, as well as other low-molecular-weight reductants. Such compounds contribute to the overall spectrophotometric signal, potentially leading to an overestimation of TPC. Additionally, minor phenolic constituents may collectively increase total absorbance in the microplate assay, even if their individual concentrations are too low to produce distinct, quantifiable bands in HPTLC. Some small or highly polar metabolites may also fail to be retained, resolved, or visualized under the chromatographic conditions employed.
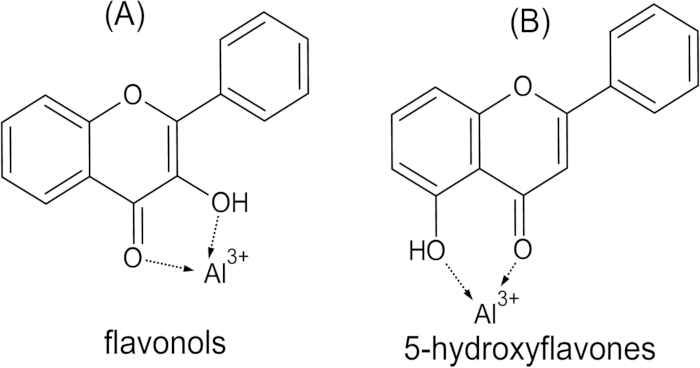
Figure 7: Schematic representation of AlCl₃ complexes formed with flavonols and 5-hydroxyflavones. (A) Flavonols and (B) 5-hydroxyflavones. Please click here to view a larger version of this figure.
Methodological differences in detection chemistry further contribute to the observed variations. The FC reaction produces a substantial increase in absorbance due to the reduction of the reagent, resulting in high analytical sensitivity. In contrast, the AlCl₃ method is relatively non-specific and relies on complex formation with certain flavonoids. Flavonols typically exhibit maximum absorption around 410 nm, whereas 5-hydroxyflavones absorb near 440 nm18, and their complexes with Al3⁺ are illustrated in Figure 7. However, the increase in absorbance following complexation is comparatively modest, making the AlCl₃ assay more susceptible to interference from colored matrix components, including flavonoids themselves.
Despite these limitations, the combined use of FC and AlCl₃ derivatization in HPTLC represents a powerful complementary strategy for phenolic analysis. This approach couples the high sensitivity of the FC reaction with the structural discrimination provided by AlCl₃ complexation and chromatographic separation. Moreover, several flavonols are known to exhibit characteristic yellowish bands under UV illumination30, further supporting compound classification and confirmation.
Microplate methods are particularly advantageous for high-throughput screening. They require minimal sample preparation, low reagent consumption, and enable the simultaneous analysis of dozens of samples. Under typical laboratory conditions, a complete microplate assay can be performed in approximately 4 h using widely available instrumentation. These characteristics make microplate assays highly suitable for rapid comparative studies, routine quality control, and the preliminary evaluation of large sample sets. In contrast, HPTLC is more time- and labor-intensive, with a complete analytical workflow typically requiring 7–8 h. It also relies on specialized instrumentation that may not be available in all laboratories, and the use of dedicated plates and derivatization reagents increases the per-analysis cost. Another limitation is that metabolites present at very low concentrations may remain undetectable under standard visualization conditions. However, these practical and sensitivity-related limitations are offset by the key advantage of chromatographic separation30,31. HPTLC enables the resolution of individual constituents in complex plant matrices, confirmation of genuine assay responses, and detection of potential interfering compounds. Moreover, selective post-chromatographic derivatization allows straightforward classification of compounds into functional groups (e.g., flavonols and 5-hydroxyflavones), enhancing chemical interpretation beyond total content estimation.
Accordingly, in large-scale studies, the analytical workflow may begin with microplate assays to rapidly identify samples with elevated levels of target compounds. Selected samples can then be subjected to HPTLC analysis to visualize individual constituents, assess selectivity, and evaluate possible interferences through dual derivatization. This integrated strategy (illustrated in Figure 8) combines speed and throughput with chemical specificity and structural insight.
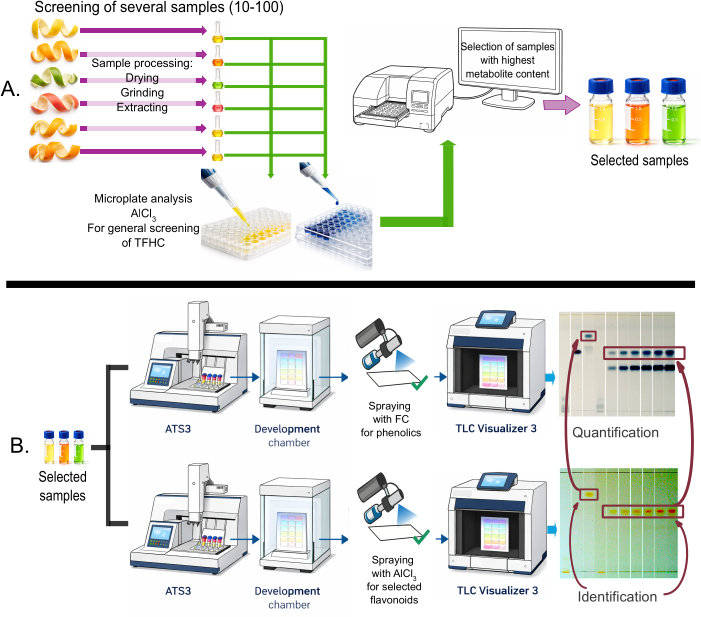
Figure 8: Proposed workflow for sample screening and analysis. (A) High-throughput microplate screening of a large batch of samples. (B) HPTLC analysis of selected samples for quantification using the Folin–Ciocalteu method and for identification of flavonols and 5-hydroxyflavones through AlCl₃ derivatization. Please click here to view a larger version of this figure.
Compared to HPTLC, HPLC coupled to high-resolution mass spectrometry (HPLC–HRMS)—the most common alternative reported in the literature—offers unmatched sensitivity and unambiguous structural identification of individual compounds32. Nevertheless, HPLC–HRMS analyses are inherently slower, as each chromatographic run must be performed sequentially, and they involve substantially higher costs associated with instrumentation, solvent purity requirements, and solvent consumption. Furthermore, functional-class screening often requires complex data processing and compound-specific interpretation, whereas HPTLC enables direct visual grouping of compounds after derivatization. Consequently, HPTLC represents an effective intermediate platform between rapid microplate screening and comprehensive HPLC–MS analysis, balancing throughput, cost, and chemical selectivity.
Flavonoid and phenolic analysis has wide-ranging applications across food science, nutraceuticals, pharmaceuticals, agriculture, and materials research. In food science, it is used to evaluate antioxidant capacity, authenticity, shelf life, and quality control of products such as juices, wines, and teas, as well as to support agronomical studies, including the determination of optimal harvest time based on phenolic maturity33. In the nutraceutical sector, phenolic profiling is essential for the standardization and quality assurance of botanical extracts and commercial products such as green tea extract capsules, grape seed extract supplements, quercetin tablets, and citrus bioflavonoid formulations. In pharmaceutical and biomedical research, these analyses support the screening of bioactive compounds with antioxidant, anti-inflammatory, and antimicrobial potential6. In agriculture and plant physiology, phenolic determination helps evaluate plant stress responses and guide crop improvement strategies. Additionally, in materials science—particularly in studies of plant-derived corrosion inhibitors34,35—phenolic characterization aids in correlating chemical composition with adsorption behavior and protective efficiency.
Disclosures
The authors disclose no conflicts of interest.
Acknowledgements
We acknowledge the Vice-rectorate of Extension for kindly providing video-recording support, particularly to Vice-Rector Yolanda Pérez-Carrillo, and videographer Natalia Silva-Maffio. We gratefully acknowledge the “Fund to Support the Dissemination of Knowledge Generated at UNA” from the Vice-President for Research for supporting publication costs.
Materials
| Name | Company | Catalog Number | Comments |
|---|---|---|---|
| 1.5 mL eppendorf tubes | Eppendorf | ||
| 10 mL volumetric flasks | Eisco Labs | CH0451B | 10/19 Polypropylene Stopper, Borosilicate Glass, Amber - White Graduation Mark, Tolerance ±0.025 ml |
| 100 µL and 1000 µL micropippette tips | generic | ||
| 100–1000 µL micropipette | Eppendorf | Research Plus | |
| 10–100 µL micropipette | Eppendorf | Research Plus | |
| 15 mL capped glass tubes | generic | ||
| 50 mL beakers | generic | ||
| 8-channel multichannel micropippette | ThermoSciecntific | ||
| 96-wells microplates | Greiner | 655891 | Polycicloolefin, glass bottom, black |
| Analytical balance | ±0.0001 g | ||
| Automatic TLC Sampler | CAMAG | ATS4 | |
| Centrifuge | ThermoSciecntific | Sorvall ST8R | ≥850 × g |
| Filter paper | Whatman | For chamber saturation | |
| Freeze-dryer | LABCONCO | Model 10 | |
| Plastic reagent reservoirs | Eppendorf | ||
| Spatula with Flat End and Spoon End | Merck chemicals | HS15906 | |
| Synergy HT Multi-Detection Microplate Reader | BioTek Instruments | Synergy HT | |
| TLC silica gel 60 F254 aluminum-backed plates (10 × 20 cm) | Merck | ||
| TLC sprayer | Sigma-Aldrich | 20 mL | |
| TLC Visualizer | CAMAG | 2 | |
| Ultrasonic bath/cleaner | Creworks | ZX-040 | with temperature control at 40 °C |
| UV Lamb | UPV | UVGL-58 | |
| VisionCATS software | CAMAG | ||
| Zip-lock bags | Generic | 1/4 quarter of gallon |
References
- Kang, H. J., Chawla, S. P., Jo, C., Kwon, J. H., Byun, M. W. Studies on the development of functional powder from citrus peel. Bioresour Technol. 97 (4), 614-620 (2006).
- Furukawa, Y., et al. Isolation and characterization of neuroprotective components from citrus peel and their application as functional food. Chem Pharm Bull. 69 (1), 2-10 (2021).
- Kim, S. S., Lee, J. A., Kim, J. Y., Lee, N. H., Hyun, C. G. Citrus peel wastes as functional materials for cosmeceuticals. J Appl Biol Chem. 51 (1), 7-12 (2008).
- Shyu, Y. S., Lu, T. C., Lin, C. C. Functional analysis of unfermented and fermented citrus peels and physical properties of citrus peel-added doughs for bread making. J Food Sci Technol. 51 (12), 3803-3811 (2014).
- Hasnat, H., et al. Flavonoids: A treasure house of prospective pharmacological potentials. Heliyon. 10 (6), e27533(2024).
- Albuquerque, B. R., Heleno, S. A., Oliveira, M. B. P. P., Barros, L., Ferreira, I. C. F. R. Phenolic compounds: Current industrial applications, limitations and future challenges. Food Funct. 12 (1), 14-29 (2021).
- Khoddami, A., Wilkes, M., Roberts, T. Techniques for analysis of plant phenolic compounds. Molecules. 18 (2), 2328-2375 (2013).
- Kupina, S., Fields, C., Roman, M. C., Brunelle, S. L. Determination of total phenolic content using the Folin-C assay: Single-laboratory validation, first action 2017.13. J AOAC Int. 102 (1), 320-321 (2019).
- Matić, P., Sabljić, M., Jakobek, L. Validation of spectrophotometric methods for the determination of total polyphenol and total flavonoid content. J AOAC Int. 100 (6), 1795-1803 (2017).
- Folin, O., Ciocalteu, V. On tyrosine and tryptophane determinations in proteins. J Biol Chem. 73 (2), 627-650 (1927).
- Folin, O., Denis, W. On phosphotungstic-phosphomolybdic compounds as color reagents. J Biol Chem. 12 (2), 239-243 (1912).
- Lamuela-Raventós, R. M. Folin-Ciocalteu Method for the Measurement of Total Phenolic Content and Antioxidant Capacity. Measurement of Antioxidant Activity & Capacity. , John Wiley & Sons. (2017).
- Christ, B., Müller, K. H. Zur serienmäßigen bestimmung des gehaltes an flavonol-derivaten in drogen. Arch Pharm. 293 (12), 1033-1042 (1960).
- Carter, J. A., Barros, A. I., Nóbrega, J. A., Donati, G. L. Traditional calibration methods in atomic spectrometry and new calibration strategies for inductively coupled plasma mass spectrometry. Front Chem. 6, 504(2018).
- Appel, H. M., Govenor, H. L., D’Ascenzo, M., Siska, E., Schultz, J. C. Limitations of Folin assays of foliar phenolics in ecological studies. J Chem Ecol. 27 (4), 761-778 (2001).
- Cubero-Román, E., Carvajal-Miranda, Y., Rodríguez, G., Álvarez-Valverde, V., Jiménez-Bonilla, P. Antioxidant and antimicrobial activity of two Costa Rican cultivars of ber (Ziziphus mauritiana): An underexploited crop in the American tropic. Food Sci Nutr. 11 (6), 3320-3328 (2023).
- Shraim, A. M., Ahmed, T. A., Rahman, M. M., Hijji, Y. M. Determination of total flavonoid content by aluminum chloride assay: A critical evaluation. LWT. 150, 111932(2021).
- Mammen, D., Daniel, M. A critical evaluation on the reliability of two aluminum chloride chelation methods for quantification of flavonoids. Food Chem. 135 (3), 1365-1368 (2012).
- Salih, A. M., et al. Optimization method for phenolic compounds extraction from medicinal plant (Juniperus procera) and phytochemicals screening. Molecules. 26 (24), 7454(2021).
- Loescher, C. M., Morton, D. W., Razic, S., Agatonovic-Kustrin, S. High performance thin layer chromatography (HPTLC) and high performance liquid chromatography (HPLC) for the qualitative and quantitative analysis of Calendula officinalis–Advantages and limitations. J Pharm Biomed Anal. 98, 52-59 (2014).
- Attimarad, M., Mueen Ahmed, K. K., Aldhubaib, B. E., Harsha, S. High-performance thin layer chromatography: A powerful analytical technique in pharmaceutical drug discovery. Pharm Methods. 2 (2), 71-75 (2011).
- Dellapina, G., et al. Flavonoid-rich extracts from lemon and orange by-products: Microencapsulation and application in functional cookies. Foods. 14 (19), 3346(2025).
- Sanches, V. L., et al. Comprehensive analysis of phenolics compounds in citrus fruits peels by UPLC-PDA and UPLC-Q/TOF MS using a fused-core column. Food Chem X. 14, 100262(2022).
- Kaur, S., Singh, V., Chopra, H. K., Panesar, P. S. Extraction and characterization of phenolic compounds from mandarin peels using conventional and green techniques: A comparative study. Discover Food. 4 (1), 60(2024).
- Quispe-Fuentes, I., Uribe, E., López, J., Contreras, D., Poblete, J. A study of dried mandarin (Clementina orogrande) peel applying supercritical carbon dioxide using co-solvent: Influence on oil extraction, phenolic compounds, and antioxidant activity. J Food Process Preserv. 46 (1), e16116(2022).
- Tatkare, P. C., Jadhav, A. P. Development and validation of a novel high-performance thin-layer chromatography method for the quantitative estimation of neohesperidin from Citrus aurantium peel extract. JPC J Planar Chromatogr Mod TLC. 35 (6), 579-584 (2022).
- Wagner, H., Bladt, S. Plant Drug Analysis. , Springer Berlin Heidelberg. Berlin. (1996).
- Apraj, V., et al. Pharmacognostic and phytochemical evaluation of Citrus aurantifolia (Christm) Swingle peel. Pharmacogn J. 3 (26), 70-76 (2011).
- Bastola, K. P., Guragain, Y. N., Bhadriraju, V., Vadlani, P. V. Evaluation of standards and interfering compounds in the determination of phenolics by Folin-Ciocalteu assay method for effective bioprocessing of biomass. Am J Anal Chem. 8 (6), 416-431 (2017).
- Sultana, S., et al. Investigating flavonoids by HPTLC analysis using aluminium chloride as derivatization reagent. Molecules. 29 (21), 5161(2024).
- Pawar, K. N., Kadam, S. P., Redasani, V. K. A systematic review on high performance thin layer chromatography (HPTLC). Int J Pharm Res Appl. 10 (3), 402-416 (2025).
- Saftić Martinović, L., Barbarić, L., Gobin, I. Qualitative and quantitative mass spectrometry approaches for the analysis of phenolic compounds in complex natural matrices. Appl Sci. 15 (23), 12529(2025).
- de Araújo, F. F., de Paulo Farias, D., Neri-Numa, I. A., Pastore, G. M. Polyphenols and their applications: An approach in food chemistry and innovation potential. Food Chem. 338, 127535(2021).
- Castro-Castro, V., Jiménez-Bonilla, P., Álvarez-Valverde, V., Rodríguez-Yáñez, J. Pichichio extracts (Solanum mammosum) as a corrosion inhibitor of low carbon steel in an acidic environment. Pure Appl Chem. 98 (2), 283-300 (2026).
- Evaluation of natural products as corrosion inhibitors: Pinus caribaea and Pachira quinata bark extracts on steel. Villalobos-Ugalde, A., Piedra-Marín, G., Rodríguez-Yañez, J., Álvarez-Valverde, V., Jiménez-Bonilla, P., Soto-Fallas, R. M. 6th IEEE International Conference on BioInspired Processing (BIP 2024), , (1109).
Reprints and Permissions
This article has been published
Video Coming Soon