The current study investigates several machine learning algorithms on a Saudi Arabian dataset for asthma detection. In contrast to state-of-the-art approaches that employ machine learning on clinical datasets for asthma diagnostics, the proposed scheme achieves better performance, with a 3.9% improvement in diagnosis accuracy.
A subscription to JoVE is required to view this content. Sign in or start your free trial.
Research Article
A Computational Intelligence-based Early Diagnosis of Asthma Disease: A Saudi Arabian Case Study
In This Article
Summary
Abstract
According to research, an increase in chronic diseases, including asthma, has been identified. The number of asthma patients in Saudi Arabia is a cause for concern due to the weather conditions and lifestyle, especially in the post-pandemic era. It demands a solution to reduce infections by developing an intelligent system to detect asthma at an early stage, thereby preventing the disease or enabling early treatment. In this study, machine learning has been utilized to develop tools to track asthma symptoms at an early stage. Although there have been various prior attempts to apply machine learning to predict the occurrence of asthma. Nevertheless, focusing on the identification of the disease at the pre-symptom stage, particularly in the Saudi Arabian context, is a relatively neglected area. The dataset for the current study was obtained from King Fahad University Hospital, Dammam, Saudi Arabia, and included standard tests performed on patients, including blood tests, viral tests, and biochemistry tests. The dataset contains 17 significant attributes and includes information for 328 asthma patients: 165 are positive, and 163 are negative. The methods selected for application here are random forests (RF), artificial neural networks (ANN), support vector machines (SVM), and naive Bayes (NB). Each of these methods has been chosen based on its distinctive features. The experimental outcome revealed that the RF, SVM, and ANN approaches yielded 94%, which is the highest accuracy and improved upon the state of the art by 3.9%. It is worth noting that nine of the seventeen possible features were used to achieve the above accuracy. Despite RF, SVM, and ANN achieving the same accuracy, ANN has a higher error cost. Therefore, RF and SVM are superior based on the pattern of results, and hence they are suggested for this problem.
Introduction
After conducting extensive research, the researchers observed that chronic diseases have become increasingly common1. Asthma is a chronic inflammatory disease of the airways characterized by recurrent episodes of breathlessness and wheezing. The prevalence of asthma varies globally, ranging from 1–20% for both children and adults, affecting millions of people worldwide2. These large-scale changes are related to environmental variations, including those in various countries, as well as the use of different assessment instruments and diverse epidemiologic definitions of asthma. Asthma has a relatively low fatality rate in contrast to several other well-known chronic diseases2. However, reports state that the asthma pattern in the Kingdom of Saudi Arabia is increasing3,4.
Asthma is a chronic inflammatory condition that results in narrowed lumen. The narrowing of the aviation route is brought about by the expansion of bodily fluid emission, as well as bronchial divider thickening due to edema, subepithelial fibrosis, and smooth muscle hypertrophy. Pathophysiological apparatuses driven by various cell types, including immune cells, have been utilized to assess these conditions5. Due to severe weather conditions and mainly an indoor living lifestyle in Saudi Arabia, asthma is among the most widespread chronic diseases. Several surveys have demonstrated the overwhelming rate of asthma6. The disease has become a significant issue, requiring an early response system to help mitigate the number of incidents and make it feasible for early mediation in forestalling or curing the disease at an earlier stage.
In contrast to individuals, asthma has a profound impact on communities and families. If not controlled, it imposes harsh limitations on the patient's life and prevents them from engaging in many daily activities. In Saudi Arabia, harsh weather conditions, including a hot atmosphere, widespread sandstorms, and excessive use of indoor air conditioning/cooling systems, are significant contributors to asthma. The Saudi thoracic society (STS) has made noticeable efforts to provide the best medications for respiratory infections7. However, a proactive diagnosis of asthma is needed to reduce the infection rate, especially in a post-pandemic (COVID-19) scenario. It was further deduced that family history, smoking, and allergic rhinitis are among the most significant risk factors for developing asthma among Saudi adults. Additional research was recommended to investigate other factors that set the basis for the study.
In this research, considering previous studies on asthma diagnosis, the aim is to enhance diagnostic accuracy. The proposed techniques, including random forest (RF), artificial neural network (ANN), support vector machine (SVM), and naive Bayes (NB), have been utilized in earlier studies, yielding noticeable improvements in diagnosis results. For example, researchers have used ANN, SVM, and NB in studies8,9,10. In the current study, machine learning approaches have been investigated to assist as an early warning system that detects even the small indicators of asthma disease at the earliest stages (pre-symptomatic stage). The prevalence of asthma disease in Saudi Arabia, especially in the post-pandemic era, with factors like an indoor-oriented lifestyle due to severe weather conditions, air conditioning ducts, and sandstorms are among the major factors. However, there is no noteworthy study investigating the crucial factors that have been witnessed in the recent past. To address this research gap, the current study aims to investigate the role of machine learning in the early detection of asthma among Saudi adults. Furthermore, the primary objective is to achieve the highest possible accuracy with the fewest features. Although there have been recognizable efforts in the past to utilize machine learning to predict the presence of asthma disease8,9,10. The current study aims to utilize a Saudi Arabian dataset, obtained from a public sector hospital in the eastern province for the first time, focusing on diagnosing the disease at an early stage (preemptive diagnosis). Machine learning (ML) is recognized as a method for extracting knowledge from collected data11,12. It provides prediction accuracy obtained from the learning process of earlier instances by using various machine learning techniques. ML encompasses multiple methods, algorithms, and strategies to address analytical and predictive problems in broad medical fields, such as early detection of disease existence13,14.
Several studies have been conducted to predict asthma disease using various techniques. Researchers developed an artificial neural network (ANN) for asthma classification depending on the dynamic and static patient tests8. The measured parameters of spirometry, impulse oscillometry (IOS), auscultation, allergy results, and information on symptoms are utilized in the ANN. The defined information enables the ANN to suggest the appropriate asthma classification. Likewise, researchers conducted a study to address the challenges in diagnosing chest diseases7. Support vector machines (SVM) and the adaptive SVM (ASVM) methods were used to diagnose chest diseases such as asthma. The best classification accuracy for all chest diseases was obtained utilizing the ASVM method. The researchers used several neural network structures, such as multi-layer NN (MLNN) with backpropagation algorithm (BPA) with one and two hidden layers, probabilistic NN (PNN), learning vector quantization (LVQ), and general regression NN (GRNN), for chest disease diagnosis, including asthma disease15. Additionally, some conducted a comparative study aimed at diagnosing chest diseases using an artificial immune system (AIS). The mentioned studies have implemented various structures for diagnosing chest disease problems using their different datasets. For asthma, the highest result was achieved using AIS with an overall accuracy of 90.91%16. Moreover, researchers investigated the efficacy of a deep NN (DNN) for improving accuracy in asthma diagnosis and compared the prediction performance of different machine learning algorithms, particularly with logistic regression and SVM. The study showed that the empirical test utilizing the model of asthma signs was more effective for the accurate diagnosis of asthma9. Another study demonstrated the significant capability of machine learning utilizing tele-monitoring data to predict asthma exacerbations before they occur through chosen machine learning approaches such as SVM and Naïve Bayes to implement their experiment10.
Other than that, researchers employed several machine learning techniques to preemptively diagnose Alzheimer's disease (AD), including SVM, k-NN, adaptive boosting (AdaBoost), and eXtreme gradient boosting (XGBoost)17. Researchers conducted a study to preliminarily diagnose diabetes as well, by investigating four machine learning approaches, namely NB, SVM, K-NN, and ANN. The top three features of the Saudi Arabian dataset exhibited the highest average accuracy of 68%. The performance of the measuring techniques was compared based on accuracy, precision, recall, and F1-score. The ANN obtained the highest classification accuracy of 77.5%18. Likewise, the same group of researchers experimented with the performance of four classification techniques— namely, NB, SVM, K-NN, and ANN— to preemptively diagnose chronic kidney disease, applied to the Saudi Arabian dataset19. Moreover, the authors conducted a study to primitively diagnose thyroid cancer using four machine learning techniques: ANN, SVM, RF, and NB. Utilizing 14 features of the Saudi Arabian dataset, the authors obtained the highest average accuracy of 95%. The performance of measuring techniques was compared using accuracy, precision, recall, and F1-score. The RF obtained the highest classification accuracy of 90.91%20. The researchers also conducted two studies that yielded remarkable results in the proactive diagnosis of rheumatoid arthritis. Several machine learning techniques, such as SVM, logistic regression (LR), and AdaBoost, were shortlisted and used as candidate techniques for a voting ensemble. Initially, one data set was used, and the other was balanced by applying SMOTE. The novel voting ensemble technique was tested by two sequential feature selection methods. Namely, forward and backwards selection are used to find the best subset of the feature space that presents the highest indicators for each technique. Using 30 features of the original data and the sequential forward feature selection technique, the obtained percentages were promising, with accuracy, recall, and precision values of 94.03%, 96%, and 93.51%, respectively21. Similarly, other intelligent methods in medicine and related fields can be found in many studies22,23,24,25,26.
The proposed techniques in this work are RF, SVM, ANN, and NB due to their outstanding results for similar problems. In the current study, the results obtained through the experiments. After various optimization steps and feature selection, it is demonstrated that the proposed techniques are promising for asthma diagnosis with the targeted dataset.
Access restricted. Please log in or start a trial to view this content.
Protocol
This section describes the machine learning algorithms investigated in the proposed asthma diagnostics approach. The criteria and reasons behind the selection of the proposed method are based on a comprehensive literature review and a long history of dealing with preemptive diagnosis of several chronic diseases27,28,29,30,31. These algorithms produced promising results. All the materials and tools used in this study are listed in the Table of Materials.
Support vector machines (SVM)
The SVM algorithm is among the most successful algorithms in pattern recognition and classification32. It uses binary classification, where it classifies a training set of vectors into two classes. It belongs to the family of supervised learning algorithms, where the desired output is generated under supervision32. In comparison with other classification algorithms in machine learning, SVM provides better results for classification performance. Therefore, it has been used extensively in numerous applications such as speech, face, and handwriting recognition. Furthermore, SVM has also been applied in various areas, including disease prediction and stock prediction. Additionally, due to its insensitivity to noise or overfitting, SVM can handle unbalanced data, which is a typical case in medical diagnostics, where positive cases are fewer in number than negative cases32.
In classification, SVM separates two classes by drawing a decision border, in which it can forecast the labels by distinguishing one or more feature vectors32. The decision boundary is referred to as the hyperplane, which is the farthest from the closest data points of each class. Those data points are referred to as support vectors. Figure 1 shows some candidate hyperplanes in linearly separable data. Equation 1 demonstrates the hyperplane equation, while equations 2 and 3 show the elements located above and below the plane32:
 hyperplane equation (1)
Here, w is a vector representing weight, x is a vector representing the input, and b. represents a potential bias.
 For all j, such that
  = +1 (2)
 For all i, such that = -1 (3)
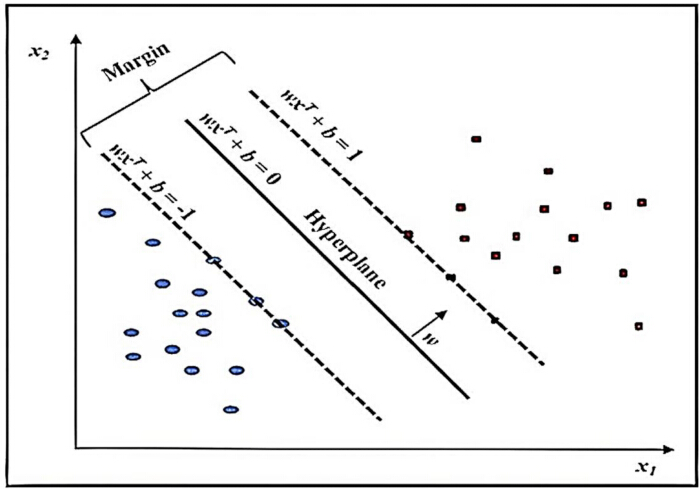
Figure 1: A typical SVM with two separable classes. This figure visualizes a typical SVM with two separable classes. Abbreviations; SVM = support vector machine. Please click here to view a larger version of this figure.
Artificial neural network (ANN)
ANN is a computational intelligence technique in soft computing that mimics the functionality of the human brain system. It has a vast number of interconnected neurons33. It is among the supervised machine learning algorithms that can learn from example datasets and improve their performance through learning, generating useful outputs33. ANN's architecture comprises multiple layers: an input layer, a hidden layer, and an output layer. Each of them is formed by a set of connected neurons33.
The neuron that receives the data from outside performs some processing and then sends the data to another layer known as the input layer. The purpose of the input layer is not to perform any complex process on the data; it is simply to duplicate the input value and send it to the next layer33. The output layer contains neurons that produce data for the user program. Between these two layers, the hidden layer is located as an optional layer to perform computational processes. The hidden layer serves as an intermediate layer that receives inputs from the input neurons, performs mathematical operations on them, and then passes the results to another layer33. Figure 2 shows the ANN architecture.
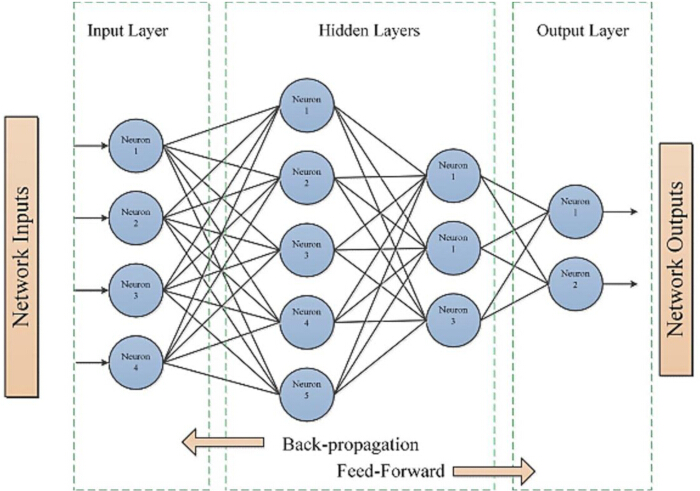
Figure 2: Feed-forward and backpropagation in a typical ANN structure. This figure visualizes a feed-forward network with backpropagation in a typical ANN structure. Abbreviations; ANN = artificial neural network. Please click here to view a larger version of this figure.
The feed-forward NN is an approach that stores input data in a forward direction. On the opposite direction, the back-propagation process occurs as the neural network weights update in a backward approach to obtain the gradients, using a neural network with several hidden layers. The drawback of this process is the vanishing or exploding of gradients. The activation function maintains the nonlinear characteristics of their ANN, which enables it to learn detailed relations between input and output data, as declared a universal approximation. Figure 3 demonstrates the main architecture of the artificial neural network. It also illustrates the activation function applied to every neuron's output, which represents the sum of all input weights. The bias holds the sum of all weights and is included in the neuron input33.
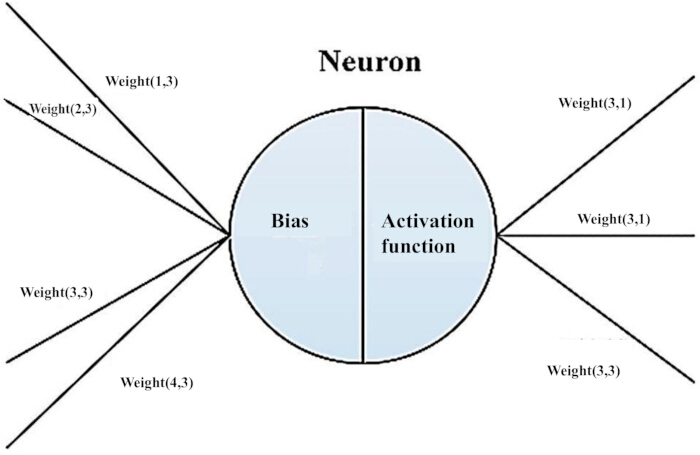
Figure 3: A typical single perceptron neuron for an ANN. This figure depicts a single perceptron neuron of a typical ANN. Abbreviations; ANN = artificial neural network. Please click here to view a larger version of this figure.
Random forest (RF)
RF is among the prominent classification algorithms in machine learning. It consists of several individual Decision Trees working together as an ensemble and producing the final output29. The basic concept behind the successful performance of the RF is that it is made up of many moderately uncorrelated trees (forming a forest), which act as a committee. Thus, they will be more efficient than all models that run independently34. The RF algorithm was primarily developed by a group of researchers35. To better understand how RF works, it is essential to understand decision trees35. It is equally applicable to both discrete and continuous problems, specifically classification, detection, and regression, respectively36. The more trees in the forest, the closer to accuracy the result will be, but with an added computational complexity36, as depicted in Figure 4.
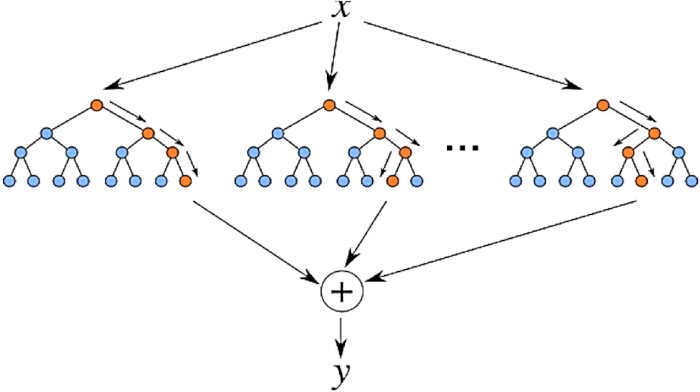
Figure 4: Random Forest schematic. This figure demonstrates a schematic of a typical random forest. Please click here to view a larger version of this figure.
Naive Bayes (NB)
Naïve Bayes (NB) is a classification algorithm that employs the Bayes theorem to classify objects. It is a very popular method applied in most medical fields, especially for diagnosing symptoms. In this method, objects are taking the principal independence assumptions, which makes the relation between the attributes independent of each other. Due to its naïve nature, it is among the simplest classification algorithms in machine learning37. Based on the given dataset, NB determines the likelihood of a particular output. The NB model is simple to develop, can manage substantial data, and is a sophisticated and computationally light algorithm. Additionally, it delivers modest functions, resulting in numeric and nominal knowledge. Robustness and simple learning interpretations are also the potential advantages of the NB classifier. If it is employed on a limited amount of data, it will result in a relatively inaccurate outcome. It depends on enormous records, which are considered less precise compared to other techniques37.
Statistical analysis
Statistical analysis of the dataset helps visualize and understand the pattern of the dataset for better data pre-processing and modeling. In this regard, the following steps were carried out. Firstly, to investigate if the demographic features are imbalanced between positive and negative groups, including age and gender, a statistical analysis is performed on SPSS software. Secondly, compile the quantitative data using an independent sample t-test if the normal distribution and homogeneity of variance were satisfied, or the Man-Whitney U test. Finally, the categorical data has been compiled using chi-squared test or Fisher’s exact test38.
Implementation
Dataset description
The dataset for the current study was obtained from King Fahad University Hospital in Dammam, Saudi Arabia, following approval by the institutional review board (IRB). The said data was collected according to standard tests among the patients. asthma is often diagnosed through standard tests among patients, including blood tests, virus tests, and biochemistry tests. For the current study, the patients and healthy controls (HC) were recruited and clinically evaluated based on the standard triage and pathological tests conducted at the hospital under the recommendations of physicians in the department. The clinical inclusion and exclusion criteria were defined by the doctors based on the laboratory results. Subsequently, the qualified and verified data were provided for the study. The dataset contains seventeen attributes, as they are available for all asthma patients. The dataset includes 328 total instances with 165 asthma-positive and 163 asthma-negative instances. The distribution of gender and age in the positive and negative groups is listed in Table 1.
| Instances | Positive | Negative | |
| Male | 145 | 107 | 38 |
| Female | 183 | 57 | 126 |
| Total | 328 | 164 | 164 |
Table 1: Dataset gender distribution. This table shows the gender distribution in the dataset.
Table 2 shows the age distribution between the two classes.
| Age Range | Age Distribution (Class = 1) | Age Distribution (Class = 0) |
| 1–10 | 0.059113 | 0 |
| 11–20 | 0.113301 | 0.060869 |
| 21–30 | 0.083743 | 0.177947 |
| 31–40 | 0.157632 | 0.164912 |
| 41–50 | 0.17734 | 0.164912 |
| 51–60 | 0.197044 | 0.099566 |
| 61–70 | 0.108374 | 0.047619 |
| 71–80 | 0.078817 | 0.025974 |
| 81–90 | 0.019704 | 0.012987 |
| 91–100 | 0.004926 | 0.012987 |
Table 2: Dataset age distribution. This table shows the age distribution in the dataset.
The age (p < 0.001 in Man-Whitney U test) and gender (p < 0.001 in the Chi-squared test) were unbalanced between the positive and negative groups. However, there is no bias in the recruitment process. It is believed that the unbalanced distribution may reflect the unique age distribution of this patient cohort. Inclusion criteria include clinical factors for the disease presence and absence; demographics, including gender, age, and local population, are considered. Moreover, the data was collected under informed consent. Age and gender are included as potential features in the feature set, as mentioned below. However, explicit age and gender based analyses are not in the scope of the study and left as future work.
The dataset is stored as numeric values. The "Class" column contains the values 0 and 1, where 0 represents the "Normal patient" and 1 represents the "Asthma patient".
In this regard, the following seventeen attributes were used:
Class: (0 = “Normal”, 1 = “Asthma Patient”)
1. age in years (AGE)
2. gender (1 = male, 0 = female): GENDER
3. Basophils (BASO)
4. Eosinophils (EOS)
5. Hematocrit (HCT)
6. Haemoglobin (HGB)
7. Lymphocytes (LYM)
8. Mean corpuscular haemoglobin (MCH)
9. Mean corpuscular haemoglobin concentration (MCHC)
10. Mean corpuscular volume (MCV)
11. Monocytes (MONO)
12. Mean platelet volume (MPV)
13. Neutrophils Function (NEUT)
14. Platelet count (PLATELET_COUNT)
15. Red blood cell count (RBC)
16. Red cell distribution width (RDW)
17. White Blood Cell (WBC)
Statistical features of the dataset
For better understanding, a statistical analysis of the dataset is depicted in the subsequent tables38. Table 3 shows the mean, Median, Standard Deviation, Maximum, and minimum values for the dataset under consideration.
| Mean | Median | Standard deviation | Max | Min | |
| AGE | 39.1 | 36 | 18.136 | 93 | 2 |
| GENDER | 0.442 | 0 | 0.4974 | 1 | 0 |
| BASO | 0.07 | 0.07 | 0.0701 | 0.72 | 0 |
| EOS | 0.231 | 0.229 | 0.2048 | 2 | 0 |
| HCT | 40.88 | 40.7 | 6.0313 | 56.5 | 3.4 |
| HGB | 13.67 | 13.45 | 4.3446 | 81.3 | 5.9 |
| LYMP | 2.595 | 2.33 | 2.1843 | 33.4 | 0.4 |
| MCH | 26.78 | 27 | 3.3177 | 34.5 | 2.6 |
| MCHC | 32.71 | 33 | 2.1017 | 43.1 | 15 |
| MCV | 81.15 | 82.8 | 9.4426 | 102 | 13 |
| MONO | 1.189 | 0.613 | 6.1198 | 95 | 0.2 |
| MPV | 9.217 | 9.217 | 1.7297 | 13.4 | 0 |
| NEUT | 4.23 | 4.23 | 2.3074 | 16 | 0.6 |
| PLATELET_COUNT | 279.7 | 272.5 | 85.473 | 685 | 0 |
| RBC | 5.677 | 5 | 11.615 | 215 | 2.1 |
| RDW | 14.72 | 13.4 | 15.769 | 296 | 0 |
| WBC | 6.777 | 6.505 | 3.5836 | 33.4 | 1.1 |
| Class | 0.5 | 0.5 | 0.5008 | 1 | 0 |
Table 3: Statistical features of the dataset. This table lists the statistical features of the data.
Additionally, Table 4 shows the obtained correlation coefficient between each attribute and the class attribute. Its values fall between 0 (least correlated) and 1 (most correlated). It is added as a preliminary statistical analysis to explain the dataset attributes. MPV, Gender, HGB, MCHC, and age are among the most significant features.
| Attributes' pairs | Correlation coefficient |
| AGE | 0.212473 |
| GENDER | 0.423584 |
| BASO | -0.33242 |
| EOS | 0.048184 |
| HCT | -0.376843 |
| HGB | 0.275277 |
| LYMP | 0.055856 |
| MCH | 0.128111 |
| MCHC | 0.272635 |
| MCV | 0.013022 |
| MONO | 0.055476 |
| MPV | 0.564992 |
| NEUT | 0.031185 |
| PLATELET_COUNT | 0.095253 |
| RBC | 0.030787 |
| RDW | 0.025979 |
| WBC | 0.148842 |
| Class | 1 |
Table 4: Correlation with class attribute. This table shows the correlation between the attributes (features) and the class attribute.
Experimental setup
In the current study, the Python programming language is used to preprocess the collected dataset. Due to human error, specific values are missing during data entry and selection. Imputation techniques have been used to handle missing values in the dataset. It is done by replacing missing values with the attribute's average. Because of its simplicity, model compatibility, and preservation of sample mean values, as discussed with healthcare professionals. Moreover, feature selection is performed using correlation coefficients to rank the attributes. The features with higher correlation values were selected for analysis alongside the complete feature set. Python libraries have been utilized for the implementation of the proposed approach, hyperparameter tuning, and obtaining results. The feature selection and elimination were performed by an attribute selection method to identify the feature groups with the highest accuracy. Additionally, Python was used to evaluate accuracy using 10-fold cross-validation and Direct Partition Ratio evaluation methods, as specified by the given equations39,40. Finally, the mean of all the evaluation methods' outputs was calculated to compare the assessment methods used and determine the method with the best average accuracy38. In addition, confusion matrices were generated using the optimal parameters of SVM, ANN, RF, and NB. Then, a comparison of false positives (FP), false negatives (FN), true positives (TP), and true negatives (TN) ratios was performed through the calculation of the F1-score, which is an efficient measure for comparing the best method41,42.
Evaluation metrics
To evaluate the performance of the proposed approach, four well-known performance metrics are considered. Namely, accuracy, precision, recall, and F1-score. Classification accuracy is the primary measure because the percentage of correctly classified instances is calculated for each instance. Precision is the number of total TP points expected. The recall is the number of TP more than each actual positive. F1-score performance of each class. According to the capability of the outputs, the following metrics are obtained43,44,45:
True positive (TP): Result of correctly diagnosed as asthma.
False positive (FP): Result of being incorrectly diagnosed as having asthma.
True negative (TN): Result of correct cases diagnosed as non-asthma.
False negative (FN): Result of being incorrectly diagnosed as non-asthma.
 (4)
(4)
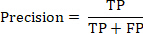 (5)
(5)
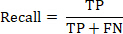 (6)
(6)
Optimization strategy
To determine the optimal parameters for each of the proposed approaches, the Grid Search technique was employed. Specific parameter possible values are placed in the Grid Search method. Therefore, it can develop the best possible performance for precision improvement.
Figures 5–7 depict the outcome of the Grid Search technique for all four proposed approaches and the implementation procedure on the dataset with the assistance of the top eighteen attributes. Figure 5 presents the SVM accuracies obtained with various parameter values. The input values for the Cost and Gamma corresponding to multiple types of kernels are as follows:
Kernel types: Linear, Radial, Sigmoid, and Polynomial.
Gamma: 0.001 and 0.0001.
Cost: 1, 10, 100, and 1000.
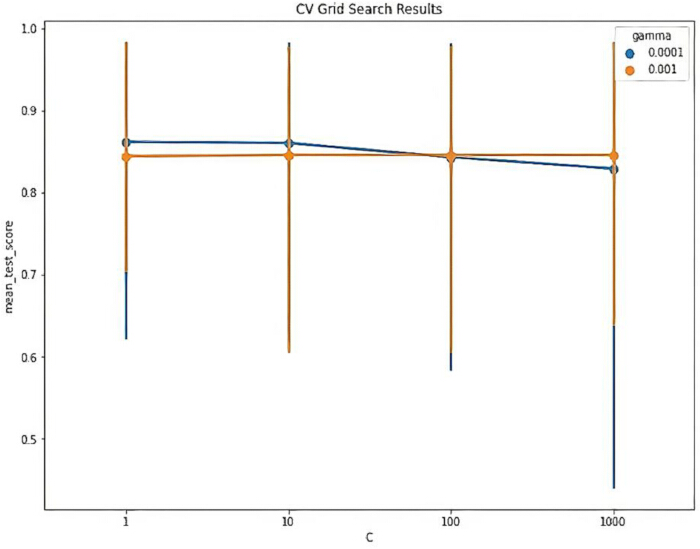
Figure 5: SVM with different cost and gamma types. This figure demonstrates SVM behavior with different cost and gamma types. Abbreviations; SVM = support vector machine. Please click here to view a larger version of this figure.
For the RF, the systematically input values indicated in Figure 6 are as follows:
The parameter names, together with their respective values, are provided below:
Number of features: 'auto', 'sqrt'.
Max depth: 1, 3, 5, 7.
MIN samples split: 2, 3, 4, 5.
MIN samples leaf: 2, 3, 4, 5.
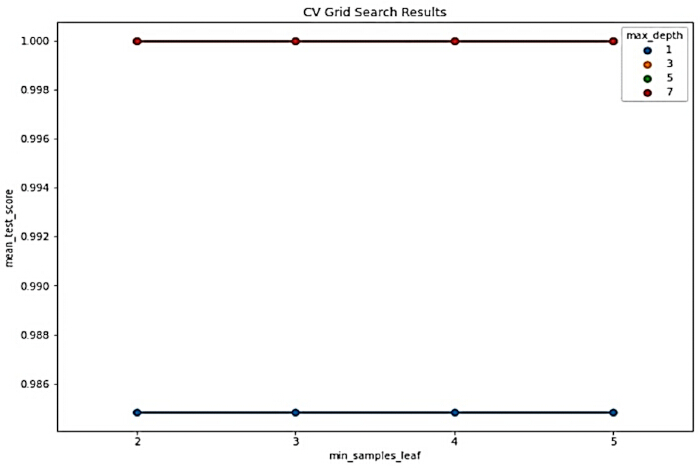
Figure 6: RF with different depth values and minimum sample leaves. This figure depicts RF behavior with different depths and minimum sample leaf values. Abbreviations; RF = random forest. Please click here to view a larger version of this figure.
For the ANN, the analytical input values are indicated in Figure 7.
The parameter names, along with their respective values, are the following:
Hidden layer sizes: (50, 50, 50), (50, 100, 50), and (100,).
Activation: 'tanh', and 'relu'.
Solver: 'sgd', and 'adam'.
Alpha: 0.1, 0.01, 0.001, 0.0001, 0.5, 0.005, 0.0005, and 0.05.
Learning rate: 'constant', and 'adaptive'.
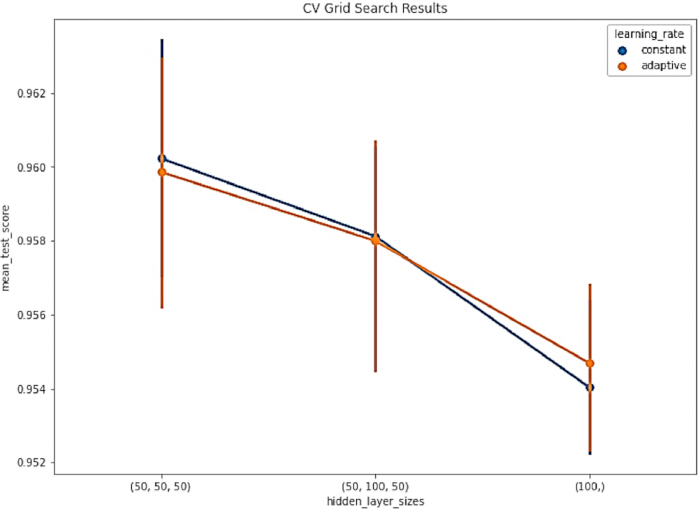
Figure 7: ANN with different alpha values and hidden layer sizes. This figure depicts the behavior of the ANN with different alpha values and hidden layer sizes. Abbreviations; ANN = artificial neural network. Please click here to view a larger version of this figure.
| Classifier | Parameter | Value |
| SVM | Gamma | 0.0001 |
| Kernel type | 'rbf' | |
| Cost ‘C” | 10 | |
| Random state | 42 | |
| RF | Max depth | 3 |
| Min samples leaf | 2 | |
| Min samples split | 2 | |
| Random state | 42 | |
| ANN | activation | 'relu' |
| alpha | 0.001 | |
| size of hidden layer | (50,50,50) | |
| Learning rate | 'constant' | |
| solver | ‘adam’ | |
| Random state | 42 |
Table 5: Summary of optimal parameters for the proposed classifiers. This table summarizes the optimal parameters obtained for the proposed classifiers.
Access restricted. Please log in or start a trial to view this content.
Results
Influence of feature selection
In the current study, the recursive feature elimination-based correlation coefficient method is used for the feature selection. The correlation coefficient is used to order the features from the highest to the lowest according to their correlation values. Recursive feature elimination is used to assist in selecting the suitable features for the model, as it progressively eliminates the weakest features until only one remains. Every process runs the four selected classif...
Access restricted. Please log in or start a trial to view this content.
Discussion
The current study employs several machine learning algorithms, including SVM, ANN, RF, and NB. Upon conducting several experiments, fine-tuning hyperparameters and feature selection, it is concluded that SVM, ANN, and RF exhibit a remarkable diagnostic accuracy of 94%, while NB is comparatively lower at 83.33%. The results were validated using 10-fold cross-validation and optimized feature selection, as well as the best split ratio. According to the given data, seventeen parameters of the patients were ranked in order of...
Access restricted. Please log in or start a trial to view this content.
Disclosures
The dataset has been obtained from the hospital under IRB-2020-09-429. The authors declare that they have no conflicts of interest to report regarding the current study. The study has been added to the Research Square repository as a preprint with the following citation50.
AUTHORS’ CONTRIBUTIONS:
Conceptualization has been done by S.O., M.I.B.A. and A.R.; Supervision has been done by S.O., M.I.B.A. and J.A.; Writing original draft was performed by S.S.A., E.A. and Z.A.; Implementation was done by S.A.A., Y.A. and R.A.; Validation was done by J.A., M.A. and S.D.; Data Curation was done by A.B., Y.A., E.A. and Z.A.; Review and Editing was performed by A.R., S.D. and A.B.; Project Administration was performed by A.R., S.D. and M.A. and Funding Acquisition was performed by A.B., S.D. and A.R.
Acknowledgements
The authors would like to acknowledge the support of healthcare professionals in validating the study's findings.
Access restricted. Please log in or start a trial to view this content.
Materials
| Name | Company | Catalog Number | Comments |
|---|---|---|---|
| Excel 365 | Microsoft | Excel 365 | Used to store raw data in csv format |
| Laptop/Machine | Dell | XPS9320 | RAM 16GB, 12th Gen Intel(R) Core(TM) i7-1260P |
| Mlxtend 0.23.4 | Google colab Notebook | Mlxtend 0.23.4 | Used for model building training |
| Numpy 2.0.2 | Google colab Notebook | Numpy 2.0.2 | Used for model building training |
| Pandas 2.2.2 | Google colab Notebook | Pandas 2.2.2 | Used for model building training |
| Python 3.12.12 | Google colab Notebook | Python 3.12.12 | Used for model building training |
| Sklearn 1.6.1 | Google colab Notebook | Sklearn 1.6.1 | Used for model building training |
| SPSS | IBM, USA | Version 26.0 | Used for statisitcal analysis |
| XGbbost 3.1.2 | Google colab Notebook | XGbbost 3.1.2 | Used for model building training |