This study investigates four machine learning algorithms: K-nearest neighbors (KNN), support vector machine (SVM), extreme gradient boosting (XGBoost), and a soft voting ensemble classifier in the proactive diagnosis of hypothyroidism. The algorithms were shortlisted based on a critical literature review and employed over a locally collected dataset from Saudi Arabia.
A subscription to JoVE is required to view this content. Sign in or start your free trial.
Method Article
Early Diagnosis of Hypothyroidism in the Eastern Province of Saudi Arabia Using Computational Intelligence Techniques
In This Article
Summary
Abstract
Hypothyroidism is one of the most common yet underdiagnosed medical conditions in Saudi Arabia. It is more prevalent in aged and pregnant women as well as in patients with diabetes and sleep apnea. Hypothyroidism is characterized by the thyroid gland producing inadequate thyroid hormones, which might result in other chronic illnesses if left untreated. For this reason, this study proposes machine learning techniques to preemptively diagnose this disease using a straightforward clinical dataset from Saudi Arabia. Given the data size, this work serves as proof of concept. Algorithms such as KNN, SVM, Gradient boosting, and soft voting ensemble classifier were chosen for their promising performance in the proactive diagnosis of hypothyroidism and associated diseases compared to other algorithms in literature. The best performing model was the soft voting ensemble classifier, which achieved an accuracy of 94.7%. SVM, KNN, and XGBoost achieved 94%, 93.42%, and 92.1% accuracies, respectively. These results were obtained using 10 fold cross validation and forward sequential feature selection.
Introduction
Thyroid dysfunction (TD) is one of the most common chronic endocrine illnesses, with varying prevalence across populations1. The two most common thyroid gland disorders are hypothyroidism and hyperthyroidism. Hypothyroidism is a prevalent condition that results from insufficient thyroid hormone production. While it is generally manageable with treatment, in severe instances, it can be fatal if not addressed. The most common symptoms of hypothyroidism in adults include fatigue, constipation, lethargy, weight gain, dry skin, and voice changes. However, clinical presentations may vary by age, gender, and other factors3. It is reported that the disease affects 5% of the general population, and an additional 5% remain undiagnosed, while 99% of these patients suffer from primary hypothyroidism. It is widespread in the Arabian Gulf States, although it often remains underdiagnosed4. Congenital hypothyroidism affects approximately one in every 3,450 babies in Saudi Arabia. Other cross-sectional studies that focused solely on women reported higher prevalence rates ranging from 13% to 35%5. Further, proving that females are more susceptible than males6. Hypothyroidism, if left untreated, can lead to dyslipidemia, cognitive impairment, hypertension, infertility, and neuromuscular dysfunction7. Consequently, this study aims to employ machine learning methods to proactively diagnose hypothyroidism using a dataset from King Fahad Specialist Hospital (KFUH) in Dammam, Saudi Arabia.
Hypothyroidism can be difficult to diagnose because the symptoms are often mistaken for those of other illnesses8. Moreover, a late diagnosis of hypothyroidism can negatively affect the intellectual abilities of a patient9. The thyroid stimulating hormone (TSH) test is the most used diagnostic method for detecting hypothyroidism9. However, the arrival of artificial intelligence and machine learning approaches, strategies, and tools has helped resolve diagnostic and prognostic problems across various medical areas. ML is used to assess the significance of clinical factors and their combinations for prognosis, such as predicting illness progression, extracting medical knowledge for outcome research, therapeutic planning and support, and overall patient care10. With large volumes of medical data available, medical practitioners now have a valuable resource for discovering new and potentially valuable knowledge through machine learning11,12.
Using a simple clinical dataset from the Saudi dataset, this study aims to assist health workers in the country in diagnosing hypothyroidism early and to implement this predictive system in hospitals with limited computer resources and equipment. Additionally, prior studies in this field did not utilize the Saudi dataset. This presents a chance to incorporate the Saudi dataset alongside earlier research. The studies employed a Saudi dataset to predict kidney disease, diabetes, thyroid disease, and Alzheimer's disease, respectively, achieving high accuracy13,14,15. This experience motivates applying these methods to other diseases in Saudi Arabia. The studies are among the latest works in machine learning and artificial intelligence in the medical field16,17,18,19.
The proposed study discusses deploying machine learning techniques on a simple clinical Saudi dataset for hypothyroidism to predict the presence of the disease before it becomes fully symptomatic. The aim is to develop a machine learning based system that provides early warnings of a potential occurrence of hypothyroidism. It will also make it easier for local hospitals with limited equipment to use this diagnostic system. This study is the first to examine this disease using the Saudi dataset, focusing on the pre-symptomatic stage. The dataset covers a broad patient population for local Saudi hospital patients, with a wide age range, a mix of positive and negative cases of hyperthyroidism.
This study utilized four machine learning algorithms: support vector machine (SVM), K-nearest neighbors (KNN), eXtreme gradient boosting (XGBoost), and a soft voting ensemble classifier composed of SVM and KNN. Each of the four algorithms has proved its capabilities in the medical field. The KNN algorithm was selected for its simplicity and for achieving a test accuracy of 77.5% in the preemptive diagnosis of diabetes mellitus (DM)20. At the same time, SVM was chosen for its robustness21, and it has recently been used to predict mortality risk in COVID-19 patients22. Moreover, XGBoost was selected for its strong performance23, achieving an accurate predictive score of 94% for hypertension outcomes, and stacking was employed to enhance the results from the top-performing algorithms. In addition, a voting ensemble classifier has been utilized to identify thyroid disorders with 100% accuracy24.
The primary objective of the current study is early diagnosis of hypothyroidism in a Saudi population using an original routine clinical data and state-of-the-art machine learning algorithms. The four techniques used in this study were implemented on the Jupyter platform using the Python programming language, using the hypothyroidism dataset. 10 fold cross validation with hyperparameter tuning was used to improve performance. Sequential feature selection with a forward selection technique was then implemented, resulting in the voting ensemble classifier achieving the highest accuracy of 94.7%. SVM, KNN, and XGBoost, respectively, followed it. Regarding recall, the soft voting ensemble classifier achieved the highest score at 95.5%. Overall, the optimal model for preemptive hypothyroidism diagnosis was the soft voting ensemble classifier, which achieved the highest score across all performance measures evaluated in this study.
Several studies have been conducted on diagnosing general thyroid disorders and on implementing technology, especially machine learning, as a computer-aided solution. LSTM-CNN, AlexNet, the adjusted GoogLeNet, IndRNN–CNN, and the adjusted ResNet deep learning models were deployed using Raman spectroscopy to distinguish serum samples from 32 hypothyroidism patients, 38 hyperthyroidism patients, and 29 control subjects. Their model obtained accuracy of 84%, 91%, 75%, 82%, and 71%, respectively25.
Machine learning algorithms like SVM, KNN, logistic regression, and random forest have been utilized for predicting the incidence of radiation-induced hypothyroidism in nasopharyngeal carcinoma patients26. Their model achieved an AUC value of 0.7. Moreover, the authors employed various machine learning algorithms to predict the treatment trend of patients with hypothyroidism undergoing LT4 treatment. Among 10 classifiers, the extra-tree classifier achieved the highest accuracy of 84%.
In another study, the authors created and tested a machine-learning strategy for identifying people with hyperthyroidism and hypothyroidism who would benefit from immediate medical treatment27. They deployed gradient boosting decision tree (GBDT), SVM, ANN, and logistic regression algorithms. Their models obtained an AUROC of 93.8% and 90.9% for hyperthyroidism and hypothyroidism, respectively. In another study, the authors used machine learning to detect thyroid disorders, which comprise hypothyroidism and hyperthyroidism. Their models included SVM, ANN, KNN, logistic regression, and decision tree, with the highest accuracy of 96.92% achieved by Logistic Regression28. Recently, a group of researchers applied different methods, including SVM, decision tree, Naïve Bayes, and ensemble, to predict and detect hypothyroidism. The decision tree achieved the highest accuracy, with 97.6%29. Another study applied the hybrid differential evolution kernel-based Naïve Bayes algorithm to reduce the attributes of a thyroid dataset of hyperthyroidism and hypothyroidism diseases from 21 to 10. They later applied the kernel-based Naïve Bayes classifier to the feature subset, achieving 97.97% accuracy30. Likewise, in another study, the authors used several machine-learning algorithms to predict the risk of thyroid disease on the sick-euthyroid dataset from California University. Their experiment demonstrated that ANN surpassed all other methods, achieving an accuracy of 95%31. Furthermore, Jha et al. used proposed feature augmentation techniques based on deep neural networks to predict thyroid diseases, achieving an outstanding accuracy of 99.95%32.
According to prior literature, a homogeneous voting ensemble with multiple attribute selection was used to identify thyroid diseases, employing the following algorithms: random forest, gradient boosting, decision tree, and logistic regression, obtaining 100% accuracy24. Furthermore, the authors applied the extreme learning machine model to the hypothyroidism open-access dataset on Kaggle, achieving 92% accuracy. The dataset contained 3772 samples: 3481 hypothyroid and the rest negative33. Recently, in a study, the authors utilized bagged CART to classify hypothyroidism. Their proposed model attained an impressive accuracy of 99.9%. Additionally, T4U, TSH, and TBG were identified as the most significant factors associated with hypothyroidism34. In another study, the authors proposed and compared different machine learning and deep learning models, in which decision tree and random forest achieved an accuracy of 99.5% and 99.3%, respectively. They used a Weka dataset containing 30 attributes and 3772 samples35.
This brief literature review demonstrates that, while most methods employed achieved very good to excellent results, none have utilized a straightforward clinical dataset from Saudi Arabia. It was also noted that most publications under consideration used imaging datasets, which raised the work required for data collection and increased the difficulty of applying very complicated models created by non-technical people. Furthermore, most of these works were done on general thyroid disorders, with very few publications emphasizing hypothyroidism. This situation provides an opportunity to investigate basic machine learning models on a simple clinical dataset from the Saudi dataset to assist local hospitals with limited computerized equipment in pre-emptively diagnosing the disease.
The brief introduction to the algorithms investigated in the current study is given in Supplementary File 1. The four algorithms are K-Nearest Neighbor (KNN)36,37,38,39,40, Support Vector Machine (SVM)41,42,43,44,45, Extreme Gradient Boosting (XGBoost)46,47,48, and voting ensemble49,50.
Access restricted. Please log in or start a trial to view this content.
Protocol
1. Methodology
NOTE: As described in Table of Materials, the experiment for this research was conducted in Python on Jupyter Notebook, which was used to develop machine learning models for preemptive diagnosis of Hypothyroidism. Microsoft Excel and the Python Scikit-Learn library were used in the preprocessing stage. K-nearest neighbor (KNN), support vector machine (SVM), extreme gradient boosting (XGBoost), and a soft voting ensemble classifier composed of KNN and SVM were then used to train the dataset, with GridSearchCV and 10-fold cross-validation to obtain optimal hyperparameters. Additionally, the feature importance for each classifier was plotted using permutation importance.
- Employ sequential feature selection using the mxl-tend library's forwarding technique.
- Apply the sequential feature selector to all models using 10-fold cross-validation to select the best feature subset.
- Evaluate the average accuracy, recall, precision, F1–score, and log loss of all models created using 10-fold cross-validation to identify the best model.
- Additionally, generate confusion matrices and areas under the receiver operating characteristic (AUROC) curves for each model using optimal hyperparameters and the best feature subset.
- Validate the diagnostic results by a team of three experts in otolaryngology, general medicine, and radiology. Figure 1 outlines the framework for the experimental findings.
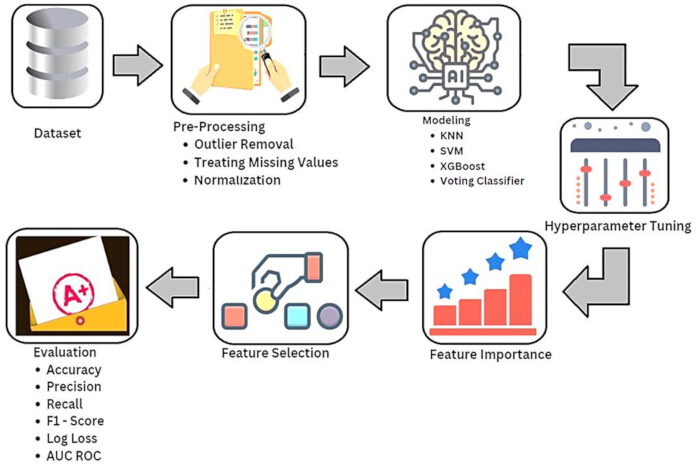
Figure 1: Experimental framework. This is the study's experimental framework. Please click here to view a larger version of this figure.
NOTE: The Saudi dataset for hypothyroidism was obtained from King Fahad Specialist Hospital (KFSH) in Dammam, Saudi Arabia. It is a public hospital affiliated with Imam Abdulrahman bin Faisal University (formerly known as the University of Dammam). Dammam is in the eastern province, and most of the patients belong to the same region. With approval from the institutional review board (IRB), the dataset was collected during standard triage procedures and trials at the hospital and recorded as patient health records (PHRs) in the hospital management system, registered over the years 2020–2021. The dataset contains standard clinical tests of 152 patients (100 female and 52 male), aged 11–92 years, out of which 89 were positively diagnosed with hypothyroidism. In contrast, the remaining 63 were diagnosed as without hypothyroidism but with other diseases, such as Alzheimer's disease. The dataset had 483 attributes, which were reduced to 18 during preprocessing by removing attributes with missing values exceeding 30%. Table 1 outlines the features utilized in this study.
| Feature | Description |
| Age | Age in years. |
| Sex | Male or Female. |
| White Blood Cells (WBC) | White Blood Cell count. |
| Temperature | Body temperature in degrees Celsius (˚C). |
| Red Blood Cells (RBC) | Red Blood Cell count. |
| Platelet | Platelet count. |
| MPV | Mean Platelet Volume |
| Pulse Ox | The measurement of oxygen in the blood (oxygen saturation). |
| MCH | Mean Corpuscular Hemoglobin. |
| RDW | Red Cell Distribution Width. |
| MCV | Mean Corpuscular Volume. |
| MCHC | Mean Corpuscular Hemoglobin Concentration |
| Pulse | Heart rate. |
| Hematocrit | The Volume of red blood cells. |
| BP – Systolic | The highest blood pressure. |
| Hemoglobin | Hemoglobin level in the blood. |
| BP – Diastolic | The lowest pressure. |
| Respiratory Rate | Breathing rate per minute. |
Table 1: Dataset description. This table presents the description dataset.
2. Statistical analysis
NOTE: Statistical analysis of the dataset helps visualize and understand the pattern of the dataset for better data pre-processing and modeling. Table 2 displays the Hypothyroidism Disease dataset’s statistical analysis, comparing the results in the HT and non-HT groups.
- To investigate if the demographic features are imbalanced between positive and negative groups, perform a statistical analysis on SPSS software (version: 26.0, IBM, USA).
- Compile the quantitative data using an independent sample t-test if the normal distribution and homogeneity of variance were satisfied, or the Man-Whitney U test.
- Compile categorical data using chi-squared test or Fisher’s exact test.
| Variable | Hypothyroidism (n = 89) | Non- Hypothyroidism (n = 63) | t / U value | P value |
| Age | 43.00 (33.00, 54.00) | 76.00 (70.00, 80.50) | 5.388 | < 0.001 |
| Respiratory Rate | 20.00 (20.00, 20.00) | 20.00 (20.00, 21.50) | 2.561 | 0.004 |
| BP – Systolic | 117.72 ± 16.46 | 127.85 ± 17.77 | 3.302 | 0.001 |
| BP – Diastolic | 73.00 (68.00, 79.00) | 72.95 (65.00, 80.25) | 2.076 | 0.892 |
| Pulse | 79.09 ± 12.19 | 82.35 ± 12.72 | 1.47 | 0.145 |
| Temperature | 36.60 (36.50, 36.80) | 36.70 (36.60, 36.90) | 2.576 | 0.029 |
| Pulse Ox | 99.00 (99.00, 100.00) | 99.00 (98.00, 99.00) | 1.088 | 0.005 |
| Hematocrit | 38.20 (35.88, 40.23) | 37.30 (31.30, 41.30) | 1.471 | 0.318 |
| Red Blood Cells | 4.52 (4.26, 4.81) | 4.37 (3.81, 4.89) | 1.36 | 0.104 |
| Hemoglobin | 12.70 (11.70, 13.53) | 12.30 (10.00, 13.85) | 1.481 | 0.345 |
| RDW | 13.80 (13.38, 14.93) | 14.90 (13.80, 16.45) | 2.212 | 0.002 |
| MCV | 83.54 ± 6.85 | 85.05 ± 8.53 | 1.042 | 0.3 |
| Platelet | 261.23 ± 63.97 | 223.62 ± 68.88 | −2.945 | 0.004 |
| MCHC | 33.60 (32.80, 34.02) | 33.20 (32.30, 34.00) | 1.314 | 0.06 |
| MCH | 28.00 (26.55, 29.57) | 28.10 (26.55, 30.20) | 1.78 | 0.468 |
| MPV | 8.81 ± 0.87 | 8.79 ± 1.38 | −0.074 | 0.941 |
| White Blood Cells | 6.10 (4.80, 7.43) | 7.20 (5.70, 8.90) | 2.075 | 0.017 |
Table 2: Statistical analysis of features. This table shows the statistical analysis of features in both the HT and non-HT groups. Abbreviations; HT = hypothyroidism.
NOTE: In Table 2, the HT and non-HT groups are significantly different in Age, Respiratory Rate, BP-systolic, Temperature, Pulse Ox, RDW, Platelet, and White Blood Cells. Therefore, physiological features might be used to differentiate the two groups.
3. Data preprocessing
- Loading the raw CSV data. The dataset utilized for this study is in CSV format. First, the CSV file was imported in its raw format. It is given below:
clean_data = pd.DataFrame(normalized,columns=['sex','Age','Pulse','BP - Systolic','BP - Diastolic','Temperature','Respiratory Rate','MCV','MCH','MCHC','Hematocrit','White Blood Cells','Hemoglobin','Red Blood Cells','RDW','Platelet','MPV','Pulse Ox','Description']) - Perform data preprocessing, including outlier removal, handling missing values, and normalisation, to improve the model's data representation and accuracy.
- Use Microsoft Excel for initial processing of the dataset, including outlier removal. Remove the outliers in 'Pulse Ox', 'BP-Systolic', 'BP-Diastolic', and 'Respiratory Rate' with a scatter plot and replace with their respective means.
- Treating missing values
Import the dataset was imported into Python and preprocess using NumPy, Pandas, and Scikit-learn libraries. Use the KNN imputer from the sklearn library to handle missing values.
NOTE: The Euclidean metric and a nearest-neighbor value of 5 were used. It is given below:
imputer = KNNImputer(n_neighbors=5)
data = imputer.fit_transform(clean_data)
scaler = MinMaxScaler()
scaler.fit(data) - Encode the strings into binary.
NOTE: The integer value one represented 'Positive' and 'Female' in 'Description' and 'Gender', respectively, while zero represented 'Negative' and 'Male' in 'Description' and 'Gender', respectively. The dataset was then scaled using the MinMaxScaler from the sklearn library, mapping values to the range 0–1. It is given below:
normalized = scaler.transform(data)
4. Model building and evaluation
NOTE: Splitting data for cross-validation: After various experiments with different folds, 10-fold cross-validation was found to be optimal and was subsequently employed.
- Train each model with specified hyperparameters.
- Perform feature selection and re-train models on selected features.
NOTE: In the proposed study, a forward sequential feature selection technique has been employed. The models were then optimized for the best feature set. For steps 4.1–4.2, the following code segment has been deployed:
from sklearn.model_selection import train_test_split, GridSearchCV, StratifiedKFold
kf = StratifiedKFold(n_splits=10,shuffle=True, random_state=1)
The gridearch used stratified k fold with 10 splits and accuracy was the scoring metric. The code below explains how this was executed with an example using SVM.
parameters = {
'kernel': ['linear', 'poly', 'rbf', 'sigmoid'],
'C': [1, 2, 3, 4, 5, 6, 7, 8, 9, 10, 100],
'gamma': [1, 0.1, 0.01, 0.001, 0.0001]
}svm = SVC(random_state = 1)
svm_GS = GridSearchCV(svm,
parameters,
cv=kf,
scoring='accuracy'
)
svm_GS.fit(X, y)
fig = plot_cv_results(svm_GS.cv_results_, 'C', 'kernel')
sfs1 = SFS(estimator=svm,
k_features=(1, 18),
forward=True,
floating=False,
scoring='accuracy',
cv=kf) - Evaluate performance metrics and choose the final model.
NOTE: Performance measure: This study employed the most used performance measures in classification, namely: accuracy, precision, recall, F1–Score, and log loss. These performance measures are briefly described below, along with their formulas.
Precision (PR): The number of true positive observations which belong to the total expected positive observations. It is given by the formula:
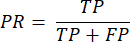 (1)
(1)
Recall (RE): Represent the number of actual positive cases predicted as being positive. It is given by the formula:
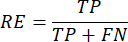 (2)
(2)
Accuracy (AC): This is the percentage of correct predictions the model made. It is given by:
 (3)
(3)
Where:
True Positive (TP): Number of correctly classified hypothyroidism instances.
False Positive (FP): Number of incorrectly classified hypothyroidism instances.
True Negative (TN): Number of correctly classified non-hypothyroidism instances.
False Negative (FN): Number of incorrectly classified non-hypothyroidism instances.
F1–Score: This is the weighted average of the recall and the precision. It is given by
 (4)
(4)
Log Loss: This is how closely the predicted probability matches the actual true value. It
is given by the formula:
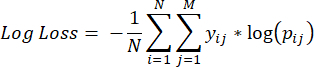 (5)
(5)
Where N and M denote the number of samples and features respectively, Yij denotes whether ith sample belongs to the jth class or not Pij denotes the probability of the ith sample belonging to the jth class.This study also plotted the receiver operating characteristic (ROC), which is useful in predicting the probability of a binary outcome. This was done to help visualize the models' performance at various threshold settings. The ROC tells how good a model is at distinguishing between classes. - Optimization strategy
NOTE: Hyperparameter optimization cannot be overemphasized in achieving the best results in any machine learning study. This study employed GridSearchCV with stratified 10 fold cross validation to determine the optimal hyperparameters for each model. GridSearchCV is a tool for fine tuning the parameters of a model. It operates by looping through all parameters provided in the parameter grid and selecting the best combinations. Hyperparameter tuning is crucial for identifying the highest accuracy in each model. The hyperparameters for each model, including the range, best value, and the accuracy they produced, are presented in Table 3.
| Algorithm | Hyper-parameter name | Hyper-parameter Range | Best Value | Accuracy using the best value |
| K-NN | Metric | ‘minkowski’,’manhattan’,’euclidean’ | minkowski | 84.21% |
| N_neighbors | 3, 5, 7, 9, 11, 13 | 5 | ||
| SVM | Kernel | ‘linear’, ‘poly’,’rbf’, ‘sigmoid’ | linear | 92.76% |
| Cost (C) | 1, 2, 3, 4, 5, 6, 7, 8, 9, 10, 100 | 9 | ||
| Gamma | 1, 0.1, 0.01, 0.001, 0.0001 | 1 | ||
| XGBoost | N_estimators | 5,01,00,15,02,00,250 | 200 | 89.47% |
Table 3: Optimal hyperparameter. This shows the optimal hyperparameter of each model.
Figures 2–4 present the grid search approach for hyperparameter search for the KNN, SVM, and XGBoost techniques and how they were implemented using all features.
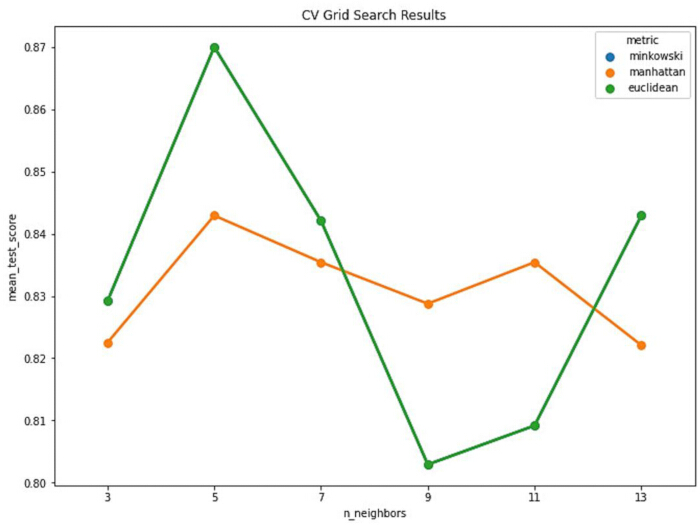
Figure 2: KNN Performance. This is the performance of KNN across different metrics and neighbor counts. Abbreviations; KNN = K nearest neighbour. Please click here to view a larger version of this figure.
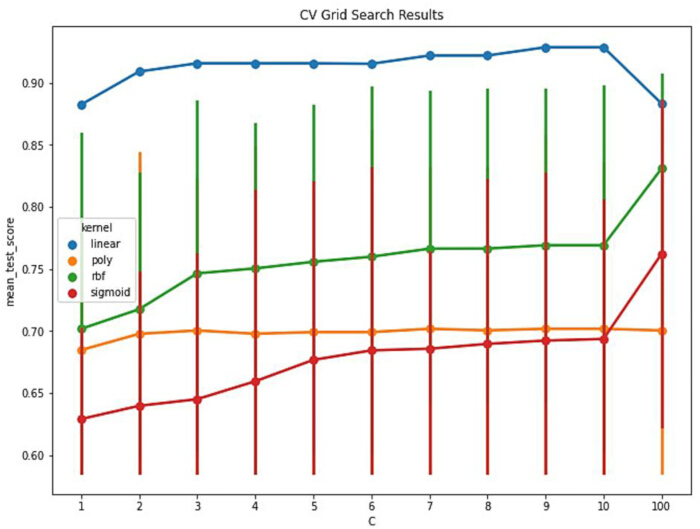
Figure 3: SVM Performance. This is the performance of SVM with Kernel and Cost Function values Please click here to view a larger version of this figure.
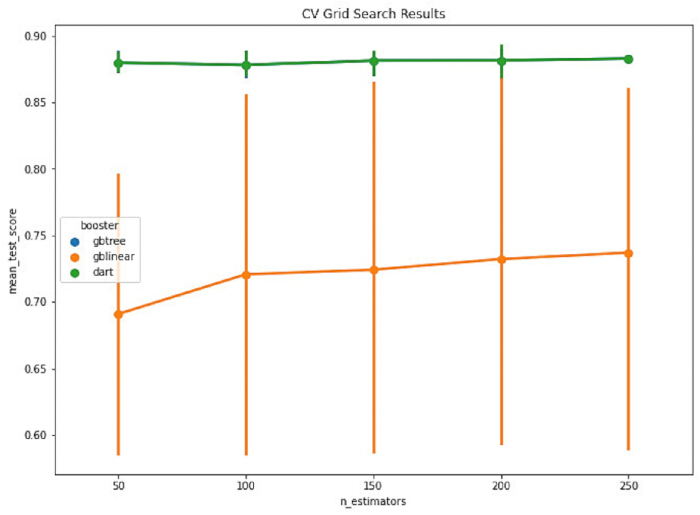
Figure 4: XGBoost Performance. This is XGBoost performance with different Booster and N_estimator values. Abbreviations; XGBoost = Extreme gradient boosting. Please click here to view a larger version of this figure.
- Create a soft voting classifier to further improve the model's performance by combining the best parameters obtained from the KNN and SVM classifiers. It comprises one KNN classifier and two SVM classifiers.
- Replace one of the SVM's Kernels with 'rbf', the second-best Kernel next to 'linear'.
- NOTE: The classifiers and their respective hyperparameters were chosen because they yielded the best performance after many trial-and-error attempts on all classifiers and their hyperparameters. Additionally, based on a long history of dealing with preemptive diagnostics problems for various diseases using clinical datasets collected similarly to those in14,15, this combination shows promising diagnostic accuracy, as further demonstrated in the experimental sections. Table 4 shows the classifiers used for Soft Voting, their hyperparameters, and the accuracy produced.
| Algorithm | Classifiers | Hyper-parameters | Accuracy | |
| Soft Voting Classifier | K-NN | Metric | Minkowski | |
| N_neighbors | 5 | |||
| SVM1 | Kernel | linear | ||
| Cost (C) | 9 | 88.81% | ||
| Gamma | 1 | |||
| SVM2 | Kernel | rbf | ||
| Cost (C) | 9 | |||
| Gamma | 1 | |||
Table 4: Voting classifier hyperparameters. This shows the voting classifier combination and hyperparameters.
Access restricted. Please log in or start a trial to view this content.
Results
Performance of models
The performance of the four models created in this study was compared and analyzed regarding their accuracy, recall, and testing. GridsearchCV algorithm was utilized to identify the best hyperparameter for each model using all features. The performance of each model was evaluated with a stratified 10 fold cross validation. Table 5 presents the results of each model’s performance.
Access restricted. Please log in or start a trial to view this content.
Discussion
In this study, machine learning algorithms on a Saudi clinical dataset are investigated to develop a preemptive diagnostic model for hypothyroidism. Four models were created: KNN, SVM, XGBoost, and Soft Voting Ensemble Classifier. All four models identified age and respiratory rate as significant indicators in the preemptive diagnosis of the disease. Among the four models, the Voting Classifier demonstrated superior performance across all metrics used in this study. Utilizing just five features, it achieved an accuracy o...
Access restricted. Please log in or start a trial to view this content.
Disclosures
The dataset has been obtained from the hospital under IRB-2020-09-429. The authors have no conflicts of interest to report regarding the current study.
Acknowledgements
The authors would like to acknowledge the support of healthcare professionals for validation of the findings of the study.
Access restricted. Please log in or start a trial to view this content.
Materials
| Name | Company | Catalog Number | Comments |
|---|---|---|---|
| Laptop/Machine | Dell | XPS9320 | RAM 16GB, 12th Gen Intel(R) Core(TM) i7-1260P |
| Excel 365 | Microsoft | Excel 365 | Used to store raw data in csv format |
| Python 3.12.12 | Google colab Notebook | Python 3.12.12 | Used for model building training |
| Numpy 2.0.2 | Google colab Notebook | Numpy 2.0.2 | Used for model building training |
| Pandas 2.2.2 | Google colab Notebook | Pandas 2.2.2 | Used for model building training |
| Sklearn 1.6.1 | Google colab Notebook | Sklearn 1.6.1 | Used for model building training |
| Mlxtend 0.23.4 | Google colab Notebook | Mlxtend 0.23.4 | Used for model building training |
| XGbbost 3.1.2 | Google colab Notebook | XGbbost 3.1.2 | Used for model building training |
| SPSS | IBM, USA | Sklearn 1.6.1 | Used for statisitcal analysis |
References
- Biondi, B., Kahaly, G. J., Robertson, R. P. Thyroid dysfunction and diabetes mellitus: two closely associated disorders. Endocr Rev. 40 (3), 789-824 (2018).
- Khan, A., Khan, M. M. A., Akhtar, S. Thyroid disorders, etiology and prevalence. J. Med. Sci. 2 (2), 89-94 (2002).
- Bianco, A. C. Hypothyroidism. Lancet. 390 (10101), 1550-1562 (2019).
- Chiovato, L., Magri, F., Carle, A. Hypothyroidism in context: where we’ve been and where we’re going. Adv. Ther. 36 (2), 47-58 (2019).
- Alzahrani, A. S., et al. Diagnosis and management of hypothyroidism in gulf cooperation council (GCC) countries. Adv. Ther. 37 (7), 3097-3111 (2020).
- Alhajri, A. H. M., Saleh Al Saad, A. M. S., Idrees, H., Hamednalla Mohamed, O. M., Mohammednoor, M., et al. Prevalence and risk factors of subclinical and overt hypothyroidism in Saudi Arabia: A Systematic Review. Cureus. 17 (6), e86336(2025).
- Gaitonde, D. Y., Rowley, K. D., Sweeney, L. B. Hypothyroidism: An update. Am. Fam. Physician. 86 (3), 244-251 (2012).
- Bianco, A. C. Emerging therapies in hypothyroidism. Annu. Rev. Med. 75, 307-319 (2024).
- Pulungan, A. B., Oldenkamp, M. E., Sarinus, A., Van Trotsenburg, P., Windarti, W., et al. Effect of delayed diagnosis and treatment of congenital hypothyroidism on intelligence and quality of life: an observational study. Horm. Res. Paediatr. 28 (4), 396-401 (2019).
- Musleh, D., Rahman, A., Almossaeed, H., Balhareth, F., Alqahtani, G., et al. AI-enabled diagnosis using YOLOv9: leveraging X-Ray image analysis in dentistry. Big Data Cogn. Comput. 10 (1), 16(2026).
- Alassaf, R. A., et al. Preemptive diagnosis of chronic kidney disease using machine learning techniques. International Conference on Innovations in Information Technology (IIT), Al Ain, United Arab Emirates, , 99-104 (2018).
- Rahman, A., Youldash, M., Alshammari, G., Sebiany, A., Alzayat, J., et al. Diabetic retinopathy detection: a hybrid intelligent approach. Comput. Mat. Contin. 80 (3), 4561-4576 (2024).
- Luca, M., Cimitile, M., Iammarino, M., Iammarino, M. Thyroid disease treatment prediction with machine learning approaches. Procedia Comput. Sci. 192, 1031-1040 (2021).
- Olatunji, S. O., Alansari, A., Alkhorasani, H., Alsubaii, M., Sakloua, R., et al. Preemptive diagnosis of Alzheimer's disease in the eastern province of Saudi Arabia using computational intelligence techniques. Comput. Intell. Neurosci. 2022, 5476714(2022).
- Olatunji, S. O., Alansari, A., Alkhorasani, H., Alsubaii, M., Sakloua, R., et al. A novel ensemble-based technique for the preemptive diagnosis of Rheumatoid Arthritis disease in the eastern province of Saudi Arabia using clinical data. Comput Math Methods Med. 2022, 2339546(2022).
- Rahman, A. Geo-spatial disease clustering for public health decision making. Informatica. 46 (6), 21-32 (2022).
- Gollapalli, M., Rahman, A., Kudos, S. A., Foula, M. S., Alkhalifa, A. M., et al. Appendicitis diagnosis: ensemble machine learning and explainable artificial intelligence-based comprehensive approach. Big Data Cogn. Comput. 8 (9), 108(2024).
- Youldash, M., Rahman, A., Alsayed, M., Sebiany, A., Alzayat, J., et al. Early detection and classification of diabetic retinopathy: a deep learning approach. AI. 5 (4), 2586-2617 (2024).
- Zagrouba, R., Khan, M. A., et al. Modelling and simulation of COVID-19 outbreak prediction using supervised machine learning. Comput. Mat. Contin. 66 (3), 2397-2407 (2021).
- Wu, X., et al. Top 10 algorithms in data mining. Knowl. Inf. Syst. 14 (1), 1-37 (2008).
- Chen, T., Guestrin, C. XGBoost: A Scalable tree boosting system. Proc. ACM SIGKDD, 1, 785-794 (2016).
- Atta-ur-Rahman,, Sultan, K., Naseer, I., Majeed, R., Musleh, D., et al. Supervised machine learning-based prediction of COVID-19. Comput. Mat. Contin. 69 (1), 21-34 (2021).
- Chang, W., et al. A machine-learning-based prediction method for hypertension outcomes based on medical data. Diagnostics. 9 (4), 178(2019).
- Akhtar, T., et al. Effective voting ensemble of homogenous ensembling with multiple attribute-selection approaches for improved identification of thyroid disorder. Electronics. 10 (23), 3026(2021).
- Li, Y., et al. Serum Raman spectroscopy combined with deep neural network for analysis and rapid screening of hyperthyroidism and hypothyroidism. Photodiagnosis Photodyn. Ther. 35, 102382(2021).
- Ren, W., et al. Dosiomics-based prediction of radiation-induced hypothyroidism in Nasopharyngeal Carcinoma patients. Phys. Medica. 89, 219-225 (2021).
- Hu, M., et al. Development and preliminary validation of a machine learning system for thyroid dysfunction diagnosis based on routine laboratory tests. Commun Med. 2 (1), 9(2022).
- Chaganti, R., Rustam, F., De La Torre Díez, I., Mazón, J. L. V., Rodríguez, C. L., et al. Thyroid disease prediction using selective features and machine learning techniques. Cancers. 14 (16), 3914(2022).
- Almahshi, H. M., Almasri, E. A., Alquran, H., Mustafa, W. A., Alkhayyat, A. Hypothyroidism prediction and detection using machine learning. IICETA, , 159-163 (2022).
- Geetha, K., Baboo, S. S. An empirical model for thyroid disease classification using evolutionary multivariate Bayesian prediction method. Glob. J. Comput. Sci. Technol. 16 (1), 1-10 (2016).
- Islam, S. S., Haque, S., Miah, M. S. U., Bin, T. Application of machine learning algorithms to predict the thyroid disease risk: an experimental comparative study. PeerJ Comput. Sci. 8 (1), e898 1-35 (2022).
- Jha, R., Bhattacharjee, V., Mustafi, A. Increasing the prediction accuracy for thyroid disease: a step towards better health for society. Wirel. Pers. Commun. 122 (2), 1921-1938 (2022).
- Cicek, I. B., Kucukakcali, Z. Classification of hypothyroid disease with extreme learning Machine Model. J. Cogn. Syst. 5 (2), 64-68 (2020).
- Res, A. M., Evren, B. Estimating hypothyroidism with the bagged CART model based on clinical dataset and identification of risk factors. Ann. Med. Res. 29 (10), 1189-1193 (2022).
- Guleria, K., Sharma, S., Kumar, S., Tiwari, S. Early prediction of hypothyroidism and multiclass classification using predictive machine learning and deep learning. Meas. Sensors. 24, 100482(2022).
- Bach, M. New undersampling method based on the kNN approach. Procedia Comput Sci. 207 (1), 3403-3412 (2022).
- Sajjad, M., Ismail, M., Atta-ur-Rahman,, et al. Generalized and open selection approaches for the population mean: accounting for non-response and measurement error in single-phase sampling. J Stat Theory Appl. 24, 394-411 (2025).
- Dash, S., Biswa, S., Banerjee, D., Rahman, A. Edge and fog computing in healthcare: a review. Scalable Computing: Practice and Experience. 20 (2), 191-205 (2019).
- Hantom, W. H., Rahman, A. Arabic spam tweets classification: A comprehensive machine learning approach. AI. 5 (3), 1049-1065 (2024).
- Arafat, H., Alfeilat, A., Hassanat, A. B. A., Lasassmeh, O., Tarawneh, A. S. Effects of distance measure choice on k-nearest neighbor classifier performance: a review. Big Data. 7 (4), 221-248 (2019).
- Brereton, R. G., Lloyd, G. R. Support vector machines for classification and regression. Analyst. 135 (2), 230-267 (2010).
- Musleh, D. A., Olatunji, S. O., Almajed, A. A., Alghamdi, A. S., Alamoudi, B. K., et al. Ensemble learning based sustainable approach to carbonate reservoirs permeability prediction. Sustainability. 15 (19), 14403(2023).
- Vapnik, V., Golowich, S. E., Ave, M., Hill, M. Support vector method for function approximation, regression estimation, and signal processing. NIPS'96: Proceedings of the 10th International Conference on Neural Information Processing Systems, , 281-287 (1996).
- Noble, W. S. What is a support vector machine? Nat. Biotechnol. 24 (12), 1565-1567 (2006).
- Sharifmousavi, S. S., Borhani, M. S. Support vector machine-based model for diagnosis of multiple sclerosis using the plasma levels of selenium, vitamin B12, and vitamin D3. Informatics Med. Unlocked. 20, 100382(2020).
- Brownlee, J. A Gentle introduction to XGBoost for applied machine learning. , MachineLearningMastery.com (2021).
- Chen, M., Liu, Q., Chen, S., Liu, Y., Zhang, C., et al. XGBoost-based algorithm interpretation and application on post-fault transient stability status prediction of power system. IEEE Access. 7 (1), 13149-13158 (2019).
- Alabbad, D. A., Ajibi, S. Y., Alotaibi, R. B., Alsqer, N. K., Alqahtani, R. A., et al. Birthweight range prediction and classification: a machine learning-based sustainable approach. Mach. Learn. Knowl. Extr. 6 (2), 770-788 (2024).
- Ahmed, M. I. B., Zaghdoud, R. A., Al-Abdulqader, M., Kurdi, M., Altamimi, R., et al. Ensemble machine learning based identification of adult epilepsy. Math. Model. Eng. Probl. 10 (1), 84-92 (2023).
- Manconi, A., Armano, G., Gnocchi, M., Milanesi, L. A soft-voting ensemble classifier for detecting patients affected by COVID-19. Appl. Sci. 12 (1), 7554(2022).
- Gollapalli, M., et al. A novel stacking ensemble for detecting three types of diabetes mellitus using a Saudi Arabian dataset: pre-diabetes, T1DM, and T2DM. Comput. Biol. Med. 147, 105757(2022).
- Rahman, A., Abbas, S., Gollapalli, M., Ahmed, R., Aftab, S., et al. Rainfall prediction system using machine learning fusion for smart cities. Sensors. 22 (9), 3504(2022).
- Alotaibi, S. M., Atta-ur-Rahman,, Basheer, M. I., Khan, M. A. Ensemble machine learning based identification of pediatric epilepsy. Comput. Mat. Contin. 68 (1), 149-165 (2021).
- Adnan Khan, M., Abbas, S., Atta, A., Ditta, A., Alquhayz, H., et al. Intelligent cloud-based heart disease prediction system empowered with supervised machine learning. Comput. Mat. Contin. 65 (1), 139-151 (2020).
- Sharma, R., Mahanti, G. K., Panda, G., Rath, A., Dash, S., et al. Comparative performance analysis of binary variants of FOX optimization algorithm with half-quadratic ensemble ranking method for thyroid cancer detection. Sci. Rep. 13 (1), 19598(2023).
- Ahmed, M. S., Rahman, A., AlGhamdi, F., AlDakheel, S., Hakami, H., et al. Joint diagnosis of pneumonia, COVID-19, and tuberculosis from chest x-ray images: a deep learning approach. Diagn. 13 (15), 2562(2023).
- Dalal, S., Lilhore, U. K., Faujdar, N., et al. Enhancing thyroid disease prediction with improved XGBoost model and bias management techniques. Multimed Tools Appl. 84, 16757-16788 (2025).
- Rahman, A. Solar panel surface defect and dust detection: deep learning approach. J. Imaging. 11 (9), 287(2025).
- Sadek, S. H., Khalifa, W. A., Azoz, A. M. Pulmonary consequences of hypothyroidism. Ann. Thorac. Med. 12 (3), 204-208 (2017).
- Haghbin, M., Razmjooei, F., Abbasi, F., Rouhie, R., Pourabbas, P., et al. Evaluation of the hematological parameters, inflammatory biomarkers, and thyroid hormones in hypothyroidism patients. BMC Res. Notes. 17 (1), 390(2024).
Access restricted. Please log in or start a trial to view this content.