This protocol computes PageRank-based centrality and evaluates targeted interventions in commercial networks by integrating principal component analysis–based directional gain, multi-source edge weighting, and a block-preconditioned Krylov-subspace linear solver to improve numerical stability and reproducibility.
A subscription to JoVE is required to view this content. Sign in or start your free trial.
Method Article
Block-Preconditioned PageRank for Centrality and Intervention Analysis In Commercial Networks
In This Article
Summary
Abstract
Commercial networks are shaped by heterogeneous drivers (e.g., geography, category structure, and operating performance), so a single financial indicator may not reflect a node’s structural role in the overall system. This protocol extracts low-dimensional feature directions using principal component analysis and applies a paired-spectrum consistency check based on a structured symplectic block matrix to improve the reliability of the selected directions. Using these directions, the workflow constructs a weighted directed graph that fuses spatial similarity, business-category synergy, and a directional-gain term derived from feature gradients. Centrality is then computed by solving the PageRank linear system with a block-preconditioned generalized minimal residual method, with explicit convergence and diagnostic checkpoints reported for reproducibility. The workflow is demonstrated on state-level retail aggregates (49 nodes) from a public dataset, where a small number of principal components captures most of the feature variance and supports stable directional weighting. Finally, the protocol evaluates a targeted strong-to-weak intervention by reallocating a quantified fraction of edge weight from high-centrality nodes to low-centrality nodes and recomputing PageRank under the same personalization setting. Overall, this protocol enables users to build an interpretable multi-source commercial network, compute numerically verified PageRank centrality, and test intervention policies with clearly defined diagnostics.
Introduction
Commercial networks (e.g., state-level retail systems and regional business districts) consist of heterogeneous actors that both cooperate and compete. Their interactions are shaped by spatial location, category structure, and directional movement of customers and goods. As a result, single-point indicators (e.g., sales alone) may not objectively reflect a node’s structural role in the network1,2,3. Firms within the same district can differ markedly in scale and operating conditions, and their interactions are further conditioned by spatial context and temporal footfall. Therefore, heuristic indicators and simple sales rankings can be inadequate for characterizing network position and cross-node reinforcement or inhibition3.
Complex-network theory provides a holistic perspective for quantifying node importance. PageRank (PR) estimates importance by simulating a random walk and has been widely used in ranking and diffusion models. Prior work shows that PR can be generalized to weighted settings by replacing the adjacency matrix with a weight matrix and by using node strength rather than degree4. Weighted PR formulations further balance degree- and strength-based contributions through tunable parameters and have been applied to large-scale economic dependency networks5. Mobility- and spending-derived place-to-place dependencies have also been used to construct behavior-based networks that link centrality patterns to urban economic resilience6. Recent studies integrating multi-source urban data highlight that single-indicator rankings often fail to represent multi-factor mechanisms, motivating network constructions that jointly model structure and attributes7. Evidence at business-district granularity similarly suggests that quantity, category diversity, and category structure jointly shape commercial vitality and should be modeled together2. Related analyses connecting centrality to facility patterns and reachability further reinforce the need to capture both relational structure and contextual features in commercial settings8˒9.
Methodologically, the literature points to two practical needs that are often under-addressed in applied commercial-network studies. First, when multivariate attributes are used to construct directional or feature-informed weights, the stability of the extracted directions should be explicitly checked rather than assumed7. Second, centrality computation should report reproducible diagnostic checkpoints (e.g., sparsity/connectivity checks and solver convergence) so results are verifiable beyond a single ranking output4˒5.
Despite this progress, many applied studies still report rankings without (i) an explicit stability check for directional information extracted from multivariate features, (ii) reproducible checkpoints that verify graph sparsity/connectivity and numerical convergence, and (iii) an intervention evaluation that is parameterized and comparable across settings1,2,3. This protocol addresses these gaps by making the full workflow auditable: it extracts low-dimensional feature directions, verifies direction consistency, constructs a multi-source weighted directed graph, and computes PR centrality using a numerically stable block-preconditioned iterative solver with clearly reported diagnostics. It further evaluates a targeted strong-to-weak intervention under a fixed personalization setting to quantify how interventions comparably redistribute centrality.
Compared with PR variants that only reweight edges or add layers, this workflow provides measurable outputs that users can directly verify and compare: (i) an interpretable directional contribution at the edge level, (ii) explicit intermediate diagnostics (variance-explained targets, sparsity/connectivity checks, and solver convergence flags), and (iii) an intervention-effect metric that quantifies changes in PR for specified source/target sets under a fixed personalization setting. This protocol is most appropriate when nodes represent spatially located commercial units (e.g., states, cities, districts, platforms) with coordinates and multivariate operating features, and when the feature space exhibits a stable low-dimensional structure rather than extreme sparsity or low-signal noise.
Access restricted. Please log in or start a trial to view this content.
Protocol
1. Data preparation and normalization
- Import and filter the dataset. Import a public retail orders dataset and retain records from 2014–201718.
- Define nodes. Define the node set V as U.S. states and retain states with sufficient observations so that |V|=49. Let n=|V|.
- Construct node-level feature vectors. For each node i\in V, aggregate transaction records and compute a 16-dimensional feature vector xi∈R16. The feature vector includes sales statistics (total, mean, standard deviation, and range), profit statistics (total, mean, standard deviation, and range), quantity statistics (total, mean, standard deviation), discount statistics (mean and standard deviation), and three additional indicators consisting of profit margin (ProfitMargin), order count (OrderCount), and average profit per order (AvgOrderProfit).
- Deterministic handling of missing values and numerical stabilizer. Replace any missing derived feature entry with 0 and record the number of replacements. Define a fixed stabilizer δ=10-12 for denominators that may approach zero in later computations (used in Equation 4).
- Standardize features. Apply Z-score normalization across nodes to obtain the standardized feature matrix X std∈R49×16.
CHECKPOINT 1: Verify that X_{\text{std}} is 49\times 16 with no missing entries after standardization and confirm that the subsequent class counts sum to 49. - Define sales classes for stratification. Partition nodes into three classes (Low/Medium/High) by tertiles of total sales and record class sizes (Low: 16; Medium: 17; High: 16)¹⁸. Denote class membership by c(i) ∈ {L,M,H}.
2. JRS-validated PCA dimensionality reduction (JRS-PCA)
- Covariance estimation. Compute the covariance matrix C from X_{\text{std}} as follows.
C = cov(Xstd) (1) - Principal component extraction. Compute the first k eigenpairs of C using sparse eigendecomposition and set k = 4 by default.
- Variance explained. Record the variance explained by each principal component and the cumulative variance explained by PCs 1–42.
- PC score representation. For each node i, compute the PC score vector z_i\in\mathbb{R}^k and record (zi,1,zi,2) for visualization in a PC1–PC2 scatter colored by sales class.
- JRS block construction. Construct the JRS-structured symplectic block matrix as follows.
S = diag(C,-C) (2) - Paired-spectrum consistency with explicit matching. Compute eigenvalues of S, partition them into positive and negative sets, sort the positive eigenvalues in descending order and sort the absolute values of the negative eigenvalues in descending order, pair them by index, and compute the maximum pairing deviation \max_j|\lambda^+_j+\lambda^-_j|. This matching rule fixes the implementation detail for reproducibility2.
CHECKPOINT 2: Report the cumulative variance explained by PCs 1–4 and report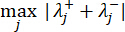 to confirm a stable low-dimensional structure prior to directional gain construction2.
3. Construction of a multi-source weighted directed graph
- Spatial similarity weights. For each ordered pair (i,j), compute the spatial Gaussian kernel weight as follows:
 (3)
(3)
Here pi = (xi,yi) denotes the centroid coordinate of node i and σ is the bandwidth, set to 10.0 by default. - Class-based synergy weights. Define the synergy baseline wsyn(i,j) using the sales-class relation from Step 1.6.
Set wsyn(i,j)=0.6 when c(i) = c(j),setwsyn(i,j)=0.4 when classes are adjacent (Low–Medium or Medium–High), and set wsyn(i,j) = 0.2 when classes are non-adjacent (Low–High). - PCA directional gain. Compute the stabilized unit direction in PC score space by
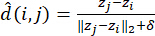 (4)
(4)
with δ=10-12 . Define the nonnegative alignment score along PC1 using the reference direction r = (1,0,…,0)⊤ as
 (5)
(5)
Define the same-class penalty as
 (6)
(6)
and compute the directional-gain weight by
wori(i,j) = β⋅wsyn(i,j) ⋅ g(i,j) ⋅ π(i,j) (7)
with β=1.0. The penalty π(i,j) implements a mild same-class down-weighting to encourage cross-class links while preserving within-class connectivity5. - Weight fusion and self-loop removal. Fuse multi-source weights to form the directed weight matrix
 (8)
(8)
and set diag(Wtotal) = 0 to remove self-loops. - Symmetric inspection matrix (optional). Compute the symmetric proxy matrix
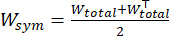 (9)
(9)
for inspection only. - Sparsification with quantitative validation. Retain the top q% of nonzero entries in Wtotal(defaultq=35%) to obtain the sparse directed adjacency matrix Adir. Record nnz(Adir) and density2, and optionally apply the same sparsification rule toWsym to obtain Asym for inspection2.
CHECKPOINT 3: After sparsification, report nnz(Adir) and density, report the number of weakly connected components (target: 1), and check whether any column sums are zero. If zero-sum columns exist, apply dangling-node handling in Step 4.12. If sparsification disconnects the graph, relax the sparsification stringency sequentially from 35% to 30% and then to 25%, repeating the checkpoint after each adjustment.
4. Category-block preconditioned LGMRES PageRank solution
- Column-stochastic transition matrix with dangling-node handling. Compute column sums of Adir and form the diagonal matrix D. For any zero-sum column, replace that column with the personalization vector u before normalization, and form the column-stochastic transition matrix by
Wc = AdirD-1 (10) - PageRank as a linear system. Define PageRank with damping factor α(defaultα=0.85) and personalization vector u by
p = (1-α)u + αWc⊤p (11)
and solve the equivalent linear system
(I-( I -αWc⊤)p = (1 - α)u (12)
(II-withM = I - αWc⊤ andb = (1-α)u. - Category-block right preconditioner. Extract diagonal subblocks of M corresponding to Low/Medium/High classes and assemble a block-diagonal approximation P^{-1} using pseudoinverses for each diagonal subblock. For indices not covered by a block, use the reciprocal of the diagonal entry of M as a diagonal fallback19.
- Iterative solution and diagnostic reporting. Solve Mp = b using a limited-memory generalized minimal residual solver with right preconditioner P-1 , configured as rtol = 1e−6, atol = 0, maxiter = 500, inner_m = 30, outer_k = 319. Record the solver info flag (target: 0), the final relative residual ‖Mp - b‖2/‖b‖2 , and the outer iteration counts19.
- Normalization and validity checks. If small negative values occur, clip them to 0 and record the maximum clipped magnitude, then renormalize so that ∑ipi = 1 .
CHECKPOINT 4: Report info, report ‖Mp - b‖2/‖b‖2 , report , and report ∑ipi as reproducibility diagnostics rather than qualitative statements¹⁹.
5. Intervention experiment and result comparison
- Source and target selection. Using a fixed personalization vector u, define the top three nodes by baseline p as the source set S and the bottom three nodes as the target set T, and record the selected nodes2.
- Intervention strength with a cap constraint. Choose ε in[0.05,0.15] such that the injected weight from each source node does not exceed 10% of that node’s original outgoing weight sum after sparsification, and record ε along with the injected-to-original ratio per source node2.
- Deterministic edge-weight update. Compute the mean positive edge weight
 in Adir
, then update each ordered pair (s,t) with s ∈ Sandt ∈ T by
A'dir(s,t) = Adir(s,t) + εw (13)
and recompute W_c from A'_{\text{dir}} as in Step 4.1 while keeping α and u unchanged. - Recompute PageRank and quantify change. Repeat Steps 4.2–4.5 to obtain p', compute Δp=p'-p , and report absolute and relative changes for nodes in S and T2. Verify that solver diagnostics remain within targets (info = 0; residual ≤ rtol) after intervention2.
CHECKPOINT 5: Report \varepsilon, report injected-to-original ratio per source node, report solver info and residual before and after intervention, and report a Δ p summary for S and T2.
Access restricted. Please log in or start a trial to view this content.
Results
Experimental conditions and data
All analyses were run on a desktop computer with a Windows operating system. The workflow was implemented in Python 3.12 using NumPy, Pandas, SciPy, and Matplotlib, and the random seed was fixed at 2025 to support reproducibility18. A public retail orders dataset was filtered to retain records from 2014–201722. Orders were aggregated to the state level to define 49 nodes (U.S. states with sufficie...
Access restricted. Please log in or start a trial to view this content.
Discussion
This protocol provides a reproducible workflow for assessing centrality and evaluating targeted interventions in state-level commercial networks by integrating multi-source weighted graph construction, PCA-derived directional gain, and a category-block preconditioned LGMRES PageRank solver18˒23. Rather than presenting centrality as a single ranking output, the workflow foregrounds intermediate diagnostics—variance-explained checks, sparsity/connectivit...
Access restricted. Please log in or start a trial to view this content.
Disclosures
The authors have nothing to disclose.
Acknowledgements
The authors thank the public data providers for making the dataset used in this protocol available. The authors also acknowledge the computing resources and technical support provided by the authors’ institution. No external funding was received for this work.
Access restricted. Please log in or start a trial to view this content.
Materials
| Name | Company | Catalog Number | Comments |
|---|---|---|---|
| Matplotlib | Matplotlib Development Team | v3.8+ Figure generation and visualization of centrality/intervention results | |
| NumPy | NumPy Developers | v1.26+ Numerical array operations and matrix computation | |
| Pandas | Pandas Development Team | v2.2+ Data cleaning, aggregation, and tabular data management | |
| Python | Python Software Foundation | v3.12 Core programming environment for data processing and model execution | |
| SciPy | SciPy Community | v1.13+ Sparse linear algebra and iterative solver support (e.g., LGMRES) |
References
- Zhang, Y., Wang, M., Yang, X., Zhang, R. Urban commercial space vitality evaluation method based on social media data: The case of Shanghai. Land. 14 (4), 697(2025).
- Ji, Y., Wang, Z., Zhu, D. Exploring the impact of urban amenities on business circle vitality using multi-source big data. Land. 13 (10), 1616(2024).
- Chen, H., Ge, J., He, W. Quantifying urban vitality in Guangzhou through multi-source data: A comprehensive analysis of land use change, streetscape elements, POI distribution, and smartphone-GPS. Land. 14 (6), 1309(2025).
- Gómez, S. Centrality in networks: Finding the most important nodes. Business and Consumer Analytics: New Ideas. , Springer International Publishing. Cham. 401-433 (2019).
- Zhang, P., Wang, T., Yan, J. PageRank centrality and algorithms for weighted, directed networks. Physica A: Statistical Mechanics and its Applications. 586, 126438(2022).
- Yabe, T., García Bulle Bueno, B., Frank, M. R., Pentland, A., Moro, E. Behaviour-based dependency networks between places shape urban economic resilience. Nature Human Behaviour. 9 (3), 496-506 (2025).
- Xie, Y., et al. Integrating multi-source urban data with interpretable machine learning for uncovering the multidimensional drivers of urban vitality. Land. 13 (12), 2028(2024).
- Lee, Y., Seo, D. Identifying relationship between regional centrality and POI facilities: A case study of Seoul metropolitan area. ISPRS International Journal of Geo-Information. 13 (1), 12(2024).
- Poudyal, B., Ghoshal, G., Kirkley, A. Characterizing network circuity among heterogeneous urban amenities. Journal of the Royal Society Interface. 20 (208), 20230296(2023).
- Zeng, J., Wu, Y., Liu, J., He, D., Lan, Z. Identification of critical nodes in power grid based on improved PageRank algorithm and power flow transfer entropy. Electronics. 13 (1), 184(2024).
- Improved PageRank algorithm-based vulnerable lines identification considering the impact of natural gas system. Hu, T., Hu, S., Nan, L. Proceedings of the 7th International Conference on Mechatronics and Computer Technology Engineering (MCTE), , 864-869 (2024).
- Li, J., Lin, Y., Su, Q. Identifying critical nodes in power grids containing renewable energy based on electrical spreading probability. International Journal of Electrical Power & Energy Systems. 154, 109431(2023).
- Miller, B., Alderson, A., Eubank, S. Multi-layer network PageRank for critical infrastructure analysis. Homeland Security Affairs. 20 (4), 23189(2024).
- Aleja, D., Flores, J., Primo, E., Romance, M. Time-dependent personalized PageRank for temporal networks: Discrete and continuous scales. Chaos: An Interdisciplinary Journal of Nonlinear Science. 34 (8), 083145(2024).
- Mariani, M. S., Medo, M., Zhang, Y. -C. Ranking nodes in growing networks: When PageRank fails. Scientific Reports. 5 (1), 16181(2015).
- Aleja, D., Criado, R., García del Amo, A. J., Pérez, Á, Romance, M. Non-backtracking PageRank: From the classic model to Hashimoto matrices. Chaos, Solitons & Fractals. 126, 283-291 (2019).
- Contreras-Aso, G., Criado, R., Romance, M. Can the PageRank centrality be manipulated to obtain any desired ranking. Chaos. 33 (8), 083152(2023).
- Flores, J., García, E., Pedroche, F., Romance, M. Parametric controllability of the personalized PageRank: Classic model vs biplex approach. Chaos. 30 (2), 023115(2020).
- Li, Z., Tang, J., Zhao, C., Gao, F. Improved centrality measure based on the adapted PageRank algorithm for urban transportation multiplex networks. Chaos, Solitons & Fractals. 167, 112998(2023).
- Opricovic, S., Tzeng, G. -H. Defuzzification within a multicriteria decision model. International Journal of Uncertainty, Fuzziness and Knowledge-Based Systems. 11 (5), 635-652 (2003).
- Wilkinson, M. D., et al. The FAIR guiding principles for scientific data management and stewardship. Scientific Data. 3 (1), 1-9 (2016).
- Sample superstore, sample data. Tableau Public. , Tableau Software. https://public.tableau.com/app/learn/sample-data (2025).
- Peng, R. D. Reproducible research in computational science. Science. 334 (6060), 1226-1227 (2011).
- Langville, A. N., Meyer, C. D. Google’s PageRank and Beyond: The Science of Search Engine Rankings. , Princeton University Press, Princeton. (2006).
- Saad, Y. Iterative Methods for Sparse Linear Systems. , SIAM. Philadelphia. (2003).
- Jolliffe, I. T., Cadima, J. Principal component analysis: A review and recent developments. Philosophical Transactions of the Royal Society A: Mathematical, Physical and Engineering Sciences. 374 (2065), 20150202(2016).
- Mehrmann, V. L. The Autonomous Linear Quadratic Control Problem: Theory and Numerical Solution. , Springer. Berlin. (1991).
- Graph sparsification by effective resistances. Spielman, D. A., Srivastava, N. Proceedings of the 40th Annual ACM Symposium on Theory of Computing, , 563-568 (2008).
- Boldi, P., Santini, M., Vigna, S. PageRank: Functional dependencies. ACM Transactions on Information Systems. 27 (4), 1-23 (2009).
- Topic-sensitive PageRank. Haveliwala, T. H. Proceedings of the 11th International Conference on World Wide Web, , 517-526 (2002).
- Gleich, D. F. PageRank beyond the web. SIAM Review. 57 (3), 321-363 (2015).
- Baker, A. H., Jessup, E. R., Manteuffel, T. A. technique for accelerating the convergence of restarted GMRES. SIAM Journal on Matrix Analysis and Applications. 26 (4), 962-984 (2005).
- Kuhn, M., Johnson, K. Feature Engineering and Selection: A Practical Approach for Predictive Models. , Chapman and Hall/CRC. (2019).
- Wainwright, M. J. High-Dimensional Statistics: A Non-Asymptotic Viewpoint. , Cambridge University Press. (2019).
- Silverman, B. W. Density Estimation for Statistics and Data Analysis. , Routledge. (2018).
- Saltelli, A., et al. Global Sensitivity Analysis: The Primer. , John Wiley & Sons. (2008).
- Aral, S., Nicolaides, C. Exercise contagion in a global social network. Nature Communications. 8 (1), 14753(2017).
- Berkhin, P. A survey on PageRank computing. Internet Mathematics. 2 (1), 73-120 (2005).
- Kivelä, M., et al. Multilayer networks. Journal of Complex Networks. 2 (3), 203-271 (2014).
- Holme, P., Saramäki, J. Temporal Network Theory. , Springer. 1-24 (2019).
- Linden, G., Smith, B., York, J. Amazon.com recommendations: Item-to-item collaborative filtering. IEEE Internet Computing. 7 (1), 76-80 (2003).
- Wu, Z., et al. A comprehensive survey on graph neural networks. IEEE Transactions on Neural Networks and Learning Systems. 32 (1), 4-24 (2020).
- Stodden, V. Reproducing statistical results. Annual Review of Statistics and Its Application. 2 (1), 1-19 (2015).
Access restricted. Please log in or start a trial to view this content.