This study identifies reduced gut microbiota diversity and altered metabolic pathways in type 2 diabetes (T2DM), highlighting increased proteobacteria and decreased beneficial taxa, suggesting that microbial dysbiosis is associated with T2DM and may contribute to its pathophysiology.
Research Article
Gut Microbiota and Metabolomic Changes In Type 2 Diabetes Mellitus: Insights From 16S rDNA Sequencing and Bioinformatics
1Department of the 2nd Clinical Medicine, Chongqing Medical University, 2Department of the 1st Clinical Medicine, Chongqing Medical University, 3Department of Respiratory Endocrinology, School of Clinical Medicine, Chongqing Medical and Pharmaceutical College, 4Laboratory of Innovation, Basic Medical Experimental Teaching Center, Chongqing Medical University
Opens in a new tab
In This Article
Summary
Loading...
$$\rightleftharpoonup{xx}$$
$$\longleftharp{xx}$$,
$$\longrightharp{xx}$$,
Abstract
Loading...
$$\rightleftharpoonup{xx}$$
$$\longleftharp{xx}$$,
$$\longrightharp{xx}$$,
The global rise in type 2 diabetes mellitus (T2DM) underscores the need to better understand its underlying biological mechanisms, particularly those involving host–microbiome interactions. This study aimed to characterize gut microbial diversity, taxonomic composition, and predicted metabolic pathways in newly diagnosed T2DM patients compared with the non-diabetic matched (NM) group. Fresh stool samples were analyzed using 16S rDNA sequencing. Alpha diversity (Chao, ACE, Shannon, and Simpson indices) and beta diversity were calculated to assess microbial community structure. Taxonomic differences were evaluated using Wilcoxon rank-sum tests and linear discriminant analysis effect size (LEfSe). Functional pathway prediction was performed using phylogenetic investigation of communities by reconstruction of unobserved states (PICRUSt2) based on KEGG and MetaCyc annotations. Mendelian randomization (MR) analysis, including inverse-variance weighting, MR-Egger, and weighted median methods, was applied to assess genetically predicted associations between microbial taxa and T2DM. Results showed reduced microbial richness, as reflected by lower Chao and ACE indices, and altered diversity structure, as reflected by lower Shannon and higher Simpson indices, in T2DM patients, accompanied by significant compositional shifts. Increased relative abundance of Proteobacteria and decreased abundance of beneficial taxa such as Lachnospiraceae and Blautia were observed. Functional prediction indicated reduced abundance of pathways related to the non-oxidative pentose phosphate pathway, isobutanol biosynthesis, and L-isoleucine biosynthesis. MR analysis provided complementary evidence supporting associations between specific microbial taxa and T2DM susceptibility. In conclusion, T2DM is associated with reduced microbial richness, altered diversity structure, and distinct taxonomic and functional changes. These findings highlight the relevance of gut microbiota in T2DM and support the potential utility of microbiome-based biomarkers and therapeutic strategies. Further studies are required to validate these findings and clarify underlying mechanisms.
Introduction
Loading...
$$\rightleftharpoonup{xx}$$
$$\longleftharp{xx}$$,
$$\longrightharp{xx}$$,
Type 2 diabetes mellitus (T2DM) has become one of the fastest-growing chronic diseases worldwide, driven by rapid urbanization, Westernized dietary patterns, and increasingly sedentary lifestyles1,2. It is a major contributor to global morbidity and mortality and imposes a substantial public health burden3. Although genetic susceptibility plays a role, the rapid rise in T2DM incidence highlights the importance of environmental and metabolic determinants4. Identifying modifiable biological mechanisms is therefore essential for improving early detection and prevention strategies. Recent advances have identified the gut microbiota as a key regulator of metabolic homeostasis5. The intestinal microbial ecosystem influences glucose metabolism, immune function, intestinal barrier integrity, and chronic low-grade inflammation, all of which are central to the pathogenesis of T2DM6. Dysbiosis has been associated with obesity, insulin resistance, endotoxemia, and altered energy balance, suggesting a mechanistic link between microbial alterations and disease progression7. In addition, microbial metabolites, including short-chain fatty acids, bile acids, and branched-chain amino acids, have been implicated in modulating insulin sensitivity and host metabolism8.
While accumulating evidence supports the role of the gut microbiome in T2DM, most existing studies rely on observational designs, which limit causal inference. Alternative approaches, such as shotgun metagenomics and targeted metabolomics, can provide higher-resolution functional insights but are often constrained by cost, computational complexity, and limited feasibility in exploratory or pilot-scale studies. In contrast, 16S rDNA sequencing is a cost-effective, widely adopted method for profiling microbial community composition, although its taxonomic resolution is limited to the species level and it cannot directly quantify functional metabolites. Therefore, 16S rDNA sequencing was selected for this study as a cost-effective, scalable approach suitable for exploratory clinical cohorts, while enabling integration with downstream functional prediction and complementary analytical frameworks. Therefore, integrating 16S-based microbial profiling with bioinformatics functional prediction and complementary approaches such as Mendelian randomization (MR) may provide a balanced framework for exploring both compositional and potentially causal relationships.
Notably, there remains a relative lack of data focusing specifically on newly diagnosed, treatment-naïve T2DM patients. In such populations, microbial alterations are less likely to be confounded by pharmacological interventions, particularly metformin, which is known to significantly reshape gut microbiota composition and function9. This represents an important gap in the current literature, as many existing studies include heterogeneous patient populations with varying treatment exposures and limited integration of microbiome profiling with genetically informed analytical approaches.
In this context, the present study aimed to characterize gut microbiota diversity, taxonomic composition, and predicted functional pathways in newly diagnosed T2DM patients compared with the NM group, using 16S rDNA sequencing and bioinformatics analysis. In addition, Mendelian randomization was applied using publicly available genome-wide association data to explore potential genetically predicted associations between specific microbial taxa and T2DM risk. This combined analytical strategy allows complementary insights from microbial community profiling and population-level genetic data. Specifically, 16S rDNA sequencing provides direct characterization of microbial composition in the study population, whereas Mendelian randomization leverages genetic instruments from independent cohorts to assess whether observed associations are consistent with genetically predicted relationships. This integration is intended to address a key limitation of observational microbiome studies by providing complementary evidence that supports the robustness of microbiota–T2DM associations. Therefore, integrating these approaches is intended to provide cross-validation rather than redundancy, thereby strengthening the interpretability of microbiota–T2DM associations.
The present study focuses on three aspects. First, it evaluates gut microbiota alterations in newly diagnosed, treatment-naïve T2DM patients to reduce confounding from pharmacological interventions. Second, it integrates taxonomic profiling with predicted functional pathways to provide a systems-level view of microbiota-associated metabolic changes. Third, it incorporates Mendelian randomization analysis to assess whether observed associations are consistent with genetically predicted relationships, thereby providing methodological triangulation. Collectively, these aspects provide a complementary and reproducible framework for microbiome analysis rather than a purely descriptive study, distinguishing this work from prior studies that typically rely on single-method observational designs and do not integrate microbial profiling, functional prediction, and genetically informed inference within a unified analytical framework.
Protocol
Loading...
$$\rightleftharpoonup{xx}$$
$$\longleftharp{xx}$$,
$$\longrightharp{xx}$$,
All procedures involving human participants were reviewed and approved by the Ethics Committee of Chongqing Chenjiaqiao Hospital (approval No. 20240131). Written informed consent was obtained from all participants before sample collection. All stool samples and participant information were handled using de-identified study codes, as listed in the Table of Materials.
Participant screening and enrollment
Newly diagnosed patients with T2DM who visited Chongqing Chenjiaqiao Hospital between June 2023 and December 2023 were screened for eligibility. Participants were enrolled in the DM group if they were between 20 and 65 years of age, had a new diagnosis of T2DM, agreed to provide a fresh stool sample, and completed the required medical history assessment and clinical examinations. Healthy volunteers recruited during the same period were included as the non-diabetic matched (NM) group and were matched to the DM group as closely as possible with respect to age, sex, and general demographic characteristics. Participants were excluded if they had hematological disorders, central nervous system diseases, active rheumatic disease, autoimmune disease, acute or chronic gastrointestinal infection, chronic diarrhea, constipation, active or healing gastrointestinal ulcer, inflammatory bowel disease, irritable bowel syndrome, intestinal tuberculosis, gastrointestinal tumors, other malignancies, severe cardiac insufficiency, severe hepatic insufficiency, severe renal insufficiency, other severe metabolic diseases, malnutrition, immunodeficiency, congenital metabolic disorders, psychiatric illness, sedative-hypnotic use, or drug abuse. Participants were also excluded if they had received antibiotics, acid-suppressing agents, gastrointestinal motility drugs, probiotics, glucocorticoids, or immunosuppressants within 1 month before stool collection. In addition, individuals who had experienced diarrhea, undergone gastrointestinal surgery or gastrointestinal endoscopy, or reported sudden changes in living environment or dietary habits within 1 month before stool collection were excluded. A unique study code was assigned to each eligible participant before sample collection. From the eligible cohort, 12 newly diagnosed T2DM and 12 NM participants were selected for downstream 16S rDNA sequencing and microbiome analyses based on sample availability and sequencing quality requirements.
Stool sample collection and storage
Each participant was provided with a sterile stool collection container labeled only with the assigned study code to ensure de-identification. Participants were instructed to empty their bladders before defecation to minimize urine contamination and to collect fresh stool directly into the sterile container without contact with toilet water, urine, disinfectants, or other potential contaminants. Immediately after collection, approximately 1–2 g of stool was transferred into a sterile cryogenic tube using a sterile disposable sampling spoon. The tube was tightly sealed and immediately placed on dry ice or in a pre-cooled transfer container. All samples were transported to the laboratory within 2 h of collection. Upon arrival at the laboratory, the study code was verified, and each tube was inspected for leakage or visible contamination. Collection and storage times were recorded for all samples. Stool samples were subsequently stored at −80 °C until genomic DNA extraction. Samples were considered acceptable for downstream analysis only if they remained completely frozen during storage and transport and showed no evidence of tube leakage or external contamination.
Genomic DNA extraction
Stool samples were removed from −80 °C storage and placed on ice prior to processing. Each sample was thawed only until homogenization was possible to minimize degradation associated with repeated freeze–thaw cycles. Approximately 200 mg of stool was transferred into a sterile microcentrifuge tube, and the lysis buffer provided in the stool DNA extraction kit was added according to the manufacturer’s instructions listed in the Table of Materials. Samples were vortexed vigorously for 30 s to achieve complete homogenization and then incubated at room temperature for 5–10 min to facilitate cell lysis. Following lysis, samples were centrifuged at 12,000 × g. for 10 min at 4 °C. The supernatant was carefully transferred to a new sterile microcentrifuge tube without disturbing the pellet. Genomic DNA was subsequently eluted using the elution buffer supplied with the kit or nuclease-free water according to the manufacturer’s protocol. Extracted DNA was stored at −20 °C for short-term use or at −80 °C for long-term preservation. DNA samples considered suitable for downstream analysis appeared clear and free of visible particulate material.
DNA quality assessment
DNA quality was assessed using agarose gel electrophoresis and fluorescence-based quantification. A 1% agarose gel was prepared in electrophoresis buffer, and the extracted DNA samples, mixed with loading buffer, were loaded into the gel wells. Electrophoresis was performed until the DNA bands were adequately separated, after which the gel was examined under ultraviolet or blue-light illumination. DNA integrity was considered acceptable when an intact genomic DNA band was observed without marked degradation or excessive smearing. DNA concentration was subsequently quantified using a fluorescence-based DNA quantification system. Samples were then diluted to the concentration required for downstream PCR amplification. High-quality DNA samples typically exhibited a distinct band on agarose gel electrophoresis and were sufficiently concentrated for subsequent amplification procedures.
PCR amplification of the 16S rDNA V3–V4 region
The V3–V4 hypervariable region of bacterial 16S rDNA was amplified using barcoded primers. The primer sequences were as follows: forward primer 5′-ACTCCTACGGGAGGCAG-3′ and reverse primer 5′-GGACTACHVGGGTWTCTAAT-3′. PCR reactions were prepared on ice in a final volume of 20 µL containing 4 µL of PCR buffer, 2 µL of nucleotide mixture (2.5 mmol/L), 0.8 µL each of forward and reverse primers (5 µmol/L), 0.4 µL of high-fidelity DNA polymerase, 10 ng of template DNA, and nuclease-free water to volume. Reaction mixtures were gently mixed by pipetting and briefly centrifuged to collect the liquid at the bottom of the tube. PCR amplification was performed using the following cycling conditions: initial denaturation at 95 °C for 5 min, followed by 25 cycles of denaturation at 95 °C for 30 s, annealing at 55 °C for 30 s, and extension at 72 °C for 30 s, with a final extension step at 72 °C for 10 min. To minimize amplification bias, each sample was amplified in triplicate reactions, and the resulting PCR products from the same sample were subsequently pooled into a single tube. Successful amplification was confirmed by the presence of a clear amplicon band of the expected size on agarose gel electrophoresis.
PCR product verification and purification
PCR products were verified using 2% agarose gel electrophoresis. The combined PCR products from each sample were loaded onto the gel and electrophoresed until the target amplicon bands were clearly separated. Bands corresponding to the expected amplicon size were excised using a clean sterile blade and purified with a gel extraction kit according to the manufacturer’s instructions listed in the Table of Materials. Purified PCR products were subsequently eluted in elution buffer or nuclease-free water. The concentration of each purified PCR product was quantified using a fluorescence-based DNA quantification system, and the concentration values were recorded for downstream library preparation. Successful amplification and purification were confirmed by a single, clear band at the expected amplicon size on agarose gel electrophoresis.
Library preparation and pooling
Sequencing libraries were prepared using a DNA library preparation kit according to the manufacturer’s instructions listed in the Table of Materials. Sequencing adapter sequences were ligated to the purified amplicons following the standard library preparation workflow. Adapter-ligated products were subsequently purified using either gel extraction or a bead-based purification method, depending on the selected library preparation protocol. Purified library products were evaluated using 2% agarose gel electrophoresis to confirm appropriate fragment distribution. Library concentrations were quantified using a fluorescence-based DNA quantification system. Based on DNA concentration and fragment size, each library was normalized to the same molar concentration to ensure balanced sequencing depth across samples. Equal molar amounts of individual libraries were then pooled at a 1:1 ratio to generate the final sequencing library pool. Prior to sequencing, the pooled library was denatured according to the sequencing platform protocol before sample loading. Libraries considered suitable for sequencing exhibited a clear fragment distribution within the expected size range and sufficient concentration for downstream sequencing analysis.
Paired-end sequencing
The final pooled library was loaded onto a paired-end sequencing platform according to the manufacturer’s standard operating procedures. Paired-end sequencing was performed using either a 2 × 250 bp or 2 × 300 bp run configuration to ensure adequate sequencing depth for comprehensive characterization of microbial diversity in each sample. Sequencing quality was monitored throughout the run using platform-generated quality metrics. Following completion of sequencing, raw paired-end FASTQ files were exported for each sample for downstream bioinformatics analysis. Sequencing datasets were considered acceptable when they demonstrated sufficient read depth per sample, appropriate Q30 quality scores, and successful barcode assignment.
Raw sequence processing
Raw paired-end FASTQ files were imported into a microbiome bioinformatics analysis pipeline for downstream processing. Sequences were demultiplexed based on the barcodes assigned to each sample. Quality filtering was subsequently performed to remove reads containing low-quality scores, ambiguous bases, or sequencing artifacts. Low-quality bases located at the ends of reads were trimmed based on quality score distribution to improve overall sequence reliability. After quality control, paired-end reads were merged across overlapping regions to reconstruct full-length sequences. Only high-quality merged sequences were retained for subsequent microbiome analyses.
Amplicon sequence variant (ASV) generation and taxonomic annotation
Sequence denoising was performed using a validated denoising algorithm, including DADA2 or Deblur, to correct sequencing errors and improve sequence accuracy. Chimeric sequences were identified and removed during the denoising process. Representative ASV sequences and corresponding ASV abundance tables were subsequently generated for each sample. Taxonomic assignment of ASV sequences was performed using a Naive Bayes classifier, and taxonomic annotation was conducted against the SILVA 138 reference database. Taxonomic abundance tables were exported at the phylum, family, and genus levels for downstream analysis. The final ASV dataset included representative sequences, abundance information, and corresponding taxonomic annotations for each sample.
Alpha and beta diversity analysis
Alpha diversity indices, including Chao, ACE, Shannon, Simpson, and Coverage indices, were calculated to evaluate within-sample microbial diversity and richness. Alpha diversity indices were expressed as mean ± standard deviation. Data normality was assessed using the Shapiro–Wilk test. Normally distributed variables were compared between the DM and NM groups using Student’s t-tests, whereas non-normally distributed variables were analyzed using Wilcoxon rank-sum tests. Beta diversity distances were subsequently calculated using a suitable distance matrix to evaluate differences in microbial community composition between samples. Principal coordinates analysis (PCoA) was performed to visualize differences in microbial community structure between groups. In addition, analysis of similarities (ANOSIM) was conducted to determine whether intergroup differences exceeded intragroup variation, and the corresponding ANOSIM R and p values were reported. Alpha diversity analysis reflected within-sample microbial diversity, whereas beta diversity analysis evaluated differences in microbial community composition between groups.
Differential taxonomic analysis
Microbial community composition was summarized at the phylum, family, and genus levels. Stacked bar plots were generated to visualize the relative abundance of dominant taxa across individual samples and study groups. Pan/Core curves and Venn diagrams were further constructed to compare shared and group-specific ASVs between the DM and NM groups. Differences in taxon abundance between groups were evaluated using Wilcoxon rank-sum tests. LEfSe analysis was subsequently performed to identify microbial taxa that contributed most strongly to intergroup discrimination. Differential taxonomic analysis enabled the identification of microbial taxa enriched in either the DM or NM group.
Functional prediction
PICRUSt2 or an equivalent validated functional prediction pipeline was used to infer microbial functional pathways from 16S rDNA sequencing profiles. ASV abundance data were normalized according to the requirements of the selected analytical pipeline, and predicted functions were mapped to KEGG or MetaCyc pathway annotations. Predicted pathway abundances were subsequently compared between the DM and NM groups. Significantly different pathways were visualized using heatmaps or other appropriate graphical approaches. Predicted functions were interpreted as inferred microbial metabolic potential rather than directly measured metabolite abundance. Functional prediction analysis enabled the identification of candidate microbial pathways that differed between groups, including pathways associated with carbohydrate and amino acid metabolism.
Mendelian randomization analysis
Genome-wide association study (GWAS) summary statistics for gut microbiota were obtained from publicly available datasets10. Genome-wide significant association data for microbial taxa were retrieved from the NHGRI-EBI GWAS Catalog (https://www.ebi.ac.uk/gwas/) using accession numbers ranging from GCST90032172 to GCST90032644. Additional metagenomic data were accessed from the FINRISK 2002 cohort through the European Genome-Phenome Archive (Research ID: EGAS00001005020). GWAS summary statistics for type 2 diabetes mellitus were also obtained from the NHGRI-EBI GWAS Catalog (accession number: ebi-a-GCST006867). Genetic variants associated with microbial taxa were selected as instrumental variables according to predefined statistical thresholds, and variants in linkage disequilibrium were excluded. Exposure and outcome datasets were harmonized to ensure consistent allele orientation. Mendelian randomization analysis was subsequently performed using the inverse variance weighted (IVW) method as the primary analytical approach. Sensitivity analyses were conducted using the MR-Egger and weighted median methods. Instrument strength was evaluated using F-statistics, whereas heterogeneity among instrumental variables was assessed using Cochran’s Q test. Horizontal pleiotropy was examined using the MR-Egger intercept test. Bonferroni correction was applied to account for multiple comparisons. Mendelian randomization findings were interpreted as genetically predicted associations rather than definitive evidence of causality.
Data output and endpoint
Final analytical outputs included ASV abundance tables, taxonomic composition plots, alpha diversity metrics, beta diversity analyses, differential taxonomic results, predicted functional pathway profiles, and Mendelian randomization estimates. All sample identifiers in the sequencing datasets were verified to ensure consistency with the corresponding de-identified study codes. Raw sequencing files, processed ASV tables, statistical outputs, and figure source files were archived for downstream analysis and data management. The protocol was considered complete once high-quality sequencing data, taxonomic profiles, diversity metrics, predicted functional pathway analyses, and Mendelian randomization results had been successfully generated and verified.
Results
Loading...
$$\rightleftharpoonup{xx}$$
$$\longleftharp{xx}$$,
$$\longrightharp{xx}$$,
Baseline demographic and clinical characteristics of the initially screened clinical cohort are presented in Table 1. A representative subgroup consisting of 12 newly diagnosed T2DM and 12 NM participants was subsequently selected for 16S rDNA sequencing and downstream microbiome analyses.
Sequencing depth evaluation
The Shannon index was calculated, and the rarefaction curve was plotted to assess the sequencing depth. A total of 1,064,930 sequences were detected across all samples, covering 4,770 ASVs, indicating high community richness. All the curves were flattened, suggesting that the sequencing data volume was adequate and reflected the major bacterial communities present in the samples (Figure 1).
Microbial (alpha) diversity analysis
Alpha diversity of the gut microbiota was evaluated using the Chao, Ace, Shannon, Simpson, and Coverage indices. These indices were expressed as mean ± standard deviation. Data normality was assessed using the Shapiro-Wilk test. Normally distributed variables were compared between the DM and NM groups using Student’s t-tests, whereas non-normally distributed variables were analyzed using Wilcoxon rank-sum tests (Table 2). The data indicated that the Chao, Ace, and Shannon indices were lower in the DM group than in the NM group, whereas the Simpson index was higher, suggesting significantly reduced gut microbiota diversity in DM patients (p. < 0.05). The Coverage indices for both groups were > 0.999, indicating that the coverage rate for each sample was > 99.90%, reflecting the true microbial communities. Coverage indices were not subjected to between-group hypothesis testing because all values exceeded 0.999.
Community composition analysis
The ASV species classification method was employed to denoise and transform the acquired raw sequences, which were then compared with the corresponding species annotation database [annotation method: classify-sklearn (Naive Bayes); database: silva138/16s_bacteria]. This provided the composition and abundance data of the microbial communities in the samples, which were plotted as Pan/Core curves and Venn diagrams (Figures 2 and 3). Community composition was analyzed at the phylum, family, and genus levels, with histograms plotted for multiple samples.
ASV distribution: The pan/core species analysis revealed that the microbial richness at the ASV level was higher in the NM group than in the DM group (Figure 2). Venn diagram analysis indicated that both groups shared 394 common ASVs, while 2928 were specific to the NM group and 1448 were specific to the DM group (Figure 3), suggesting that specific ASVs were significantly higher in the NM group.
Distribution of microbial community at different levels: At the phylum level, 13 phyla were detected across the 24 samples (Table 3). Chloroflexi and Campilobacterota were only detected in the NM samples, while Gemmatimonadota was only identified in the DM samples. Furthermore, Firmicutes, Proteobacteria, Bacteroidota, and Actinobacteriota were observed in all the samples (Figure 4). Figure 5 indicates the hierarchical clustering of the distance matrix. The NM and DM samples were divided into two groups (A and B), where Group B included both NM and DM samples, and the remaining DM samples were clustered in Group A. The community bar chart (Figure 6) indicated that the most dominant phylum in Group A was Proteobacteria, while in Group B, it was Firmicutes, except for the sample DM-9, which had 46.07% Proteobacteria and 40.81% Firmicutes. Moreover, in the NM group, Firmicutes was the most dominant phylum, followed by Bacteroidota, whereas in the DM group, Proteobacteria and Firmicutes were the dominant and subdominant phyla, respectively.
At the family and genus levels, a total of 111 families and 306 genera were detected across all 24 samples. Wilcoxon rank-sum tests revealed that Escherichia, Shigella, and Blautia showed the greatest differences between the two groups (Figure 7). Moreover, LEfSe analysis indicated that classified (Escherichia and Shigella) and unclassified Enterobacteriaceae were predominant in the DM group, while Lachnospiraceae (Blautia) and Propionibacteriaceae. were predominant in the NM group (Figure 8).
Intergroup (beta) diversity analysis
Non-parametric analysis of similarities (ANOSIM) was performed to determine the significance of group differentiation (Table 4). The data revealed R = 0.6836, p = 0.001, indicating that the intergroup differences were more significant than the intragroup differences, thus confirming the significance of the grouping. Furthermore, the principal coordinates analysis (PCoA) was carried out to examine the gut microbiota's community structure and its similarities or differences among the samples (Figure 9). The results revealed significant variabilities between the gut microbiota of the NM and DM groups.
PICRUSt functional prediction
PICRUSt functional prediction revealed that the DM group had significantly reduced gut microbiota abundance in the non-oxidative branch of the pentose phosphate pathway (NONOXIPENT-PWY), the pathway involved in isobutanol biosynthesis (PWY-7111), and the L-isoleucine biosynthesis pathway (PWY-5101) (Figure 10).
Mendelian randomization analysis
This study compared the results of Mendelian randomization analysis with the bioinformatics findings from clinical samples, focusing on three dominant phyla: Firmicutes, Bacteroidota, and Proteobacteria. The taxonomic trees of each microbial classification were examined using the Taxonomy Browser tool from NCBI (https://www.ncbi.nlm.nih.gov/Taxonomy/Browser/wwwtax.cgi). The data identified 2 families, 2 genera, and 1 species in Firmicutes, 2 genera and 2 species in Bacteroidota, and 1 order, 1 family, and 2 genera in Proteobacteria (Tables 5–7). Furthermore, no horizontal pleiotropy was observed among the three phyla. Although there was some heterogeneity in Firmicutes, the random-effects model (Inverse Variance Weighted, IVW) minimized its impact on the analysis. Therefore, the conclusions were primarily based on the IVW method. Within the phyla Firmicutes, 2 family-level taxa were negatively associated with T2DM, where Paenibacillales showed heterogeneity in both the MR Egger and IVW methods. At the genus level, T2DM was negatively associated with Faecalicoccus, whereas it was positively associated with Kineothrix. At the species level, T2DM was positively associated with Clostridium tertium. Within Bacteroidota, only Bacteroides A plebeius at the species level was positively associated with T2DM, while the remaining taxa indicated a negative association. In addition, all the taxa in Proteobacteria were positively associated with T2DM.
DATA AVAILABILITY:
The raw sequencing data, processed ASV tables, statistical analysis outputs, source data used for figure generation, and related supplementary materials supporting the findings of this study have been provided as supplementary raw data files during submission. Publicly available datasets used for Mendelian randomization analysis were obtained from the NHGRI-EBI GWAS Catalog and the European Genome-Phenome Archive as described in the Methods section.
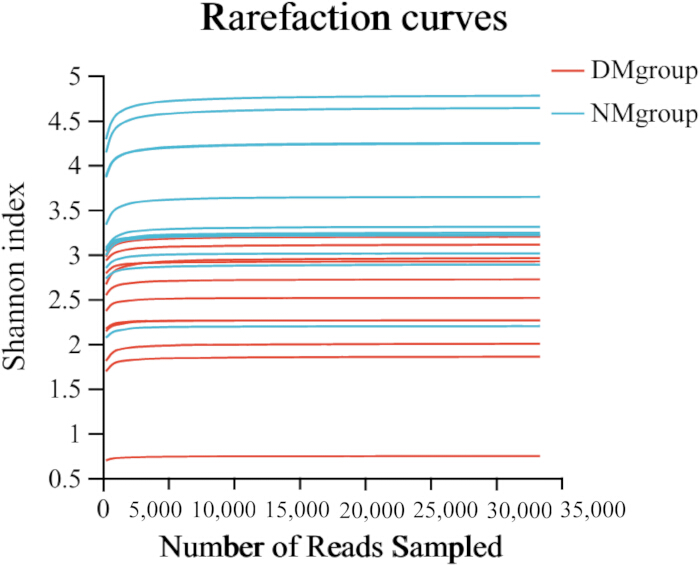
Figure 1: Rarefaction curves based on the Shannon index for the DM group and NM group. Each curve represents a single stool sample, with 12 samples per group. The x-axis shows the number of sequencing reads randomly sampled, and the y-axis shows the Shannon diversity index. The curves approached a plateau, indicating that the sequencing depth was sufficient to capture the major microbial diversity in the samples. Abbreviations; DM = diabetes mellitus; NM = non-diabetic matched. Please click here to view a larger version of this figure.
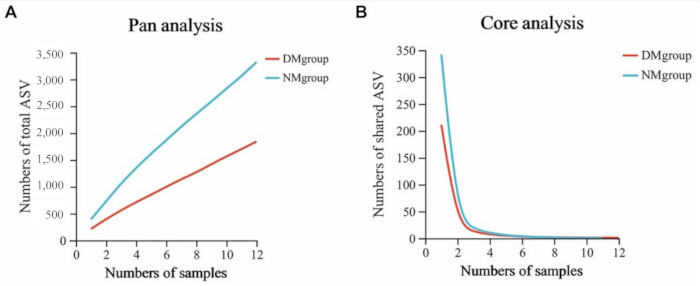
Figure 2: Pan and core ASV analyses in the DM group and NM group. (A) Pan analysis showing the cumulative number of total ASVs detected with increasing sample number. (B) Core analysis showing the number of shared ASVs retained as the sample size increases. Each group included 12 stool samples. Curves were generated from ASV abundance data and represent group-level richness trends rather than statistical comparisons. Abbreviations; DM = diabetes mellitus; NM = non-diabetic matched; ASV = amplicon sequence variant. Please click here to view a larger version of this figure.
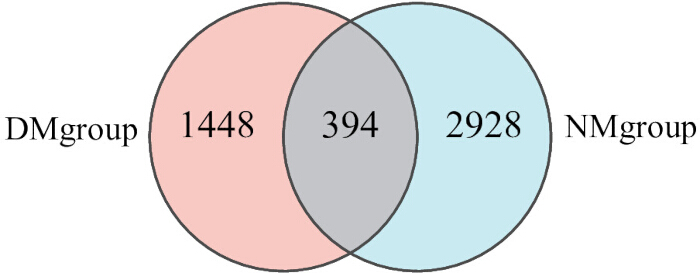
Figure 3: Venn diagram showing shared and group-specific ASVs between the DM group and NM group. Each group included 12 stool samples. The overlapping region represents ASVs shared by both groups, whereas non-overlapping regions represent ASVs unique to each group. A total of 394 ASVs were shared, with 1,448 ASVs unique to the DM group and 2,928 ASVs unique to the NM group. Abbreviations; DM = diabetes mellitus; NM = non-diabetic matched; ASV = amplicon sequence variant. Please click here to view a larger version of this figure.
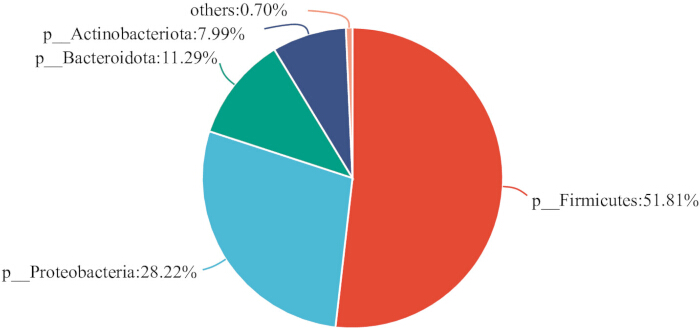
Figure 4: Overall phylum-level composition of the gut microbiota across all 24 stool samples. The pie chart shows the relative abundance of dominant bacterial phyla, expressed as percentages of total annotated sequences. Firmicutes, Proteobacteria, Bacteroidota, and Actinobacteriota were the main phyla detected. Please click here to view a larger version of this figure.
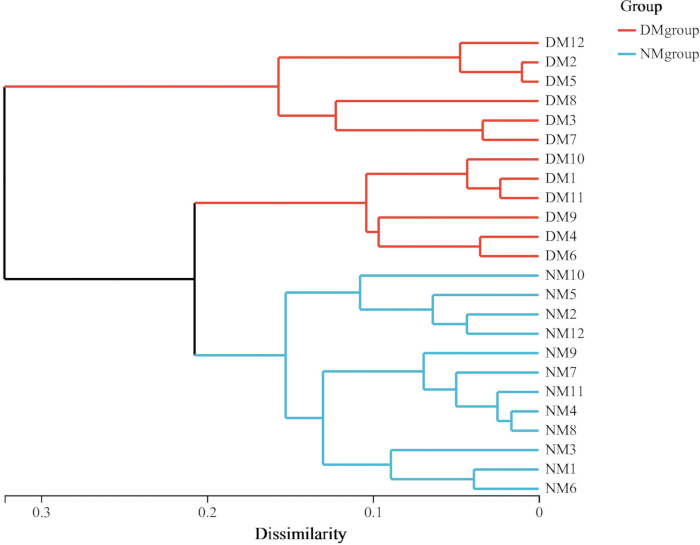
Figure 5: Hierarchical clustering of all stool samples based on microbial community dissimilarity. Each terminal branch represents one individual sample, including 12 DM samples and 12 NM samples. Branch length indicates between-sample dissimilarity in microbial composition. Samples were clustered according to ASV-level community distance. Abbreviations; DM = diabetes mellitus; NM = non-diabetic matched; ASV = amplicon sequence variant. Please click here to view a larger version of this figure.
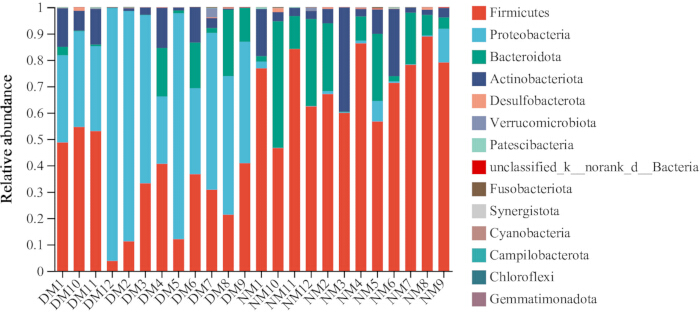
Figure 6: Phylum-level relative abundance profiles for individual stool samples. Each stacked bar represents one sample, including 12 DM samples and 12 NM samples. Bar segments indicate the relative abundance of each bacterial phylum within a sample. Values represent individual-sample proportions rather than group summaries. Abbreviations; DM = diabetes mellitus; NM = non-diabetic matched. Please click here to view a larger version of this figure.
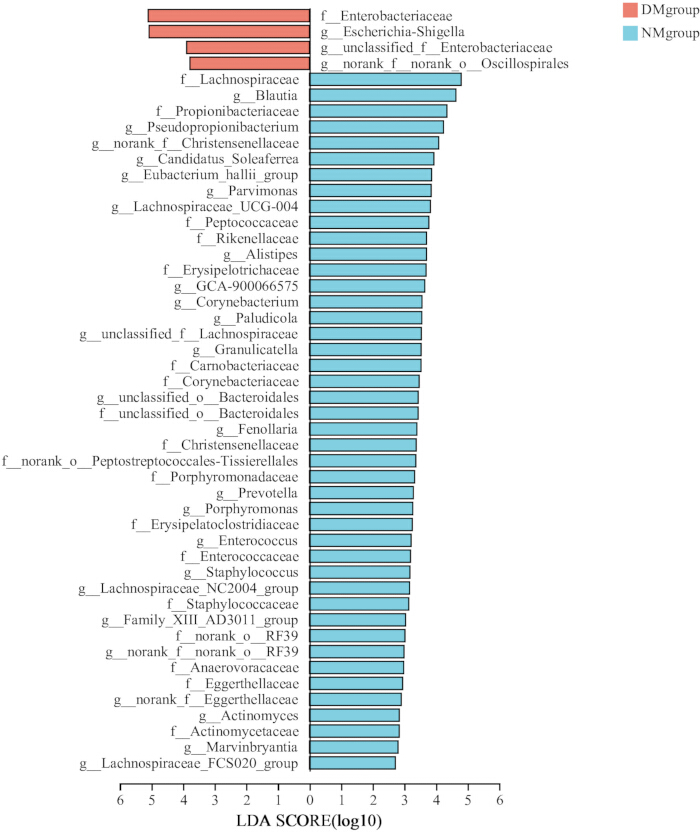
Figure 7: Linear discriminant analysis effect size (LEfSe) analysis of taxa discriminating the DM group from the NM group. Each group included 12 stool samples. Bars show taxa with differential abundance between groups, and the x-axis shows the linear discriminant analysis (LDA) score on a log10 scale. Red bars indicate taxa enriched in the DM group, and blue bars indicate taxa enriched in the NM group. LEfSe analysis was used to identify taxa contributing most strongly to group separation. Abbreviations; DM = diabetes mellitus; NM = non-diabetic matched. Please click here to view a larger version of this figure.
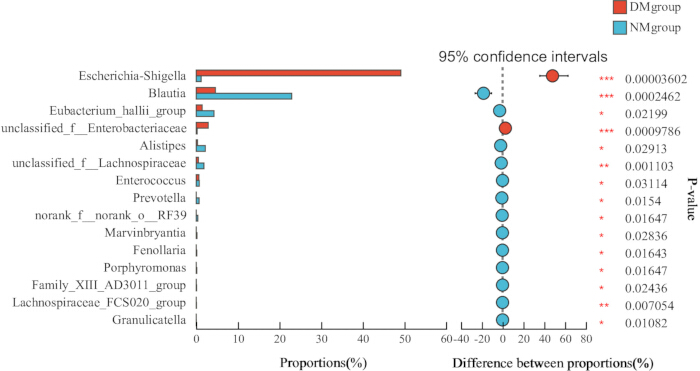
Figure 8: Differential abundance comparison of selected genera between the DM group and the NM group. Each group included 12 stool samples. Bars on the left show the relative abundance proportions of selected taxa in each group, and points with 95% confidence intervals on the right show the between-group differences in proportions. Differences were evaluated using Wilcoxon rank-sum tests. Asterisks indicate statistical significance, with *p < 0.05, **p < 0.01, and ***p. < 0.001. Abbreviations; DM = diabetes mellitus; NM = non-diabetic matched. Please click here to view a larger version of this figure.
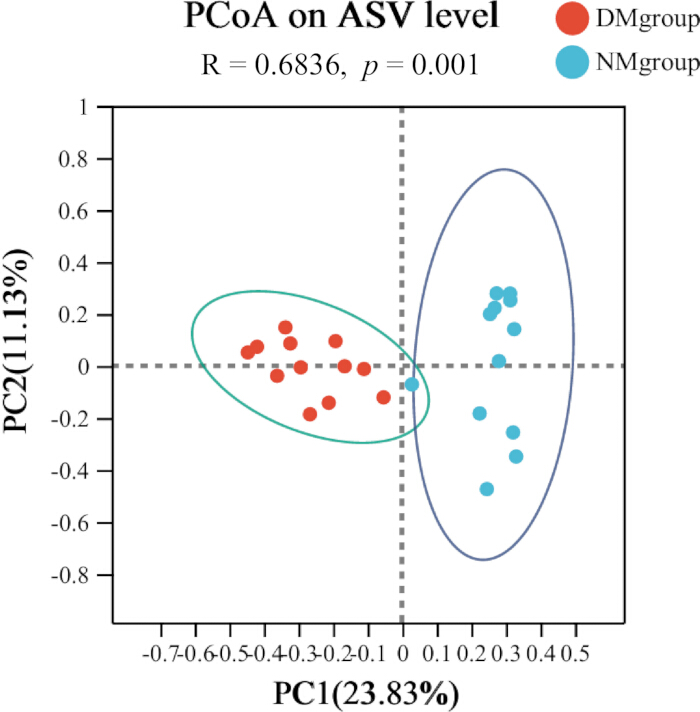
Figure 9: Principal coordinates analysis (PCoA) of ASV-level microbial community structure in the DM group and NM group. Each point represents a single stool sample, with 12 per group. The x- and y-axes represent PC1 and PC2, respectively, explaining 23.83% and 11.13% of the total variation. Group separation was tested using analysis of similarities (ANOSIM), yielding R = 0.6836 and p. = 0.001. Abbreviations: ANOSIM = analysis of similarities; PC1/2 = principal coordinates; DM = diabetes mellitus; NM = non-diabetic matched. Please click here to view a larger version of this figure.
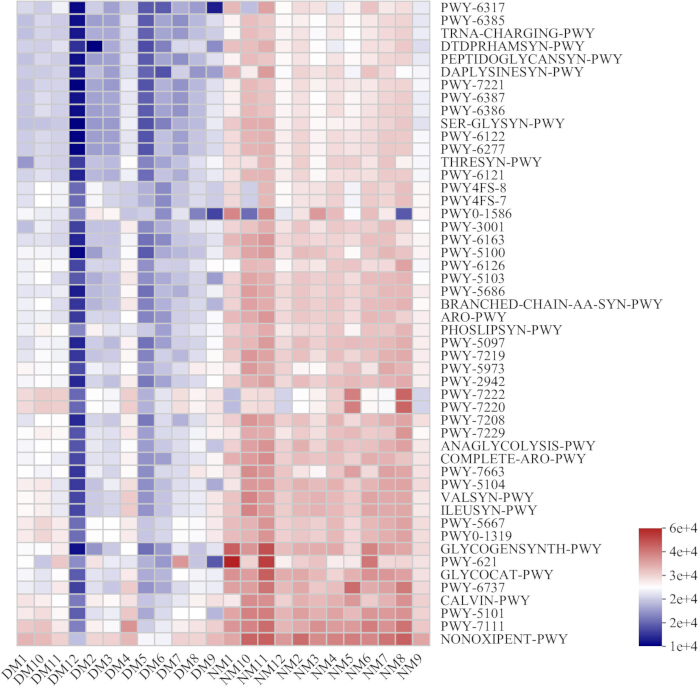
Figure 10: Heatmap of predicted microbial functional pathway abundance based on PICRUSt analysis. Columns represent individual stool samples, including 12 DM samples and 12 NM samples, and rows represent MetaCyc pathways. The color scale indicates predicted pathway abundance, with higher and lower values shown by the heatmap gradient. Between-group differences in predicted pathway abundance were evaluated using Wilcoxon rank-sum tests; pathways shown are those with differential abundance between groups. Abbreviations: PICRUSt = phylogenetic investigation of communities by reconstruction of unobserved states; DM = diabetes mellitus; NM = non-diabetic matched. Please click here to view a larger version of this figure.
Table 1: Baseline demographics. Baseline demographic and clinical characteristics of the initially screened DM and NM cohorts. Abbreviations; DM = diabetes mellitus; NM = non-diabetic matched. Please click here to download Table 6.
Table 2: Comparison of gut microbiota alpha diversity between the DM and NM groups. The Chao index reflects the richness of the microbial community. The higher the Chao index, the richer the microbial community. The Shannon and Simpson indices were employed to analyze the community's diversity. The higher the Shannon index, the greater the microbial diversity, whereas a higher Simpson index reduces it. Abbreviations; DM = diabetes mellitus; NM = non-diabetic matched. Please click here to download Table 6.
Table 3: Structural analysis at the phylum level. Phyla detected in all samples are listed under "Same Bacteria", while those not detected in all samples are listed under "Different Bacteria". Please click here to download Table 6.
Table 4: Statistical table for the intergroup difference test. In ANOSIM, the statistic is the R-value, which theoretically ranges from -1 to +1. In practice, R values generally range from 0 to 1. The closer the R-value is to 1, the greater the intergroup differences compared to intragroup differences. Smaller R values indicate no significant intergroup differences. Abbreviations; ANOSIM = analysis of similarities.< Please click here to download Table 6./p>
Table 5: Association between Firmicutes and T2DM. Significant and nominally significant Mendelian randomization estimates of the association between Firmicutes and T2DM. Please click here to download Table 5.
Table 6: Association between Bacteroidetes and T2DM. Significant and nominally significant Mendelian randomization estimates of the association between Bacteroidetes and T2DM. Please click here to download Table 6.
Table 7: Association between proteobacteria and T2DM. Significant and nominally significant Mendelian randomization estimates of the association between proteobacteria and T2DM. Please click here to download Table 7.
Discussion
Loading...
$$\rightleftharpoonup{xx}$$
$$\longleftharp{xx}$$,
$$\longrightharp{xx}$$,
In recent years, the human microbiome, particularly the gut microbiota, has emerged as a complex and influential factor in host metabolism, immune regulation, and disease development. In a healthy host, the gut microbiota contributes to immune homeostasis and intestinal barrier integrity11. Dysbiosis has been associated with a range of pathological conditions, including metabolic disorders, autoimmune diseases, and malignancies12,13,14,15,16. Alterations in gut microbiota composition have also been observed in individuals with T2DM, suggesting that microbial imbalance is associated with disease development12,17.
The present study demonstrated that gut microbiota diversity in T2DM patients was significantly reduced compared with the NM group, consistent with previous findings18. In addition, an increased relative abundance of Proteobacteria and a reduction in beneficial taxa were observed, in agreement with prior reports19. These compositional changes indicate a disruption of microbial homeostasis, which may be associated with impaired gut barrier function and metabolic dysregulation. However, these findings should be interpreted as associations rather than direct causal relationships. At the community level, distinct differences were observed between the DM and NM groups. Firmicutes, Proteobacteria, Bacteroidota, and Actinobacteriota were the dominant phyla across samples. Variability in the relative abundance of these phyla has been reported in previous studies, which may be influenced by factors such as treatment status, dietary patterns, and population heterogeneity20,21,22,23. For example, metformin treatment has been shown to alter gut microbiota composition, particularly affecting Bacteroidota abundance22,23. Similarly, surgical interventions such as Roux-en-Y gastric bypass have been associated with distinct microbiota shifts24. These findings highlight the importance of studying treatment-naïve populations, as performed in the present study, to reduce confounding effects.
Further evidence from pregnancy-related metabolic studies also highlights variability in microbiota composition under different physiological conditions. In gestational diabetes mellitus, several studies have reported an increased relative abundance of Firmicutes at the phylum level, suggesting that microbial shifts may be influenced by metabolic and hormonal changes during pregnancy25,26. In addition, alterations in specific Firmicutes families, such as Ruminococcaceae, may precede the diagnosis of gestational diabetes and are associated with glycemic regulation27. Similarly, microbial taxa within the Firmicutes phylum were correlated with metabolic hormone levels, including glucose-dependent insulinotropic polypeptide, in overweight and obese pregnant women28. Although these findings are derived from gestational populations, they underscore the context-dependent nature of microbiota alterations and suggest that host metabolic status, hormonal environment, and disease stage may all contribute to the observed heterogeneity across studies.
At finer taxonomic levels, the increased abundance of Enterobacteriaceae, including Escherichia and Shigella, in T2DM patients is consistent with previous studies29. However, the direction of association between Enterobacteriaceae and metabolic parameters remains inconsistent across studies30,31. This discrepancy may reflect differences in host metabolic status, study design, or microbial strain-level variation. Enterobacteriaceae includes both commensal and pathogenic organisms, and its increased abundance has been linked to endotoxin production and low-grade inflammation32,33. In this study, these findings are interpreted as associations that may reflect inflammatory and metabolic alterations rather than direct mechanistic effects. Conversely, taxa such as Lachnospiraceae and Blautia were more abundant in the NM group. These taxa have been variably associated with metabolic health in previous studies34,35,36,37,38. Some evidence suggests that members of Lachnospiraceae may contribute to short-chain fatty acid production and metabolic regulation35,36, while other studies report heterogeneous associations depending on host and environmental factors34. These inconsistencies highlight the complexity of microbial–host interactions and the need for cautious interpretation.
Functional prediction using PICRUSt suggested reduced abundance of pathways related to the non-oxidative pentose phosphate pathway, isobutanol biosynthesis, and L-isoleucine biosynthesis in T2DM patients. The pentose phosphate pathway has been implicated in glucose metabolism and oxidative stress regulation39. Alterations in isobutanol-related metabolic pathways have been reported in diabetic populations, although evidence remains limited40. Similarly, branched-chain amino acid metabolism, including isoleucine pathways, has been associated with metabolic dysfunction and T2DM risk41,42. Importantly, these functional predictions are based on inferred genomic content from 16S rDNA data and should therefore be interpreted as indicative of potential metabolic alterations rather than directly measured biochemical activity.
The Mendelian randomization analysis provided complementary evidence by identifying taxa that were associated with genetically predicted T2DM risk. Associations observed for taxa within Firmicutes, Bacteroidota, and Proteobacteria were generally consistent with compositional differences identified in the sequencing data. However, MR results reflect genetically predicted associations and are subject to underlying assumptions, including the absence of pleiotropy and appropriate instrument selection. Therefore, these findings should be interpreted as supportive evidence rather than definitive causal confirmation. Importantly, the protocol implemented in this study provides a standardized and reproducible workflow for integrating microbiome sequencing with downstream computational and genetic analyses. This integrative design is not intended to replace standalone MR studies, but rather to provide methodological triangulation by combining observational microbiome data with genetically informed inference.
From a methodological perspective, several critical protocol steps are essential for ensuring data quality and reproducibility. Proper stool sample collection and rapid freezing are necessary to preserve microbial composition while minimizing contamination and degradation. DNA extraction efficiency and consistency directly influence downstream sequencing results. PCR amplification conditions, including primer selection, cycle number, and replication strategy, are critical for reducing amplification bias. In addition, accurate library normalization and equimolar pooling are required to ensure balanced sequencing depth across samples. Quality control steps, including agarose gel verification and sequencing quality metrics, are also important for confirming successful execution of the protocol. Potential sources of variability include differences in sample handling, DNA extraction efficiency, and sequencing depth. Troubleshooting considerations include ensuring adequate DNA yield, avoiding over-amplification during PCR, and verifying library quality prior to sequencing. In bioinformatics analysis, quality filtering thresholds, denoising strategies, and taxonomic classification methods can influence final results and should therefore be applied consistently across samples.
This study has several methodological limitations. First, 16S rDNA sequencing provides limited taxonomic resolution and cannot reliably distinguish species-level variation. Second, functional predictions based on PICRUSt represent inferred metabolic potential rather than direct metabolomic measurements. Third, the cross-sectional design limits causal inference, despite the inclusion of Mendelian randomization analysis. Fourth, the relatively small sample size may limit generalizability; however, the inclusion of newly diagnosed, treatment-naïve participants reduces confounding from medication exposure and enhances the interpretability of microbiota alterations. In addition, the integration of Mendelian randomization analysis provides complementary evidence beyond conventional observational microbiome studies. Future studies incorporating larger cohorts, shotgun metagenomics, targeted metabolomics, and longitudinal designs are warranted to validate these findings.
Compared with alternative approaches, 16S rDNA sequencing offers a cost-effective and scalable method for profiling microbial community structure, making it suitable for exploratory and clinical studies. However, shotgun metagenomics provides higher taxonomic resolution and direct functional gene profiling, while targeted metabolomics enables direct measurement of metabolic outputs. The integrated framework used in this study, combining 16S sequencing, bioinformatics prediction, and MR analysis, represents a balanced approach that captures both compositional and genetically informed associations, although each component has inherent limitations.
In terms of methodological application, the protocol described in this study provides a reproducible workflow for integrating microbiome profiling with downstream computational and genetic analyses. This protocol may be adapted for application in other metabolic and inflammatory diseases requiring integrated microbiome and genetic analysis frameworks. Future methodological developments may include integration with multi-omics datasets, improved functional prediction tools, and standardized analytical pipelines to enhance reproducibility across studies.
In summary, this study provides a comprehensive characterization of gut microbiota alterations in newly diagnosed T2DM patients. Reduced microbial diversity and compositional shifts were observed, accompanied by predicted functional pathway changes and genetically informed associations. By focusing on treatment-naïve individuals and integrating 16S rDNA sequencing with bioinformatics analysis and Mendelian randomization, this study offers a complementary methodological framework that extends beyond conventional observational microbiome studies and provides an additional layer of genetically informed evidence. These findings support the relevance of gut microbiota in T2DM and highlight its potential role as a target for future investigation. These findings may have potential clinical relevance by informing microbiota-based risk stratification and guiding future development of microbiome-targeted interventions in T2DM. Further studies are required to validate these findings and clarify the underlying mechanisms using more advanced analytical approaches.
Disclosures
Loading...
$$\rightleftharpoonup{xx}$$
$$\longleftharp{xx}$$,
$$\longrightharp{xx}$$,
The authors declare that the research was conducted in the absence of any commercial or financial relationships that could be construed as a potential conflict of interest.
AUTHORS’ CONTRIBUTIONS:
Linrui Xie and Kemiao Chen performed data analysis and drafted the manuscript. Xican Pan participated in sample collection and experimental procedures. Xuemei Zhong and Xiaoyu Li conceived and designed the study, supervised the project, and critically revised the manuscript. All authors reviewed and approved the final manuscript.
Acknowledgements
Loading...
$$\rightleftharpoonup{xx}$$
$$\longleftharp{xx}$$,
$$\longrightharp{xx}$$,
The authors thank all participants and staff involved in sample collection and data processing for their contributions to this study.
Materials
| Name | Company | Catalog Number | Comments |
|---|---|---|---|
| 16S rRNA Primers (V3–V4) | Sangon Biotech | Custom | Universal primers for bacterial 16S region |
| 80 °C Freezer | Haier Biomedical | DW-86L626 | Long-term sample storage |
| Agarose Gel System (Sub-Cell GT) | Bio-Rad | 170-4401 | PCR product validation |
| AMPure XP Magnetic Beads | Beckman Coulter | A63880 | DNA purification and size selection |
| Bead-beating Tubes (Lysing Matrix E) | MP Biomedicals | 116913050 | Mechanical lysis of microbial cells |
| Bioinformatics Workstation | Dell | Precision 7920 | Data analysis using QIIME2 and R |
| DADA2 pipeline | Bioconductor | Version 1.28 | Sequence denoising and ASV generation; https://benjjneb.github.io/dada2 |
| Deblur | QIIME2 | Version 2023.5 | Sequence denoising and error correction; https://docs.qiime2.org |
| European Genome-Phenome Archive | EMBL-EBI | EGAS00001005020 | Public metagenomic dataset repository; https://ega-archive.org |
| GWAS Catalog | NHGRI-EBI | Accessions GCST90032172–GCST90032644 | Public genome-wide association summary statistics database; https://www.ebi.ac.uk/gwas |
| Illumina MiSeq Sequencing System | Illumina | SY-410-1003 | High-throughput sequencing platform |
| KEGG database | Kyoto Encyclopedia of Genes and Genomes | Release 107 | Functional pathway annotation database; https://www.genome.jp/kegg |
| MetaCyc database | SRI International | Version 27.1 | Metabolic pathway database; https://metacyc.org |
| Microcentrifuge | Eppendorf | 5424R | Cooling centrifuge for sample preparation |
| Nextera XT Library Prep Kit | Illumina | 20018705 | Library prep for sequencing |
| PCR Master Mix (2x PrimeSTAR Max Premix) | Takara Bio | RR350A | For high-fidelity PCR |
| PCR Thermocycler | Bio-Rad | T100 | PCR amplification instrument |
| PICRUSt2 | PICRUSt2 Development Team | Version 2.5.2 | Functional pathway prediction from 16S rDNA sequencing data; https://github.com/picrust/picrust2 |
| QIAamp Fast DNA Stool Mini Kit | QIAGEN | 51504 | DNA extraction from stool samples |
| QIAquick Gel Extraction Kit | QIAGEN | 28704 | DNA purification from agarose gel |
| Qubit Fluorometer | Thermo Fisher Scientific | Q33226 | DNA quantification |
| R software | R Foundation for Statistical Computing | Version 4.3.1 | Statistical analysis and Mendelian randomization analysis; https://www.r-project.org |
| SILVA 138 database | SILVA ribosomal RNA database project | Release 138 | Reference database for taxonomic annotation; https://www.arb-silva.de |
| Stool Collection Tube | Sarstedt | 76.9923.001 | Sterile stool specimen collection tube |
| Stool DNA Kit | Omega | D4015-02 | DNA extraction kit |
| TwoSampleMR package | MR-Base | Version 0.5.7 | Mendelian randomization analysis in R; https://mrcieu.github.io/TwoSampleMR |
Reprints and Permissions
Request permission to reuse the text or figures of this JoVE article
Request Permission