Using two-sample Mendelian randomization and mediation analyses, this study identifies 32 immune cell phenotypes and 9 plasma metabolites causally associated with Hashimoto’s thyroiditis and supports a partial CD39+Treg-isovalerylcarnitine (C5)-HT immunometabolic axis. Preliminary flow cytometry and metabolomic data provide initial biological plausibility consistent with this pathway.
Research Article
A Mendelian Randomization Study of Immune Cell Traits and Plasma Metabolites in Hashimoto's Thyroiditis
In This Article
Summary
Abstract
Hashimoto's thyroiditis (HT) is an autoimmune disorder of the thyroid. While immune cells are implicated in its pathogenesis, their specific roles have yet to be fully clarified. A two-sample Mendelian randomization (MR) analysis was conducted integrating genome-wide association study (GWAS) summary statistics from large public datasets for immune cell traits (ebi-a-GCST90001391 to ebi-a-GCST90002121), plasma metabolites (GCST90199621-9020102), and HT (ebi-a-GCST90018855). Causal effects were estimated using inverse-variance weighted (IVW) methods, with MR-Egger, weighted median, and leave-one-out analyses to assess pleiotropy and robustness. Bidirectional and mediation MR analyses were further applied to test directionality and identify potential metabolite-mediated pathways. CD3⁺CD4⁺CD25⁺CD39⁺Treg cells were quantified in peripheral blood samples using flow cytometry. Isovalerylcarnitine (C5) was measured by liquid chromatography tandem mass spectrometry. IVW analysis identified 32 immune cell phenotypes significantly associated with HT risk (P < 0.05 after FDR correction). Reverse MR analysis demonstrated that HT was positively causally linked with 2 immune characteristics, while 4 immune characteristics (all P < 0.05) were inversely associated with HT. Sensitivity analyses revealed no horizontal pleiotropy or heterogeneity. Additionally, the IVW method preliminarily identified 9 plasma metabolites as causally related to HT, including risk-enhancing C5 (OR = 1.120, 95% CI: 1.032-1.215, P = 0.006) and protective ergothioneine (OR = 0.958, 95% CI: 0.927-0.990, P = 0.010). Two-step MR mediation identified C5 as a candidate mediator connecting CD3⁺ CD39⁺ Treg to HT (mediation proportion 8.89%, 95% CI: 2.34%-15.4%, P = 0.008). Flow cytometry elevated CD39⁺Treg levels and plasma C5 in HT patients, with C5 positively correlated with CD39⁺Treg cells proportion. This study establishes novel causal links between immune cell phenotypes and HT, and highlights plasma metabolites, particularly C5, as potential mediators in HT pathogenesis. These findings deepen mechanistic understanding of autoimmune thyroid disease and may guide future biomarker and therapeutic target discovery.
Introduction
Hashimoto's thyroiditis (HT) is a common autoimmune disease in which the immune system attacks the thyroid gland, resulting in hypothyroidism1,2. Recent studies have reported a steady annual increase in the incidence of HT. In China, its prevalence is estimated to range from 0.2% to 1.3%3. The exact cause of HT is unknown, although its pathogenesis is thought to include a complex interaction of genetic, environmental, and immune system components4,5.
HT development is heavily influenced by the immune system6,7,8. Aberrant immune responses target thyroid tissue, triggering the production of autoantibodies, including anti-thyroid peroxidase (anti-TPO) and anti-thyroglobulin (anti-Tg)9. These autoantibodies interact with thyroid cells, inducing immune-mediated cell death and inflammatory reactions, resulting in impaired thyroid function10. The specific pathogenic pathways, particularly the metabolic cues that drive immune cell dysfunction, remain not fully understood. Regulatory T cells (Tregs), especially those expressing CD39, play a pivotal role in maintaining immunological tolerance by hydrolyzing extracellular ATP into immunosuppressive adenosine. Disruptions in Treg function or their metabolic environment can lead to a breakdown in self-tolerance, yet the causal relationship between specific Treg subsets and HT remains to be elucidated11,12,13,14,15,16.
Traditional observational studies are frequently limited by confounding variables and the potential for reverse causation, which complicates the ability to determine definitive causal relationships between immune cell phenotypes and HT17. Furthermore, because HT is a systemic disease influenced by various immune subsets and metabolic intermediates, a narrow focus on individual candidates may overlook novel pathogenic drivers18. Therefore, a large-scale screening approach is necessary to provide an unbiased and comprehensive landscape of the immunometabolic factors contributing to HT. Recent advancements in genome-wide association studies (GWAS) have provided comprehensive data on immune cell phenotypes and plasma metabolites, offering new avenues to explore the underlying mechanisms of HT19. Mendelian randomization (MR) follows the principles of random assignment of Mendelian gametes and free combinations16 and leveraging single nucleotide polymorphisms (SNPs) as instrumental variables (IVs) to infer potential causal effects of exposures on outcomes20,21. This method helps mitigate the influence of confounding factors and reverse causation, which frequently complicate traditional observational studies16,22.
In light of these developments, the objective of this study is two-fold. First, an exploratory, hypothesis-generating analysis was conducted using a two-sample MR framework to systematically screen 731 immune cell phenotypes and 1,400 plasma metabolites to identify novel candidate risk factors for HT. Second, a transition was made to a hypothesis-driven investigation to evaluate the specific mediatory role of identified metabolites, such as isovalerylcarnitine, in the pathway linking regulatory T cells to HT risk. This study, therefore, integrates large-scale MR screening with mediation analysis and preliminary clinical validation to provide genetically supported evidence consistent with a putative immunometabolic framework (Treg–metabolite–HT), while emphasizing the exploratory nature of these findings. By identifying these precise causal chains, fresh perspectives on the metabolic regulation of thyroid autoimmunity are provided, along with robust candidates for future therapeutic targeting.
Protocol
The study was approved by the Medical Ethics Committee of The Affliated Hospital of Inner Mongolia Medical University. All procedures were conducted in accordance with the Declaration of Helsinki and relevant ethical guidelines. Written informed consent was obtained from all participants prior to the initiation of any study-related procedures. This study included two groups of participants: the Hashimoto’s thyroiditis group (HT, n = 10) and the healthy control group (Healthy, n = 10). The two groups were matched for age and sex. All peripheral blood samples were collected from outpatients or individuals undergoing routine health examinations, with blood drawn in the morning after an overnight fast.
Study design
In this study, a two-sample MR analysis and mediation analysis were employed to evaluate the causal relationship between 731 immune cell phenotypes (7 groups) and HT, and explored the potential modulatory role of plasma metabolites in this relationship. The analytical workflow consisted of 5 sequential steps: (1) selection of exposure GWAS datasets for immune phenotypes; (2) selection of outcome GWAS dataset for HT; (3) instrumental variable identification and harmonization; (4) primary two-sample MR analysis and bidirectional validation; and (5) two-step mediation MR analysis. A schematic overview of the study design is presented in Supplementary Figure 1. In MR analysis, genetic variants serve as proxies for modifiable exposures. For valid causal inference, instrumental variables (IVs) must satisfy three fundamental criteria: (1) they are strongly associated with the exposure of interest; (2) they are independent of any confounders that could influence both the exposure and the outcome; and (3) they affect the outcome solely through the exposure, without alternative causal pathways.
GWAS of the HT data source
To ensure dataset compatibility and minimize population stratification, all GWAS summary statistics were primarily derived from individuals of European ancestry. The GWAS database (https://gwas.mrcieu.ac.uk/) provided the HT outcome data, and the ebi-a-GCST90018855 dataset was used. The study performed GWAS on 395,640 Europeans (Ncase = 15,654, Ncontrol = 379,986), after quality control and after interpolation, 24,146,037 SNPs were analyzed. For HT-specific confounders (e.g., gender, age), the original GWAS (ebi-a-GCST90018855) included these covariates in their models, as standard in GWAS pipelines.
GWAS data sources for immune cells
Summary statistics for GWAS related to immune cell traits were obtained from the GWAS Catalog, covering datasets with accession numbers from ebi-a-GCST90001391 to ebi-a-GCST90002121 (available at https://www.ebi.ac.uk/gwas/). A total of 731 immunological phenotypes were included in the analysis, including relative cell count (n = 192), morphological parameter (MP) (n = 389), activation coefficients (AC, n = 118), and mean fluorescence intensity (MFI, n = 389) representing the degree of surface antigen23. The impact of almost 22 million polymorphisms on 731 immune cell phenotypes in 3757 Sardinians was documented by the initial GWAS on immune cells.
GWAS data sources for plasma metabolites
GWAS summary data for a total of 1,400 plasma metabolites were retrieved from the GWAS Catalog (https://www.ebi.ac.uk/gwas/studies/GCST90199621-90201020), comprising 1,091 individual metabolite concentrations and 309 metabolite ratio traits. The GWAS datasets employed for MR analysis in the present study were derived from individuals of European ancestry. Detailed characteristics of the plasma metabolite GWAS data utilized are provided in Supplementary Table 1.
The GWAS datasets for immune cell phenotypes (Sardinian cohort), HT (FinnGen/EBI-a-GCST90018855), and plasma metabolites (European cohorts) are independent with no sample overlap, as confirmed by the respective consortium publications. This satisfies the independence assumption for two-sample MR.
Selection of instrumental variables (IVs)
IVs were assumed to be strongly associated with the exposure while remaining independent of the outcome variables. Additionally, only the exposure factor was hypothesized to have a direct effect on the outcome. To identify appropriate IVs, SNPs associated with exposure factors were selected with a significance level set at 5 × 10⁻⁸. To account for linkage disequilibrium (LD), SNPs were clumped using an R2 threshold of 0.001 within a window size of 10,000 kilobases (kb). Variants exhibiting pairwise R2 > 0.001 within this distance were excluded to ensure the independence of the selected instrumental variables and eliminate potential LD correlations. Heterogeneity tests excluded significantly heterogeneous SNPs with an F-statistic < 10. Finally, to control for the effect of confounders on the IVs, P < 1×10⁻⁵ was taken to eliminate palindromic SNPs and incompatible SNPs, and valid SNPs were retained as instrumental variables.
Two-sample Mendelian randomization analysis
To evaluate the bidirectional causal relationship between immune cell phenotypes and HT, both two-sample Mendelian randomization (MR) analyses and mediation MR analyses were performed. Specifically, two-sample MR was applied to assess multiple immune cell-related traits. For these analyses, several complementary MR methods were employed, including inverse-variance weighting (IVW)24, MR-Egger regression25, the weighted median estimator (WME)26, mode-based simple estimation27, and weighted mode-based estimation. Among these, IVW was designated as the primary analytic approach, with statistical significance defined as P < 0.05. The IVW method was selected as the primary MR estimator due to its optimal balance between precision and assumption of balanced pleiotropy. The IVW method enhances precision by assigning greater weight to SNPs with smaller variances, thereby producing more reliable causal estimates. MR-Egger regression was used for pleiotropy assessment, a process in which genes influence multiple phenotypes. If the intercept indicated that there was no significant horizontal pleiotropy (P > 0.05) , this approach combined the intercept assessment to determine pleiotropy. Heterogeneity was evaluated using the Q statistic of the MR-Egger and IVW methods, which measures the extent to which genetic variation affects the phenotype, if P > 0.05 indicates that there is no significant heterogeneity in the effects of genetic variation. Bonferroni-adjusted thresholds were applied to account for 731 immune phenotypes (P < 6.84 × 10⁻⁵) and 1,400 metabolites (P < 3.57 × 10⁻⁵). Significant results survived correction unless noted otherwise. In addition, reverse causality was evaluated using the same MR method to investigate whether immune cell characteristics were affected by HT. At reverse MR study, HT was considered the exposure factor and different immune cell characteristics were considered the outcome.
In this study, mediation analysis was conducted using a two-step MR framework to explore whether plasma metabolites act as intermediaries in the causal pathway linking immune cell phenotypes to HT. This approach allows the total causal effect of immune cell phenotypes on HT to be partitioned into a direct effect and an indirect effect transmitted through the identified metabolic intermediates. The total effect of immune cells on HT was first estimated, followed by the effect of immune cells on metabolites (β1), the effect of metabolites on HT (β2), and the mediator effect (β1*β2), with the direct effect calculated as the total effect minus the mediator effect. Total effect (βtotal) = Direct effect (βdirect) + Indirect effect (βindirect); Indirect effect = β1 × β2; Proportion mediated (%) = (β1 × β2)/βtotal × 100%, where β1 is the causal effect of the immune cell phenotype on the plasma metabolite, and β2 is the causal effect of the plasma metabolite on HT. The delta method was used to estimate 95% confidence intervals for the indirect effect. Furthermore, a reverse intermediary MR analysis was conducted to investigate the causal effects of HT on metabolites and metabolites on immune cells, in order to supplement the results of forward MR and enhance the reliability of causal inference. All analyses were performed by a statistical computing environment and relevant MR-related software packages, which are listed in the Table of Materials.
CD3+CD4+CD25+CD39+ Treg detection
50 µL of anticoagulated whole blood was thoroughly mixed in a test tube with 10 µL each of targeting CD3, CD4, CD25, and CD39 monoclonal antibodies. The mixture was protected from light and maintained at room temperature for 15 min. Subsequently, 2 mL of a 1: 10 diluted FACS Lysing solution was added. The tube was incubated for 10 more minutes at room temperature while protected from light during lysis. The tube was centrifuged at ~300 x g for 5 min, and the supernatant was removed. After adding 2 mL of phosphate buffer solution (PBS), the tube was again centrifuged at ~300 x g for 5 min. The supernatant was removed, and 500 µL PBS was added for detection. Detection was performed using a multi-laser flow cytometer, and analyzed by the accompanying acquisition and analysis software to obtain the proportion of CD3+CD4+CD25+Tregs and the subset expressing CD39 (CD3+CD4+CD25+CD39+Tregs).
Measurement of Isovalerylcarnitine (C5) Levels
Data on patients' C5 levels were obtained from the Department of Clinical Laboratory at the Hospital of Inner Mongolia Medical University. Specifically, C5 was measured as part of routine liquid chromatography–tandem mass spectrometry (LC–MS/MS), following standardized laboratory procedures and quality-control protocols.
Statistical analysis
All statistical analyses were performed using a statistical software environment. Continuous variables were compared using the Student’s t-test for normally distributed data or the Wilcoxon rank-sum test for non-normally distributed data. Categorical variables were analyzed using the chi-square test. Pearson correlation analysis was used to conduct a correlation analysis. A p-value < 0.05 was considered statistically significant.
Results
Genetic causal effects of immune cell phenotypes on HT
Following the exclusion of potential confounding factors and the absence of horizontal pleiotropy (P > 0.05), a two-sample MR analysis was conducted to assess the causal effects of immune cell phenotypes on the risk of HT. For each immune cell phenotype used as an exposure, the F-statistic was calculated to evaluate the strength of instrumental variables. All instruments exceeded the conventional threshold of F > 10, indicating minimal weak instrument bias. Detailed F-statistics for the key immune traits discussed in the main text are provided in Supplementary Table 2. In total, 32 immune-related phenotypes demonstrated significant associations with HT risk (P < 0.05) (Figure 1). The robustness of these findings was supported by scatter plot analyses (Supplementary Figure 2A,B) and sensitivity analyses using the leave-one-out approach (Supplementary Figure 3A,B).
Among the primary findings, the Treg phenotype showed the most extensive involvement, with CD3 on CD39+ secreting Treg (OR = 1.063; 95% CI: 1.023–1.105; P = 0.002) and CD39+ activated Treg %activated Treg (OR = 1.081; 95% CI: 1.008–1.161; P = 0.030) emerging as key risk-associated features that were subsequently prioritized for mediation analysis. In the maturation stages of T cells, CD3 on CM CD8br showed the largest effect size among risk-associated features (OR = 1.094; 95% CI: 1.040–1.150; P < 0.001), while TD DN (CD4⁻CD8⁻) AC showed a notable protective association (OR = 0.930; 95% CI: 0.881–0.982; P = 0.009). Among B cell phenotypes, HLA-DR-expressing myeloid cell subsets consistently showed risk-elevating effects, with HLA DR on CD33dim HLA DR+ CD11b⁻ reaching OR = 1.095 (95% CI: 1.032–1.162; P = 0.003). Complete results across all six immune cell categories: cDC, Treg, T cell maturation stages, TBNK, Monocyte, B cell, and Myeloid cell phenotypes are summarized in Figure 1.
Sensitivity analyses further validated the results. No significant evidence of heterogeneity and horizontal pleiotropy was detected based on relevant statistical assessments (Supplementary Table 3 and Supplementary Table 4). These results were corroborated by the "leave-one-out" analysis.
The causal effects of HT on immune cells
The results revealed that HT was positively causally associated with 2 immune features: the Secreting CD4 regulatory T cell (1.143: 1.023-1.277; P = 0.018) and Monocytic Myeloid-Derived Suppressor Cells (1.373: 1.058-1.782; P = 0.017). In contrast, HT was negatively causally associated with 4 immune features: activated CD4 regulatory T cell (0.818: 0.679-0.987; P = 0.036), activated CD4+ regulatory T cell(0.790: 0.676-0.924; P = 0.003), Activated and resting CD4 regulatory T cell (0.871: 0.780-0.974; P = 0.015) and CD25++ CD4+ T cell (0.855: 0.747-0.980; P = 0.017) (Figure 2). These findings suggest a reciprocal relationship between HT and Treg activation states, which may reflect disease-driven immune remodeling. Scatter plots (Supplementary Figure 4) and the "leave-one-out" method (Supplementary Figure 5) verified the stability of the results. Sensitivity analyses validated the results as well. The strength of these results was confirmed by assessments of heterogeneity and horizontal multiplicity (Supplementary Table 5 and Supplementary Table 6). These conclusions are supported by the "leave-one-out" analysis.
Genetic causal effects of plasma metabolites on HT
After selecting suitable instrumental variables and excluding chain imbalances and weak instruments, a total of 34,843 SNPs associated with plasma metabolites were identified, with the minimum F-statistic reaching 19.50 (Supplementary Table 7). Using the IVW method, 9 plasma metabolites were preliminarily found to be causally associated with HT. Among these, 4 metabolites were positively associated with an increased risk of HT: Glucose to maltose ratio (1.195: 1.082-1.319; P < 0.001), Taurocholic acid (1.190: 1.073-1.321; P = 0.001), 5-hydroxymethyl-2-furoylcarnitine (1.127: 1.046-1.215; P = 0.002), and C5 (1.120: 1.032-1.215; P = 0.006) (Table 1).
Conversely, 5 metabolites may be negatively associated with the risk of HT, including Ergothioneine (0.958: 0.927-0.990; P = 0.010), Carnitine to propionylcarnitine (C3) ratio (0.895: 0.825-0.970; P = 0.007), Adenosine 5’-diphosphate (ADP) to N-acetylneuraminate ratio (0.890: 0.823-0.963; P = 0.004), Arginine to glutamate ratio (0.882: 0.802-0.968; P = 0.009), and 1-(1-enyl-palmitoyl)-2-linoleoyl-GPE (p-16:0/18:2) (0.873: 0.798-0.955; P = 0.003).
Sensitivity analyses validated the results as well. The strength of these results was confirmed by assessments of heterogeneity and horizontal multiplicity (Supplementary Table 8 and Supplementary Table 9). These conclusions are supported by the "leave-one-out" analysis.
Mediation of immune cell-HT risk by plasma metabolites
Building on the previously identified immune cell phenotypes and plasma metabolites, a two-sample MR strategy was applied to estimate potential mediating effects. In the first step, MR analyses were conducted using 32 immune cell phenotypes as exposures and 9 plasma metabolites as outcomes, revealing 12 significant causal associations involving 10 immune cell phenotypes and 8 plasma metabolites, with corresponding effect estimates β1 from immune cells to metabolites. Among these, the most significant association was identified between CD3 on CD39+ secreting Treg cells and C5 levels (1.050: 1.016-1.085; P = 0.004). In the second step, C5 was treated as the exposure and HT as the outcome. MR analyses were performed, including MR-PRESSO outlier detection and evaluations for heterogeneity and horizontal pleiotropy. No outlier SNPs or evidence of heterogeneity or pleiotropy were detected (Table 2), allowing us to estimate the causal effect from the plasma metabolite to HT (β2) (Supplementary Figure 6).
In the final step of the MR analysis, mediation analyses were conducted to clarify whether the causal effect of immune cell phenotypes on HT was mediated through plasma metabolites. The results indicated that increased levels of C5 acted as a mediator in the pathway linking CD3 on CD39+ secreting Treg cells to a higher risk of developing HT (Supplementary Figure 7 and Figure 3). MR-PRESSO outlier detection, heterogeneity, and pleiotropy tests revealed no biased SNPs and no signs of heterogeneity or horizontal pleiotropy (Table 3, Supplementary Table 10, and Supplementary Table 11). Among them, the mediating proportion of C5 levels was 8.89% (2.34% to 15.4%) (P = 0.008). Finally, reverse mediation MR analyses were performed to rigorously test directionality assumptions. For metabolites to immune cells, reverse MR (C5 levels to CD3 on CD39+ secreting Treg) showed no significant causal effects (IVW P > 0.05 after Bonferroni correction), supporting unidirectionality (Table 4). For HT to metabolites, reverse MR (HT to C5 levels) revealed no causal associations (IVW P > 0.05 after Bonferroni correction), supporting the assumed directionality (Table 5). Given the modest total effect and lack of reciprocal evidence in bidirectional MR, these mediation results should be considered exploratory.
Flow cytometry assay CD3+CD4+CD25+CD39+ Treg detection
To validate the findings from the metabolomics analysis, in vitro experimental validation was performed to assess the expression characteristics of CD39+ Treg and the plasma C5. Flow cytometry was used to quantify Treg cells (CD3⁺CD4⁺CD25⁺) and their CD39⁺subsets (CD3⁺CD4⁺CD25⁺CD39⁺) in peripheral blood from patients with HT and healthy controls. As shown in Figure 4A–C, both Treg cells (CD3⁺CD4⁺CD25⁺) and CD39⁺ Treg subsets were significantly elevated in HT patients compared with healthy individuals (P < 0.001). Targeted plasma metabolomic profiling using tandem mass spectrometry further showed that C5 levels were markedly higher in the HT group (P < 0.001, Figure 4D). In addition, Pearson correlation analysis revealed a positive association between plasma C5 levels and the frequency of CD39⁺Treg subset (Figure 4E), consistent with the putative CD39⁺Treg-C5-HT pathway identified by MR. However, the cross-sectional design and small sample size preclude causal inference from these data alone.
DATA AVAILABILITY:
The genome-wide association study (GWAS) summary statistics for Hashimoto’s thyroiditis were obtained from the GWAS Catalog (ebi-a-GCST90018855; https://gwas.mrcieu.ac.uk/). Summary statistics for immune cell traits were retrieved from the GWAS Catalog (ebi-a-GCST90001391 to ebi-a-GCST90002121; https://www.ebi.ac.uk/gwas/). Plasma metabolite GWAS data were obtained from the GWAS Catalog (GCST90199621-GCST90201020; https://www.ebi.ac.uk/gwas/studies/GCST90199621-90201020). Data supporting the findings of this study are provided in Supplementary File 1.
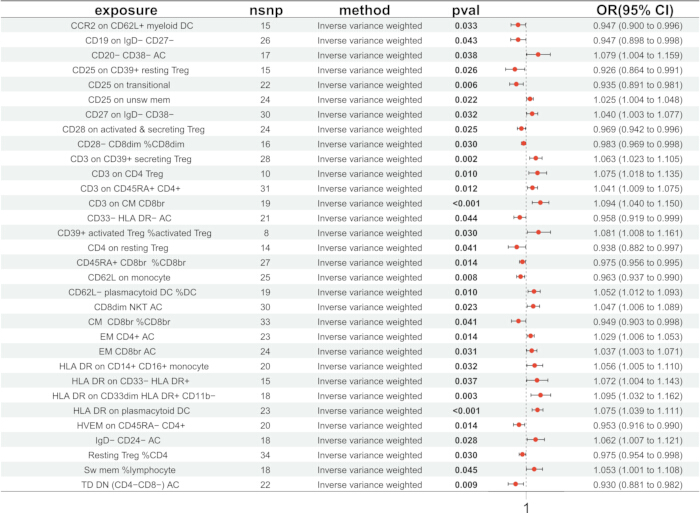
Figure 1: Forest plot showing the causal effects of immune cell traits on Hashimoto thyroiditis. Forest plot summarizing the causal effects of all immune cell traits evaluated in this study on Hashimoto thyroiditis (HT). Abbreviations: nsnp, number of single-nucleotide polymorphisms (SNPs); pval, P value; OR, odds ratio; CI, confidence interval. Please click here to view a larger version of this figure.

Figure 2: Forest plot showing the causal effects of Hashimoto thyroiditis on immune cell phenotypes. Forest plot summarizing the causal effects of HT on various immune cell phenotypes. Abbreviations: nsnp, number of SNPs; pval, P value; OR, odds ratio; CI, confidence interval. Please click here to view a larger version of this figure.
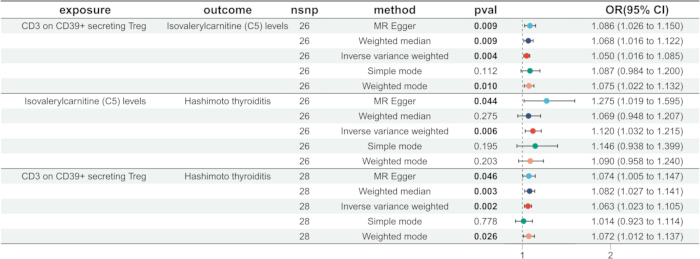
Figure 3: Forest plot showing mediation effect the plasma isovalerylcarnitine (C5) between CD39+ and Hashimoto thyroiditis. Forest plot summarizing the causal effects of plasma C5 that mediate the association between CD39+ and HT. Abbreviations: OR, odds ratio; CI, confidence interval. Please click here to view a larger version of this figure.
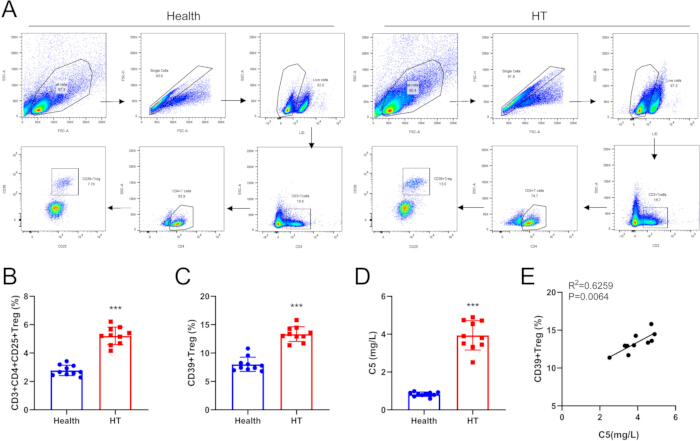
Figure 4: Expression of CD39+ regulatory T cells and plasma isovalerylcarnitine (C5) levels in patients with Hashimoto thyroiditis. (A) Flow cytometry gating strategy for regulatory T (Treg; CD3+CD4+CD25+) cells and CD39+ Treg cells. (B) Total Treg cell levels. (C) CD39+ Treg cell levels. (D) Plasma isovalerylcarnitine (C5) levels measured by tandem mass spectrometry. (E) Pearson correlation analysis between plasma isovalerylcarnitine (C5) levels and the proportion of CD39+ Treg cells. Abbreviations: SSC-A, side scatter area; FSC-A, forward scatter area; FSC-H, forward scatter height. ***P < 0.001 versus healthy controls. Please click here to view a larger version of this figure.
Table 1: Causal effects of nine significantly associated plasma metabolites on Hashimoto thyroiditis. Please click here to download this file.
Table 2: Causal effect of isovalerylcarnitine (C5) levels on Hashimoto thyroiditis (β₂). Please click here to download this file.
Table 3: Causal effect of CD3+CD39+ regulatory T cells on Hashimoto thyroiditis. Please click here to download this file.
Table 4: Causal effect of isovalerylcarnitine (C5) levels on CD3+CD39+ regulatory T cells. Please click here to download this file.
Table 5: Causal effect of Hashimoto thyroiditis on isovalerylcarnitine (C5) levels. Please click here to download this file.
Supplementary Figure 1: Study design and analytical workflow. Please click here to download this file.
Supplementary Figure 2: Scatter plots showing causal estimates for the associations between 32 immune cell traits and Hashimoto thyroiditis. Please click here to download this file.
Supplementary Figure 3: Leave-one-out analyses evaluating the robustness of the causal effects of 32 immune cell traits on Hashimoto thyroiditis. Please click here to download this file.
Supplementary Figure 4: Scatter plots showing the causal effects of Hashimoto thyroiditis on six immune cell phenotypes. Please click here to download this file.
Supplementary Figure 5: Leave-one-out analyses evaluating the robustness of the causal effects of Hashimoto thyroiditis on six immune cell phenotypes. Please click here to download this file.
Supplementary Figure 6: Causal association between isovalerylcarnitine (C5) levels and Hashimoto thyroiditis risk. (A) Forest plot showing the causal effect of isovalerylcarnitine (C5) levels on HT risk (β₂). (B) Scatter plot showing the causal effect estimate for each SNP on HT risk. (C) Funnel plot assessing heterogeneity of Mendelian randomization (MR) estimates for the effect of C5 levels on HT risk. (D) Leave-one-out analysis demonstrating that the overall risk estimate was not substantially influenced by any individual SNP. Please click here to download this file.
Supplementary Figure 7: Causal association between CD3+CD39+ regulatory T cells and Hashimoto thyroiditis risk. (A) Forest plot showing the total causal effect of CD3+CD39+ regulatory T cells on HT risk. (B) Scatter plot showing the causal effect estimate for each SNP on HT risk. (C) Funnel plot assessing heterogeneity of MR estimates for the effect of CD3+CD39+ regulatory T cells on HT risk. (D) Leave-one-out analysis demonstrating that the overall risk estimate was not substantially influenced by any individual SNP. Please click here to download this file.
Supplementary Table 1: Characteristics of genome-wide association study datasets for plasma metabolites used in Mendelian randomization analysis. Please click here to download this file.
Supplementary Table 2: Characteristics of instrumental variables (SNPs) and F-statistics for key immune cell phenotypes used as exposures in Mendelian randomization analysis. Please click here to download this file.
Supplementary Table 3: Pleiotropy assessment for Mendelian randomization analyses of immune cell phenotypes on Hashimoto thyroiditis. Please click here to download this file.
Supplementary Table 4: Heterogeneity assessment for Mendelian randomization analyses of immune cell phenotypes on Hashimoto thyroiditis. Please click here to download this file.
Supplementary Table 5: Pleiotropy assessment for Mendelian randomization analyses of Hashimoto thyroiditis on immune cell phenotypes. Please click here to download this file.
Supplementary Table 6: Heterogeneity assessment for Mendelian randomization analyses of Hashimoto thyroiditis on immune cell phenotypes. Please click here to download this file.
Supplementary Table 7: Single-nucleotide polymorphisms associated with plasma metabolites. Please click here to download this file.
Supplementary Table 8: Pleiotropy assessment for Mendelian randomization analyses of plasma metabolites on Hashimoto thyroiditis. Please click here to download this file.
Supplementary Table 9: Heterogeneity assessment for Mendelian randomization analyses of plasma metabolites on Hashimoto thyroiditis. Please click here to download this file.
Supplementary Table 10: Pleiotropy assessment for mediation analyses of immune cell phenotype–Hashimoto thyroiditis associations by plasma metabolites. Please click here to download this file.
Supplementary Table 11: Heterogeneity assessment for mediation analyses of immune cell phenotype–Hashimoto thyroiditis associations by plasma metabolites. Please click here to download this file.
Supplementary File 1: Data supporting the findings of this study.Please click here to download this file.
Discussion
In this study, Mendelian randomization was applied to investigate the causal impact of immune cell phenotypes on Hashimoto's thyroiditis (HT) and to explore the potential mediating role of plasma metabolites. Thirty-two immune phenotypes were found to be associated with HT risk, encompassing dendritic cells, regulatory T cells, T cell maturation stages, B cells, and myeloid cells, with both risk-promoting and protective effects. Moreover, 9 plasma metabolites showed causal links to HT, and further observed that C5 may partially mediate the association between CD3 expression on CD39⁺ secreting Treg cells and HT. These findings should be interpreted as evidence of putative causal effects inferred from genetic instruments, rather than direct mechanistic confirmation.
Among cDC phenotypes, CD62L- plasmacytoid DC %DC and HLA DR on plasmacytoid DC were associated with an increased risk of HT, whereas CCR2 on CD62L+ myeloid DC, CD39+ activated Treg %activated Treg,and CD62L on monocyte. The identified associations between specific immune cell phenotypes and HT offer new insights into the pathogenesis of the disease. For example, HT risk was found to be correlated with characteristics such as HLA DR on plasmacytoid DC and CD62L-plasmacytoid DC, indicating that these cell types may be essential in initiating or maintaining autoimmune reactions against the thyroid gland 28 . Numerous investigations have demonstrated that HLA DR+ thyroid epithelial cells actively stimulate immune responses within the thyroid gland of patients with HT28,29,30,31. This study revealed a correlation between HLA DR on plasmacytoid and an elevated risk of HT, indicating that HLA DR on plasmacytoid may be a causal factor in HT. Previous studies have identified pivotal genes with high diagnostic accuracy for HT by bioinformatics methods, and immunoassays have shown that monocyte infiltration is negatively correlated with pivotal gene expression. Xu et al.32 reported that higher levels of CD62L expression on monocytes were associated with a reduced risk of HT, consistent with the current findings. Specifically, phenotypes such as CCR2 on CD62L+ myeloid dendritic cells and CD62L on monocytes were linked to a protective effect, indicating potential regulatory or suppressive roles that could mitigate thyroid autoimmunity.
Numerous lines of evidence point to the critical role that Th17 and Treg cell balance plays in the advancement of HT33,34. This investigation identified a causal link between HT and several Treg characteristics. Specifically, the risk of developing HT was inversely associated with CD25 expression on CD39+ resting regulatory T cells, while the Th17/Treg ratio was observed to rise with the progression of HT35. The intricate function of regulatory T cells in preserving immunological tolerance and averting autoimmune disorders is highlighted by the strong correlations of different Treg phenotypes with both elevated and lowered HT risk. Treg cells are dual, with some subsets potentially exacerbating autoimmune responses while others suppress them. This underscores the need for additional research to precisely define their roles in HT.
Moreover, within the T cell maturation stages, TBNK, monocyte, and B cell groups, a consistent pattern was observed in which some immune phenotypes were linked to a higher risk of HT, while others appeared to confer a protective effect32,36,37,38. This underscores the intricate involvement of immune cells in the development of HT. Inverse MR analysis was also performed to examine the effect of HT on immune cell features. The analysis revealed that HT was associated with increased levels of certain immune cell phenotypes, such as secreting CD4 regulatory T cells and monocytic MDSCs, and decreased levels of others, notably activated CD4 regulatory T cells and CD25+ CD4+ T cells.
Notably, the mediation analysis highlights the causal role of C5 levels in the progression from immune cell phenotypes to HT development. Previous studies have shown that plasma C5 levels contribute to the development of diabetic peripheral neuropathy39 and are correlated with both sarcopenia and reduced skeletal muscle index40. Additionally, in terms of lipid metabolism, lower concentrations of isovalerylcarnitine have been observed in individuals with a frailty phenotype41. The mediation proportion of 8.89% observed in this study suggests that C5 may represent a putative mechanistic link in the CD39+ Treg–HT pathway, and warrants further investigation as a candidate biomarker and therapeutic target in prospective experimental and clinical studies.
While this study provides valuable insights, some limitations warrant consideration. First, the MR approach relies on the assumption that the instrumental variables used are valid and not influenced by confounding factors or pleiotropy42,43,44. Second, the primary MR analyses were based on European-ancestry GWAS data, and the immune cell GWAS was derived from a Sardinian founder population whose distinct linkage disequilibrium structure may limit generalizability; future studies in diverse, non-European cohorts are needed to confirm population-specific applicability. Third, the mediation analysis identified C5 as a factor that may represent an exploratory link. Future studies incorporating more diverse cohorts are necessary to confirm these associations and explore potential population-specific effects. Finally, flow cytometry and plasma validation experiments provided supportive evidence for the MR findings; however, the sample size was relatively limited. Larger experimental and clinical studies are necessary to validate these immune metabolic interactions and to explore whether targeting CD39⁺Treg cells or related metabolic pathways may offer new therapeutic opportunities for HT.
Conclusion
In conclusion, this study provides novel insights into the causal relationships between immune cell phenotypes, particularly CD39+ Tregs, and HT, with C5 identified as a candidate mediator in this pathway based on exploratory mediation analysis. These findings reveal a novel immunometabolic axis, offering mechanistic insights and potential targets for biomarker development and therapeutic intervention in autoimmune thyroid disease. Future studies with larger prospective cohorts can further validate these findings and explore the potential application value of immunomodulation in HT treatment.
Disclosures
The authors declare that the research was conducted in the absence of any commercial or financial relationships that could be construed as a potential conflict of interest.
Acknowledgements
We are grateful to all the studies that have made the public GWAS summary data available. This article is funded by the Specialized Regional Medical Center of Inner Mongolia Autonomous Region.
Materials
| Name | Company | Catalog Number | Comments |
|---|---|---|---|
| CD25-PE monoclonal antibody | BD Biosciences | 340938 | Flow cytometry antibody for human CD25 detection |
| CD39-PE-Cy7 monoclonal antibody | BD Biosciences | 567526 | Flow cytometry antibody for human CD39 detection |
| CD4-FITC monoclonal antibody | BD Biosciences | 340133 | Flow cytometry antibody for human CD4 detection |
| D3-APC monoclonal antibody | BD Biosciences | 555333 | Flow cytometry antibody for human CD3 detection |
| FACS Lysing Solution | BD Biosciences | 349202 | Red blood cell lysis buffer for flow cytometry sample preparation |
| Flow cytometer | BD Biosciences | FACSCanto II | Multicolor flow cytometry instrument for immunophenotyping |
| Flow cytometry analysis software (FACSDiva) | BD Biosciences | — | Software for acquisition and analysis of flow cytometry data |
| gwasglue package | R package | — | Harmonization of GWAS datasets |
| ieugwasr package | R package | — | Interface to IEU GWAS database |
| Liquid chromatography–tandem mass spectrometry system (LC–MS/MS) | Thermo Fisher Scientific | — | Used for quantification of plasma isovalerylcarnitine (C5) |
| Phosphate-buffered saline (PBS) | Thermo Fisher Scientific | AM9624 | Sterile PBS, pH 7.4, used for washing and resuspension |
| R software | Open source software | Version 4.4.1 | Statistical analysis environment |
| TwoSampleMR package | R package | — | Mendelian randomization analysis package |
| VariantAnnotation package | Bioconductor | — | Variant data annotation |
References
- Koca SB, Seber T. Factors affecting thyroid elastography in healthy children and patients with Hashimoto’s thyroiditis. J Clin Res Pediatr Endocrinol. 2023;15(1):7-15.
- Zhao T, et al. Comparison of various ultrasound-based malignant risk stratification systems on an occasion for assessing thyroid nodules in Hashimoto's thyroiditis. Int J Gen Med. 2023;16:599-608.
- Chen P, et al. Effect of large dosage of Prunella on Hashimoto's thyroiditis: a protocol of systematic review and meta-analysis of randomized clinical trials. Medicine (Baltimore). 2020;99(50):e23391.
- Won JH, et al. Thyroid nodules and cancer in children and adolescents affected by Hashimoto's thyroiditis. Br J Radiol. 2018;91(1087):20180014.
- Liu Y, et al. The impact of coexistent Hashimoto’s thyroiditis on central compartment lymph node metastasis in papillary thyroid carcinoma. Front Endocrinol (Lausanne). 2021;12:772071.
- Weetman AP. An update on the pathogenesis of Hashimoto's thyroiditis. J Endocrinol Invest. 2021;44(5):883-890.
- Ihnatowicz P, et al. The importance of nutritional factors and dietary management of Hashimoto's thyroiditis. Ann Agric Environ Med. 2020;27(2):184-193.
- Ragusa F, et al. Hashimoto's thyroiditis: epidemiology, pathogenesis, clinic and therapy. Best Pract Res Clin Endocrinol Metab. 2019;33(6):101367.
- Janicki L, et al. Prevalence and impact of BRAF mutation in patients with concomitant papillary thyroid carcinoma and Hashimoto's thyroiditis: a systematic review with meta-analysis. Front Endocrinol (Lausanne). 2023;14:1273498.
- Hwangbo Y, Park YJ. Genome-wide association studies of autoimmune thyroid diseases, thyroid function, and thyroid cancer. Endocrinol Metab (Seoul). 2018;33(2):175-184.
- Hu Y, et al. Effect of selenium on thyroid autoimmunity and regulatory T cells in patients with Hashimoto's thyroiditis: a prospective randomized-controlled trial. Clin Transl Sci. 2021;14(4):1390-1402.
- Ralli M, et al. Hashimoto's thyroiditis: an update on pathogenic mechanisms, diagnostic protocols, therapeutic strategies, and potential malignant transformation. Autoimmun Rev. 2020;19(10):102649.
- Pyzik A, et al. Immune disorders in Hashimoto's thyroiditis: what do we know so far? J Immunol Res. 2015;2015:979167.
- Zhang QY, et al. Lymphocyte infiltration and thyrocyte destruction are driven by stromal and immune cell components in Hashimoto's thyroiditis. Nat Commun. 2022;13(1):775.
- Zheng H, et al. A global regulatory network for dysregulated gene expression and abnormal metabolic signaling in immune cells in the microenvironment of Graves' disease and Hashimoto's thyroiditis. Front Immunol. 2022;13:879824.
- Guo J, et al. Treg cells as a protective factor for Hashimoto's thyroiditis: a Mendelian randomization study. Front Endocrinol (Lausanne). 2024;15:1347695.
- Xu D, Wu B. Association between systemic lupus erythematosus and osteoporosis: a Mendelian randomization analysis. BMC Rheumatol. 2024;8(1):17.
- Moon G, Park JH, Lee T, Yoon JH. A machine learning-based model for preoperative assessment and malignancy prediction in patients with atypia of undetermined significance thyroid nodules. J Clin Med. 2024;13(24):7769.
- Yan J, et al. Gut microbiota's role in glioblastoma risk, with a focus on the mediating role of metabolites. Front Neurol. 2024;15:1386885.
- Portilla-Fernandez E, et al. Genetic and clinical determinants of abdominal aortic diameter: genome-wide association studies, exome array data and Mendelian randomization study. Hum Mol Genet. 2022;31(20):3566-3579.
- Bowden J, Holmes MV. Meta-analysis and Mendelian randomization: a review. Res Synth Methods. 2019;10(4):486-496.
- Luo H, et al. Causal relationships between CD25 on immune cells and hip osteoarthritis. Front Immunol. 2023;14:1247710.
- Zha B, et al. Distribution of lymphocyte subpopulations in thyroid glands of human autoimmune thyroid disease. J Clin Lab Anal. 2014;28(3):249-254.
- Burgess S, et al. A review of instrumental variable estimators for Mendelian randomization. Stat Methods Med Res. 2017;26(5):2333-2355.
- Bowden J, et al. Mendelian randomization with invalid instruments: effect estimation and bias detection through Egger regression. Int J Epidemiol. 2015;44(2):512-525.
- Bowden J, et al. Consistent estimation in Mendelian randomization with some invalid instruments using a weighted median estimator. Genet Epidemiol. 2016;40(4):304-314.
- Hartwig FP, et al. Robust inference in summary data Mendelian randomization via. the zero modal pleiotropy assumption. Int J Epidemiol. 2017;46(6):1985-1998.
- Zhao Z, et al. Causal role of immune cells in Hashimoto's thyroiditis: Mendelian randomization study. Front Endocrinol (Lausanne). 2024;15:1352616.
- Wang C, et al. Causal role of immune cells in schizophrenia: Mendelian randomization study. BMC Psychiatry. 2023;23(1):590.
- Aichinger G, et al. In situ immune complexes, lymphocyte subpopulations, and HLA-DR-positive epithelial cells in Hashimoto thyroiditis. Lab Invest. 1985;52(2):132-140.
- Yu M, et al. Discordant expression of Ii and HLA-DR in thyrocytes: a possible pathogenetic factor in Hashimoto's thyroiditis. Endocr Pathol. 1998;9(3):201-208.
- Xu B, et al. Comprehensive analysis of hub biomarkers associated with immune and oxidative stress in Hashimoto's thyroiditis. Arch Biochem Biophys. 2023;745:109713.
- Fang J, et al. The changes in peripheral blood Th17 and Treg ratios in Hashimoto's thyroiditis are accompanied by differential PD-1/PD-L1 expression. Front Endocrinol (Lausanne). 2022;13:959477.
- Wang W, et al. Leptin receptor antagonist attenuates experimental autoimmune thyroiditis in mice by regulating Treg/Th17 cell differentiation. Front Endocrinol (Lausanne). 2022;13:1042511.
- Liu Y, et al. Th17/Treg cells imbalance and GITRL profile in patients with Hashimoto's thyroiditis. Int J Mol Sci. 2014;15(12):21674-21686.
- Cai YJ, et al. Hashimoto's thyroiditis induces neuroinflammation and emotional alterations in euthyroid mice. J Neuroinflammation. 2018;15(1):299.
- Raoof IB, et al. The prevalence role of monocyte chemoattractant protein-1 in Hashimoto's thyroiditis via .various stimuli mechanisms. J Pharm Bioallied Sci. 2021;13(2):244-247.
- Krysiak R, Okopien B. The effect of levothyroxine and selenomethionine on lymphocyte and monocyte cytokine release in women with Hashimoto's thyroiditis. J Clin Endocrinol Metab. 2011;96(7):2206-2215.
- An Z, et al. Correlation between acylcarnitine and peripheral neuropathy in type 2 diabetes mellitus. J Diabetes Res. 2022;2022:8115173.
- Meng L, et al. Specific lysophosphatidylcholine and acylcarnitine related to sarcopenia and its components in older men. BMC Geriatr. 2022;22(1):249.
- Meng L, et al. Specific metabolites involved in antioxidation and mitochondrial function are correlated with frailty in elderly men. Front Med (Lausanne). 2022;9:816045.
- Valencia-Hernández CA, Del Greco MF, Sundaram V, Portas L, Minelli C, Bloom CI. Asthma and incident coronary heart disease: an observational and Mendelian randomisation study. Eur Respir J. 2023;62(5):2301788.
- Li W, et al. Assessment of the relationship between telomere length and atherosclerosis: a Mendelian randomization study. Medicine (Baltimore). 2023;102(46):e35875.
- Morgan RA, et al. Carbonyl reductase 1 catalyzes 20β-reduction of glucocorticoids, modulating receptor activation and metabolic complications of obesity. Sci Rep. 2017;7(1):10633.