Here, we present a protocol for combining iterative protein staining (IBEX) with RNAscope in situ hybridization technology for the deep spatial phenotyping of intact fixed frozen tissues for high-resolution spatial profiling applications.
Method Article
vmaltez@health.ucsd.edu
Corresponding Authors: Vivien I. Maltez <vmaltez@health.ucsd.edu>
* These authors contributed equally
Here, we present a protocol for combining iterative protein staining (IBEX) with RNAscope in situ hybridization technology for the deep spatial phenotyping of intact fixed frozen tissues for high-resolution spatial profiling applications.
Here, we present a protocol to enable simultaneous spatial profiling of protein and ribonucleic acid (RNA) markers at single-cell resolution in intact tissues. One of the core issues surrounding solid tumor cancers is the inability to predict patient responsiveness to therapeutic intervention. Deciphering these complexities requires quantitative measurement of cellular behaviors, interactions, and phenotypes within intact tissues. Specifically, the proteome and transcriptome provide overlapping but nonredundant information that can be critical to designing rational immunotherapeutics. However, there is not currently a straightforward and cost-effective way to deeply profile both the transcriptional and functional state of all cells in the tumor microenvironment while retaining their critical spatial localization information. To this end, we have successfully combined the IBEX (iterative bleaching extends multiplexity) platform with HiPlex RNAscope to simultaneously visualize high-plex protein markers and high-plex ribonucleic acid (RNA) transcripts with single-cell resolution. This approach incorporates a modified RNA target retrieval step to preserve nuclear morphology and enable accurate image alignment across cycles. “Bex-Plex” enables us to perform an unmodified IBEX protocol on fixed frozen tissues followed by the HiPlex RNAscope protocol, in which we use a modified RNA target retrieval to ensure nuclear-level alignment with IBEX cycles. This protocol is optimized for fixed frozen tissues and enables integrated spatial analysis of transcriptional and functional cellular states. The power to profile at this single-cell level not only provides a deep well of information about the tissue itself but can also empower predictions about the nuanced cellular interactions that drive therapeutic responsiveness, providing a framework for studying spatial biology in tumor microenvironments and related systems.
Since their introduction in 2011, cancer immunotherapies that decrease the suppression of cytotoxic T cells by blocking inhibitory immune checkpoint molecules such as PDL-1 and CTLA-4 have emerged as the gold standard for solid tumor treatment1. However, despite large-scale use in patients, the clinical efficacies of these drugs vary widely because many solid tumor cancers either intrinsically present with or eventually generate resistance to these therapies2. In many cases this is due to the extremely heterogeneous nature of solid tumors, even among the same cancer type3. A more in depth understanding of the cell relationships that occur in solid tumors is key to generating improved treatment modalities. Thus, identifying the exact mechanisms and interactions that mount and sustain this resistance is at the forefront of cancer research. Here, we aim to develop a method that enables integrated spatial analysis of protein and RNA expression within intact tissues to better characterize these complex cellular interactions.
The tumor microenvironment (TME) is composed of the non-cancerous cellular and structural components that shape tumor growth and immune response, including cancer associated fibroblasts, infiltrating immune cells, vascular components, and the extracellular matrix4. Recently, it has become evident that the composition and organization of the TME strongly influence whether tumors are permissive or resistant to immune infiltration, one of the main factors dictating responsiveness to immunotherapy5. In many cancers, an “immune desert” phenotype, characterized by low numbers of T cells and the presence of highly immunosuppressive myeloid populations, correlates with poor responsiveness to checkpoint blockade therapies6,7. Chemokine signaling governs many of these recruitment dynamics. For example, CXCL1 and CCL2 attract immunosuppressive myeloid cells, while the CXCR3-CXCL9/CXCl10 axis recruits both cytotoxic and regulatory T cells into the tumor8. Consequently, the niche-specific signaling environment can potently influence cell phenotype and function. For instance, in colorectal cancer patients, the CCL5-CCR5 axis controls the suppressive function of tumor associated macrophages (TAMs) and blocking this signal skews TAM toward an anti-tumorigenic phenotype and correlates with improved clinical responses9. Furthermore, direct interactions between immune cells, cancer associated fibroblasts, and/or tumor cells via ICAM and PDL-1 can induce immune exhaustion and blunt antitumor immunity10. Together, these findings underscore the importance of spatially resolved analyses to understand how the TME influences therapeutic efficacy.
Immunofluorescent (IF) imaging remains a foundational approach for visualizing protein expression and cell-cell interactions in tissue. The field has advanced from conventional 3-4 color IF to high-content imaging workflows that rely on iterative staining and imaging. In these methods, large datasets are generated via repeated cycles of antibody labeling, imaging, and fluorophore inactivation or removal so that additional markers can be stained and imaged11. Iterative Bleaching Extends Multiplexity (IBEX) was recently introduced as a user-friendly and cost-effective iterative imaging platform12. Compatible with the use of commercial antibodies and conventional microscopes, IBEX utilizes lithium borohydride (LiBH4) to quench the fluorescence of most commonly used dyes without damaging tissue epitopes, allowing for the acquisition of up to 75 parameters for a single tissue13. The images obtained from this cyclic staining are aligned using the SimpleITK open-source software to produce composite datasets suitable for high-dimensional spatial analyses.
Complementary to protein-level phenotyping, spatial transcriptomic methods can provide valuable information about the transcriptional state of cells within their native environment. Notably, in-situ hybridization (ISH) is a popular technique to identify the localization of DNA or RNA sequences in a specific tissue11. RNAscope is a well-established ISH approach that uses probes with a unique Z chemistry to specifically amplify RNA transcripts at single-molecule resolution and is compatible with many different sample types14. As a widely adopted and commercially available platform through Advanced Cell Diagnostics (ACD), RNAscope offers validated probes against a wide variety of targets, simplifying experimental design for diverse applications.
A more complete view of cell identity and functions can be gained by combining protein and RNA detection within the same tissue. Short-lived secreted proteins, such as cytokines and chemokines, traditionally lack reliable antibody staining by IHC, but information about their expression can be gained through the quantification of their mRNA transcripts. Previous attempts to co-detect RNA and protein, such as conventional chromogenic IHC or TSA-OPAL, have been limited by nonlinear signal amplification and time- consuming antigen retrieval protocols15. Compared to these approaches, the Bex-Plex method enables simultaneous high-plex protein and RNA detection while preserving spatial context and nuclear morphology for accurate image registration.
Here we present “Bex-Plex”, a protocol that integrates the IBEX and RNAscope platforms for simultaneous, quantifiable characterization of the transcriptional and translational states of cells within their native tissues. In Bex-Plex, fixed OCT embedded tissues undergo the standard IBEX protocol followed by a slightly modified RNAscope HiPlex workflow, wherein target retrieval is performed at 60°C with a 1 h incubation time as compared to the original 99°C incubation for 5 min. This preserves the architecture of the nuclei, allowing for an accurate alignment of fiducial markers when registering the separate images from the IF and ISH cycles into one. This protocol is best suited for studies requiring simultaneous spatial analysis of protein and RNA expression in intact tissues, particularly when tissue availability is limited or when preserving spatial architecture is critical, such as in tumor microenvironment analysis or immune profiling studies.
Using widely available reagents and compatible with most imaging platforms, Bex-Plex can be carried out by any technically trained research personnel familiar with fluorescent imaging and with access to a conventional microscope. The protocol presented here is optimized for fixed frozen samples. At present, the protocol has been validated in fixed frozen tissues, and further optimization may be required for application to other sample types such as FFPE or human clinical specimens.
This workflow will be invaluable for any context where tissue is limited or precious, such as tissue biopsies or animal experiments that have a limited sample size, as well as for the phenotyping of cells that may be difficult to extract using dissociative techniques. Bex-Plex provides simultaneous, quantifiable information about the transcriptional and translational profiles of single cells while retaining their spatial context, data that is uniquely poised to answer questions about the relationships and crosstalk between cells in their original environment.
The procedures outlined in this protocol were approved by the Institutional Animal Care and Use Committee of the University of California, San Diego (protocol number S24049). Male and female mice 7-12 weeks of age on a C57BL/6 genetic background and housed under specific pathogen-free conditions were used for these experiments.
1. Tissue preparation
2. Tissue sectioning
Note: All reagents and lab materials used for this protocol must be RNase free. Take care to prevent contamination when handling slides.
3. Protein staining
4. Fluorophore bleaching and iterative protein staining
5. Slide preparation for RNAscope HiPlex
6. RNAscope reagent preparation and probe hybridization
7. Probe amplification
Note: Ensure that all reagents are equilibrated to RT before applying to slides.
8. Cleaving the fluorophores and iterative RNA hybridization
9. Image processing

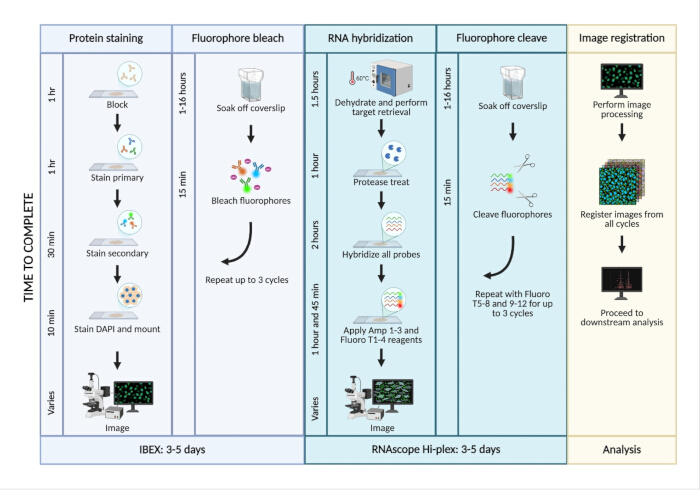
Figure 1 : Overview of Bex-Plex workflow.
Fixed frozen tissues sectioned onto chrome alum-coated slides undergo up to 3 cycles of standard IBEX followed by up to three cycles of RNAScope HiPlex wherein the initial target retrieval step is performed at 60°C for 1 h. Images from separate cycles are then registered and aligned using a fiducial marker (e.g., DAPI) to create a multiplex dataset for downstream analysis. Please click here to view a larger version of this figure.
We utilized the protocol described above to profile the tumor microenvironment (TME) of a murine pancreatic ductal adenocarcinoma (PDAC) model (Figure 1). A tumor line isolated from KrasLSL-G12D/+;Trp53L/+;Pdx1-Cre;Rosa26YFP/YFP (KPCY) mice, which spontaneously develop pancreatic cancer and recapitulate many of the key features of human PDAC, was subcutaneously injected into the flank of C57BL/6 mice7. Tumor-bearing mice were then treated with combination immunotherapy consisting of anti-PD-1 (i.p. 200 µg•mouse-1 , RMP1-14) and anti-CTLA-4 (i.p., 200 µg•mouse-1, 9H10) administered day 10 post implantation and continued every 3 days until experiment endpoint. Agonistic anti-CD40 (i.p., 100 µg•mouse-1, FGK45) was given as a singular dose day 13 post implantation. Together, we refer to this as “FPC,” as previously published7,16. Three tumors per experimental group were collected at 16 days post-implantation and fixed-frozen sections were mounted onto chrome alum coated slides for Bex-Plex.

Figure 2: Representative IBEX + RNAscope (Bex-Plex) results.
(A) Combined IBEX and RNAscope staining in pancreatic ductal adenocarcinoma (PDAC) tumor sections demonstrates co-detection of protein and RNA targets and alignment of fluorescence channels. Scale bar, 10 µm. (B) Quantification of T cell (CD3+ CD11b-), macrophage (CD11b+ CD68+), and myeloid (CD11b+ CD68- Ly6G +/-) immune compartments based on protein marker channel intensities. Graphs show the mean cell density for each cell type by treatment group, n=3 tumors. (C) Quantification of Pdl1 and Il10 transcript-expressing cells in the immune compartments previously identified by protein. Graphs show the mean cell density by treatment group, n=3 tumors. Please click here to view a larger version of this figure.
One cycle of protein staining was performed on three FPC- treated tumors and three isotype-treated tumors to assess effects on myeloid lineage cells between treatment groups. Seven parameters were acquired, though we focus here on three markers of interest: CD11b, Ly6G, and CD68 (Figure 2A). After image acquisition, the fluorophores from the protein staining were bleached and one round of RNAscope was performed using probes against Il10 and Pdl1 (Figure 2A). The separate images were then aligned using DAPI as the fiducial (Figure 2A). Quantitative mean fluorescence intensity of CD11b, CD68, Ly6G and CD3 revealed a trend toward fewer macrophages and myeloid cells in FPC-treated tumors relative to controls (Figure 2B). Quantitative comparisons were performed across all samples, and data are presented as mean values. Furthermore, the number of cells expressing Pdl1, Il10, or a combination of both transcripts in both the macrophage and myeloid compartments showed a downward trend with FPC treatment compared to controls (Figure 2C). These results indicate a potential reduction in immunosuppressive cell populations following treatment, consistent with expected biological responses.

Figure 3: Optimization of target retrieval conditions for nuclear preservation.
(A) Representative image of a tissue after RT target retrieval showing nuclear swelling and indistinct morphology. Examples of nuclear sizes are indicated by yellow outlines. Scale bar, 40 µm. (B) Representative image of a tissue after modified target retrieval showing improved nuclear morphology with adjusted temperature conditions. Examples of nuclear size indicated by yellow outlines. Scale bar, 40 µm. (C) Mean nuclear volume determined by DAPI-based segmentation on tissues that underwent RT target retrieval (not pre-warmed), 60°C prewarmed target retrieval, or under standard IF conditions with no target retrieval. Graph bars indicate mean and error bars show standard deviation. ****P < 0.0001 by ordinary one-way ANOVA (asterisks denote statistical significance threshold); n= 1639 cells per condition. (D) Heatmaps representing the correlation scores between three images before and after image alignment. Correlation scores are shown for a successful registration and a registration that failed to align due to differences at a nuclear level.
Importantly, when Bex-Plex was performed without the modified target retrieval described, the nuclei appeared enlarged with indistinct edges compared to the nuclei from a tissue where the modified target retrieval was correctly performed (Figure 3A and B). Use of room temperature target retrieval regent led to a 33% increase in mean nuclear volume based on DAPI staining compared to target retrieval performed using reagent that was prewarmed to 60°C (Figure 3C). Nuclear volume measurements were obtained from representative fields across samples using DAPI-based segmentation. Moreover, when this step was performed at 60°C using prewarmed retrieval reagent, the mean nuclear volume did not significantly differ from the mean nuclear volume after standard IF staining (Figure 3C). As DAPI is the most effective parameter to use as a reference for image alignment, this comparison (Figure 3) highlights the critical importance of the modified retrieval parameters to preserve nuclear morphology. Correct image registration is indicated by an alignment correlation score that is close to 1, indicating similarity between images of different cycles (Figure 3D, before vs successful).
Successful implementation of the protocol is indicated by preserved nuclear morphology, strong and specific RNA signal, and accurate alignment of protein and RNA channels. In contrast, suboptimal outcomes may include nuclear distortion, weak or diffuse RNA signal, and misalignment between imaging cycles (Figure 3D, before vs failed). As shown in Figure 3C, the nuclear morphology should be retained throughout the protocol, and will be both qualitatively and quantitatively apparent. Prior to Bex-Plex implementation, users should ascertain the ground truth for their tissues of interest via separate protein and RNA staining. Not only does this ensure optimized protein and RNA staining for the target tissues, but provides relevant spatial patterns that should be retained when combined for Bex-Plex. For example, CD11b colocalizes with both CD68 and Ly6G and shows cell membrane-localized staining (Figure 2A). This is expected, as CD11b is a pan myeloid cell marker and CD68 and Ly6G are markers for the macrophage and neutrophil myeloid subsets. Successful RNA detection is characterized by distinct punctate signals localized to individual cells, whereas suboptimal results may present as weak or diffuse staining. The RNA probe signal should show localization in and around the nucleus, depending on the transcript function. Structural protein markers such as vimentin could be included to improve cellular resolution of transcript localization by revealing cell membranes in complex tissues. Negative or control samples are expected to show minimal background staining and no nonspecific probe signal, confirming the specificity of both protein and RNA detection.
The Bex-Plex workflow integrates the iterative protein staining platform, IBEX, with RNAscope in situ hybridization to enable simultaneous detection of proteins and RNA transcripts at single-cell resolution. The primary goal of this protocol is to provide a reproducible method for integrated spatial analysis of protein and RNA expression within intact tissues. The ability to measure both protein and RNA expression in the same tissue has previously presented technical challenges: high costs, complex antigen retrieval steps, limited multiplex capacity, resolution limitations (non-single cell), nonlinear signal amplification, and extensive bioinformatics pipelines for downstream processing 17,18,19. Compared to existing approaches such as multiplex immunofluorescence, OPAL/TSA staining, and spatial transcriptomics platforms, Bex-Plex enables reproducible, quantitative, and high-plex simultaneous detection while preserving spatial context and nuclear morphology for accurate image alignment. Additionally, Bex-Plex can be performed in a standard lab environment and generates data at a single cell resolution that is straightforward to process. Leveraging this protocol to gain a comprehensive understanding of cell-cell interactions within a variety of tissue contexts, such as in the tumor microenvironment, will be essential for developing more effective immunotherapies and improving patient outcomes across disease states.
Our method is performed on fixed tissues embedded in OCT and follows the standard IBEX workflow without modification, followed by a slightly altered RNAscope HiPlex protocol. A key difference is the target-retrieval step at the beginning of the RNA hybridization workflow: instead of the manufacturer’s 99°C for 5 min, retrieval is performed at 60°C for 1 h. This adjustment preserves nuclear architecture, which is imperative for accurate image alignment between protein and RNA cycles. Critical steps of this protocol include maintaining consistent target retrieval temperature, efficient fluorophore bleaching using LiBH₄, and minimizing RNA degradation through rapid processing and use of RNase-free reagents. It is most important to ensure the use of pre-warmed target retrieval reagents at 60°C; failure to do so can cause nuclear swelling even with the altered incubation step.
While it has been shown that 15 min of incubation with LiBH4 is adequate to inactivate many commonly used fluorophores, it is recommended to individually verify this process for each protein cycle before running the whole Bex-Plex protocol. In the initial IBEX publications it is well characterized that not all IBEX-compatible flurophores are equally bleachable12. Additionally, our lab has observed that some high abundance structural markers such as vimentin may require a longer bleaching time. Confirming that the fluorophore and marker combinations being used will adequately bleach should prevent residual signal spill into subsequent protein and RNA cycles. The IBEX Community page has excellent resources for IBEX-compatible panel design and is specifically intended to reduce the burden on new users by indicating antibody efficacy and fluorophore bleaching times20. Furthermore, iterative staining and bleaching should not affect RNA transcript quality, however it is important to complete protein cycles as fast as possible and use RNAse-free reagents to minimize any RNA degradation that may happen over time. Failure to do so will affect probe hybridization and lead to decreased signal for any RNAscope cycles performed, particularly for low abundance transcripts. Common issues encountered during the protocol include weak RNA signal, incomplete fluorophore bleaching, and misalignment between imaging cycles, which can be mitigated through optimization of staining conditions and imaging parameters.
It is imperative to limit the time spent between performing protein staining and RNA probe hybridization to less than 5 days. When performing Bex-Plex on multiple slides, it is highly advised to process one slide at a time to reduce variability in RNA degradation. Similarly, limit the time between probe hybridization and imaging. While we have successfully imaged up to 3 days post amplification, longer storage is not recommended. If there is reduced signal after multiple cycles of staining or hybridization, it may be necessary to increase speed throughout the protocol. Ideally, we recommend working as fast as possible, as delays reduce RNA integrity and can diminish amplification. Other approaches include reducing the number of protein cycles performed to more easily fit into the timeline constraints of the protocol or changing RNA probe panel design to include higher abundance targets. Before combining IBEX and RNAscope, validate the antibody and probe panels for each cycle separately to determine the expected signal quality for each cycle. In the event of nuclear swelling after the target retrieval, it is possible that the target retrieval reagent was not prewarmed properly. Ensure that the retrieval reagent is not allowed to cool down once it is diluted and prewarmed to 60°C and that the temperature stays consistent during the 1 h on-slide incubation. Lastly, if image registration and alignment fails in the absence of nuclear swelling, it means that there was a mismatch in image acquisition parameters such as bit depth, voxel size, or Z position across cycles. In the event of such errors, it may be necessary to repeat the protocol with adjustments to these settings so that they are consistent. These troubleshooting strategies are essential for ensuring reproducibility and consistency across experiments.
The data generated by Bex-Plex enables an in-depth view of the spatial landscape of tissues on a previously unattainable level. However, a major limitation of this protocol is the fact that the total number of iterative protein cycles possible is lower than with IBEX alone due to gradual RNA degradation over time. While up to 6 cycles of standard IBEX have been performed, we do not recommend exceeding 3 cycles of protein staining for Bex-Plex. Even so, the protocol does accommodate the maximum number of RNAscope cycles and this level of multiplex depth is sufficient for most applications.
Additional limitations include variability across tissue types and potential autofluorescence or staining artifacts that may affect signal interpretation. More fragile tissues can sustain fewer cycles and different tissue types can have unique characteristics that affect staining. These limitations can be assessed via single cycle stains of protein or RNA and addressed prior to running Bex-Plex. Sectioning onto chrome alum-coated slides will substantially improve tissue adherence and structural integrity, but autofluorescence proves a consideration for all immunofluorescence-based techniques. Additionally, at present the protocol has not been validated in FFPE or human clinical samples and will require further optimization for such applications. However, given that IBEX and RNAscope are predominantly performed on formalin-fixed paraffin embedded (FFPE) tissues, it is feasible that Bex-Plex can expand to these sample types. Successful implementation will require further optimization to antigen retrieval and, potentially, target retrieval steps to preserve RNA quality.
Overall, Bex-Plex offers a straightforward, cost-effective, and broadly accessible method for high-plex spatial analyses. This method is particularly well suited for applications such as tumor microenvironment analysis, immune cell profiling, and spatial mapping of signaling interactions. This integrated view enhances the ability to interrogate mechanisms of immune regulation, tumor heterogeneity, and therapeutic responsiveness across a wide range of experimental models. Bex-Plex will be invaluable for contexts where it is necessary to study the crosstalk that occurs between cells in intact tissue, such as in the tumor microenvironment or in other tissue during inflammation and homeostasis. In particular, the ability to resolve spatial dynamics of cytokine signaling by probing for the transcripts of short-lived molecules in conjunction with phenotypic protein markers will provide a deeper understanding of cellular interactions across disease states. Future improvements may include increasing multiplex capacity, integration with automated image analysis pipelines, and adaptation for clinical biopsy samples by expanding the workflow to include FFPE tissues.
The authors declare no competing financial interests. No AI-based tools were used in the preparation of this manuscript.
Author contributions:
SK contributed to data curation, data analysis, investigation, and writing. CM contributed to data curation. PH contributed to data analysis. AV contributed to data curation. VM contributed to conceptualization, data curation, data analysis, supervision, and writing.
This work was supported by the University of California San Diego Department of Pediatrics, Division of Allergy, Immunology, and Rheumatology and NIH NIGMS grant R00GM147841 (MOSAIC K99/R00) and NCI U54CA272220 (UC San Diego FIRST grant). The authors would additionally like to thank Andrea Radtke for establishing the original IBEX method, without which we would have been unable to create Bex-Plex.
| Name | Company | Catalog Number | Comments |
|---|---|---|---|
| 1.5 ml microcentrifuge tubes | Biopioneer | MCNT-1.5F | |
| 200 proof EtOH | Fisher Scientific | BP28184 | |
| 20X SSC buffer | Invitrogen | AM9765 | |
| 24 well plates | |||
| Alexa Fluor 488 anti-mouse CD11b Antibody | Biolegend | 101217 | |
| Alexa Fluor 523 anti-mouse CD3e Antibody | Invitrogen | 58-0032-82 | |
| Alexa Fluor 647 anti-mouse Ly6G Antibody | Biolegend | 127610 | |
| Alexa Fluor 700 anti-mouse CD68 Antibody | Biolegend | 137025 | |
| BD Cytofix/Cytoperm fixation and permeablization solution | BD | 554722 | |
| Chrome alum gelatin | Fisher | NC1692262 | |
| Confocal microscope (e.g Leica Stellaris) | |||
| Cryomolds | VWR | 25608-922 | |
| Cryostat (e.g CryoStar NX50 Cryostat) | Thermofisher Scientific | 957100 | |
| Cryostat blades (e.g Leica Low Profile Disposable Blades DB80LX) | Leica Biosystems | 14035843496 | |
| DAPI | Thermofisher Scientific | 62248 | |
| Dissection microscope (e.g Zeiss SteREO Discovery.V8) | |||
| Dissection tools | |||
| Dry Ice | |||
| Dunk tank for slide staining (e.g Simport Scientific EasyDip Slide Staining Jars) | Fisher Scientific | 22-038-489 | |
| Fluoromount-G | Fisher | OB10001 | |
| Heated water bath | |||
| Histology brushes (e.g. Ted Pella Camel Hair Brushes) | Fisher Scientific | NC2023341 | |
| Hybridization oven (e.g. HybEZ II Hybridization System) | ACD | 321710 | |
| Image analysis software of choice | |||
| ImmEdge Hydrophobic Barrier PAP Pen | Vector Laboratories | H-4000 | |
| Kimwipes | VWR | 21905-026 | |
| Lithium borohydride | STREM Chemicals | 93-0397 | |
| Micropipettes (P-10, P-20, P-200, P-1000) | |||
| Mini Microcentrifuge (e.g. Corning LSE Mini Microcentrifuge) | Corning | 6770 | |
| Mouse BD Fc Block | BD | 553142 | |
| No 1.5 Coverglass | VWR | 48393-241 | |
| Pipette tips (P-10, P-20, P-200, P-1000) | |||
| RNAscope HiPlex Probe, mm-CD274-T7 | ACD | 420501-T7 | |
| RNAscope HiPlex Probe, mm-IL-10-T6 | ACD | 317261-T6 | |
| RNAscope HiPlex12 Reagents Kit v2 (includes detection kit, cleaving stock solution, protease reagents, target retreival reagents, and wash buffer) | ACD | 324409 | |
| RNAscope Protease III | ACD | 322337 | |
| RNase ZAP | Millipore Sigma | R2020-250 | |
| Simple ITK software: https://github.com/niaid/sitk-ibex | |||
| Slide staining tray/humidity chamber | |||
| Sucrose Bioxtra | Sigma | S7903-1KG | |
| Superfrost Plus Microscope slides | VWR | 48311-703 | |
| Tissue-Tek OCT | VWR | 25608-930 | |
| Tween-20, Molecular Biology grade | Promega | H5152 | |
| UltraPure DNase/RNase free water | Fisher Scientific | 10977023 |
Request permission to reuse the text or figures of this JoVE article
Request Permission