This article introduces a multiplex bead-based flow cytometry assay for quantifying up to 12 cytokines and effector molecules from chimeric antigen receptor (CAR)-T cell-derived supernatants, enabling rapid, reproducible analysis of engineered T cell functionality with small sample volumes.
Research Article
Bead-Based Multiplex Flow Cytometry Assay for Functional Profiling of CAR T Cells
In This Article
Summary
Abstract
Profiling CAR T cells presents challenges due to their heterogeneity, complex immune responses, and limited sample availability. Multiplex assays enable functional assessment by allowing the simultaneous detection of a broad range of effector molecules, including cytokines, chemokines, and cytotoxic mediators. Here, we describe a bead-based multiplex assay compatible with flow cytometry for the analysis of effector molecule secretion by human chimeric antigen receptor (CAR)-T cells. CAR T cell supernatants are incubated with a mixture of capture beads comprising multiple fluorescence-coded populations coupled to analyte-specific antibodies. These beads bind soluble targets in the sample, forming bead-analyte complexes that are subsequently detected using labeled detection antibodies. The assay includes a panel of immune mediators such as interferon (IFN)-γ, interleukin (IL)-2, tumor necrosis factor (TNF)-α, IL-6, IL-10, granulocyte-macrophage colony-stimulating factor (GM-CSF), and Granzyme B. The use of predefined standards allows quantitative measurement of multiple analytes from a single sample. Data acquisition and analysis can be performed using automated gating approaches provided by instrument-associated or web-based software tools, facilitating data processing. In conclusion, the presented multiplex assay enables multiparametric analysis of CAR T cell functionality and can be applied in contexts such as research, quality control testing, mechanistic studies, and functional characterization.
Introduction
Functional characterization is essential in Chimeric Antigen Receptor (CAR) T cell testing as it provides insights into the potency, safety, and mechanisms of action of these therapies. Understanding cytokine and cytotoxic mediator signatures aids in evaluating therapeutic efficacy and potential adverse effects, ensuring the development of safe and effective treatments. Traditional single-plex assays like enzyme-linked immunosorbent assays (ELISA) have limitations, such as requiring high sample volumes, lengthy processing times, and separate runs for each analyte, while offering a limited dynamic range within individual samples1,2. In contrast, multiplex bead-based assays enable the simultaneous detection of multiple soluble mediators, reducing processing time and sample requirements while increasing the dynamic range1,2. This efficiency and depth of analysis make multiplex assays valuable tools for advancing CAR T cell research and development3,4,5.
The multiplex assay presented in this study utilizes capture beads, which exhibit defined fluorescence profiles in the fluorescein isothiocyanate (FITC) and phycoerythrin (PE) channels and are coated with specific antibodies against soluble analytes. During incubation with a sample, these beads selectively bind their target analytes from the solution. Following analyte capture, detection antibodies are added to form analyte-specific sandwich complexes. These antibodies are either directly conjugated to allophycocyanin (APC) (direct detection) or to biotin (indirect detection). For indirect detection, a subsequent incubation with an APC-conjugated anti-biotin antibody is required (Figure 1). The resulting complexes – comprising capture beads, analytes, and detection antibodies – are analyzed by flow cytometry to quantify analyte concentrations. The multiplex assay is a plate-based technology, including predefined standards used to generate analyte-specific standard curves1,2.
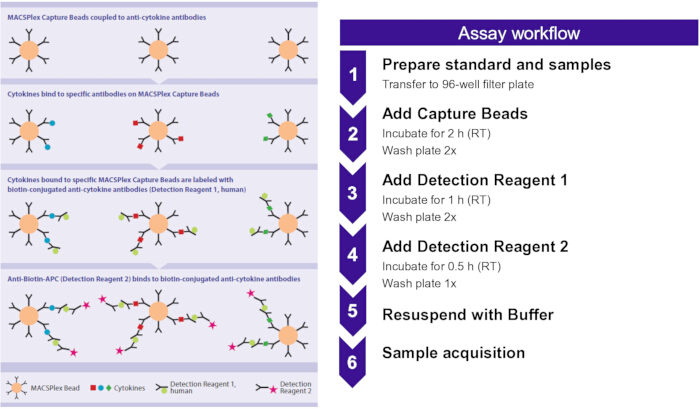
Figure 1: Cytokine technology principle and assay workflow. The assay is based on 12 fluorescence-coded Capture bead populations coupled to analyte-specific antibodies. Upon sample incubation, bead-analyte complexes are formed that can be detected via flow cytometry using specific detection antibodies. The assay workflow includes 1) the preparation of analyte standards and samples of interest on a filter plate, 2) incubation with Capture beads, 3) incubation with biotin-labeled anti-analyte antibodies to form sandwich complexes, 4) incubation with APC-labeled anti-biotin antibodies, 5) resuspension in buffer for measurement, and 6) sample acquisition. Please click here to view a larger version of this figure.
The multiplex assay described in this study is compatible with standard flow cytometers equipped with a blue (e.g., 488 nm; FITC and PE channels) and a red laser (e.g., 635 nm; APC channel). As flow cytometers are widely available in research laboratories, clinical settings, and quality control environments, this compatibility facilitates implementation without requiring additional specialized instrumentation5. In the context of CAR T cell functionality testing, this approach enables multiparametric assessment of functional responses within commonly available analytical workflows6. The assay offers significant advantages for CAR T cell research by enabling the simultaneous quantification of key analytes, including GM-CSF, Granzyme B, interferon (IFN)-γ, interleukin (IL)-2, IL-4, IL-6, IL-10, IL-17A, IL-21, monocyte chemoattractant protein-1 (MCP-1), Perforin, and tumor necrosis factor (TNF)-α (human cytotoxicity panel). These mediators are critical to understanding CAR T cell activation, effector function, and safety-related cytokine release4,5,7,8.
The assay workflow includes options for automated gating and data analysis using instrument-associated software as well as instrument-independent, web-based analysis tools5. These features support streamlined processing of CAR T cell effector molecule profiling data by reducing the extent of manual intervention. The use of automated analysis may contribute to improved consistency in data handling and facilitate more efficient evaluation of functional readouts8.
The present protocol outlines a reproducible, scalable multiplex method for CAR T cell immune mediator profiling. By measuring 12 different analytes in a single sample, the approach is particularly relevant for mechanistic investigations, early-stage research, and concomitant studies. In later stages of CAR T cell therapy, it may be beneficial to reduce the number of cytokines measured, especially in a regulated, time-sensitive quality control (QC) environment for drug release testing. For this purpose, 1 to 7 cytokines from the presented panel can be assembled to design a custom cytokine assay that can be validated for engineered T cell analytics. This makes the described protocol ideally suited for diverse applications across both research and QC settings in both early and late stages of CAR T cell therapy3,4,5,9.
Protocol
All human samples were collected from healthy anonymous volunteers after written informed consent was obtained. All procedures were approved by the Ethics Committee of the Ärztekammer Nordrhein (#2020272) and carried out in accordance with the required ethical and biosafety regulations.
1. CAR T cell co-culture
- Prepare a cell culture of engineered human CAR T cells in the absence and in the presence of cognate antigen, e.g., antigen-presenting tumor cells at a ratio of 2.5:1 (effector : target cells).
- Define one or multiple time points for supernatant collection to analyze secreted cytokines once, or cytokine kinetics over a defined time frame, e.g., at 4, 8, 16, 24, and 48 h.
NOTE: Supernatants might be used directly or can be frozen away for later use.
2. Standard and sample preparation
- Reconstitute the analyte standard by adding 200 µL of buffer or cell culture media to the pellet and mix it gently. Prepare six reagent tubes and perform a 1:5 dilution series of the reconstituted standard, down to 3.2 pg/mL or 0.6 pg/mL (depending on the analyte), and prepare a blank.
- Collect CAR T co-culture supernatants, for example, 16 h or 24 h post-co-culture. Optionally, harvest CAR T cells for parallel phenotyping using flow cytometry.
- Centrifuge the samples at 10,000 × g for 10 min at 4 °C. Use the supernatants neat or dilute them to fit the standard curve range.
3. Assay workflow
- Vortex the capture bead mix to resuspend it thoroughly. Add 50 µL of the standard or sample, along with 20 µL of pre-diluted beads, to the wells of a 96-well filter plate.
- Incubate for 2 h at room temperature, shaking at 450 rpm, in the dark. Wash the wells twice with 200 µL of buffer using a vacuum manifold or centrifuge.
- Add 100 µL of 1:50 pre-diluted detection reagent 1 (in buffer). Incubate for 1 h at room temperature, shaking at 450 rpm, in the dark. Wash twice.
- Add 100 µL of 1:50 pre-diluted detection reagent 2 (in buffer). Incubate for 30 min at room temperature, shaking at 450 rpm, in the dark. Wash once.
- For acquisition, resuspend the samples in 200 µL of buffer. An overview of the assay workflow is shown in Figure 1.
4. Acquisition and data analysis
- Acquire data on a flow cytometer equipped with blue and red lasers (PE, FITC, and APC channels are required). When working with MACSQuant flow cytometers, use the Express Mode templates for fully automated gating and data analysis.
- Alternatively, upload FSC or MQD data files to the web-based InspectoR tool, which performs automated quantitative cytokine measurement and provides ready-to-export results independent of the instrument used.
- Make sure to verify proper separation of the 12 different capture bead populations in the FITC versus PE channel.
- Apply the standard curve to calculate cytokine concentrations, and export and visualize the results.
- For data acquisition on a MACSQuant flow cytometer, use the 2D barcode of the capture beads vial, which contains all relevant acquisition settings.
- After logging in to the software, select the MACSPlex Filter Plate as the sample rack and click the Barcode button on the toolbar to activate the 2D code reader.
- Present the vial to the reader, ensuring the code faces the blinking light at an optimal distance of 0.5–2.5 cm.
- In the Autolabel tab, assign the Capture Beads (MPx Cyt T-NK,h) and NoLabel. For the serial dilutions of the cytotoxic T/NK cell standard, define the group positions and, in the Settings tab, select Express Mode with Type: Analysis and Mode: MACSPlex_Standard, applying gentle mixing as needed.
- Unknown samples are assigned similarly, with their positions defined, optional grouping, and selection of Express Mode, Type: Analysis, and Mode: MACSPlex_Sample in the Settings tab, including optional sample IDs and descriptions.
- Verify that rack definitions are correct in the Experiment table, ensure proper liquid levels in the filter plate wells, and then start the measurement.
Results
Identification of representative Capture bead populations encoding for 12 soluble analytes
Capture bead populations were identified using the FITC and PE channels of the flow cytometer. Distinct bead clusters representing individual analytes were clearly resolved in the biaxial plot, including IL-10, Granzyme B, MCP-1, IL-17A, Perforin, IL-2, IL-6, IFN-γ, TNF-α, IL-21, IL-4, and GM-CSF (Figure 2). Each population exhibited a unique fluorescence signature, confirming successful multiplex detection and clear differentiation of the measured cytokines and effector molecules.
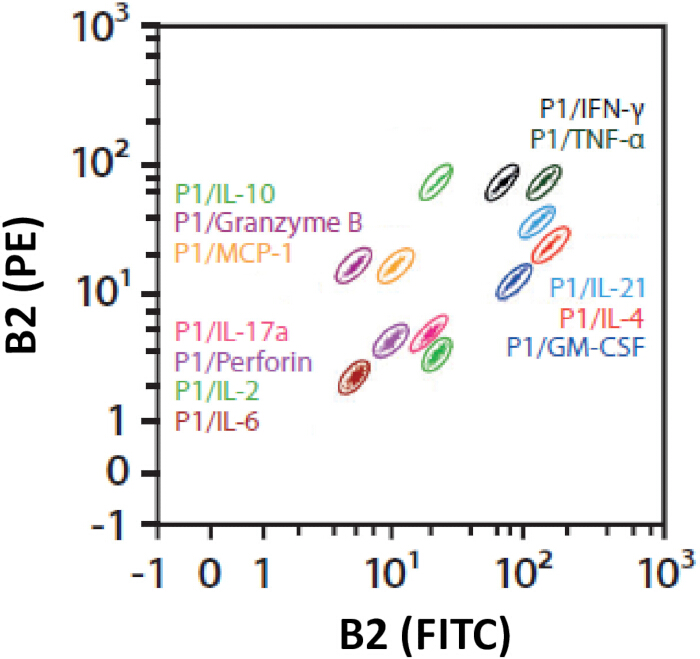
Figure 2: Detection of representative multiplex capture bead populations. Capture beads contain inherent fluorescence intensities that can be used to distinguish the different analyte-specific populations. The scatter plot displays the separation of analyte-specific signals based on fluorescence intensity in the FITC (B1) and PE (B2) channels. The image shows a representative profile of the 12 Capture bead populations encoding for GM-CSF, Granzyme B, IFN-γ, IL-2, IL-4, IL-6, IL-10, IL-17A, IL-21, MCP-1 (CCL2), Perforin, and TNF-α. Please click here to view a larger version of this figure.
Representative cytokine concentration profile of CAR T cells after co-culture with tumor cells
Following co-culture of CAR T cells with tumor target cells, cytokine concentrations were quantified using the human cytotoxicity panel of the multiplex assay (Figure 3). The CAR T cells secreted high levels of Granzyme B (49,950.2 pg/mL), IFN-γ (48,367.8 pg/mL), TNF-α (7,055.2 pg/mL), and GM-CSF (6,653.5 pg/mL), indicating potent activation and cytotoxic effector function in response to tumor engagement. IL-2 levels exceeded the upper detection limit (>10,000 pg/mL), consistent with strong proliferative signaling. The sample was not further diluted or re-measured. In contrast, cytokines associated with regulatory or alternative helper T cell responses, including IL-6, IL-10, IL-17A, IL-21, and MCP-1, were present at low or near-undetectable levels. These results suggest that the CAR T cells mounted a predominantly type 1 (Th1/cytotoxic) immune response characterized by high effector activity and limited immunosuppressive cytokine production.
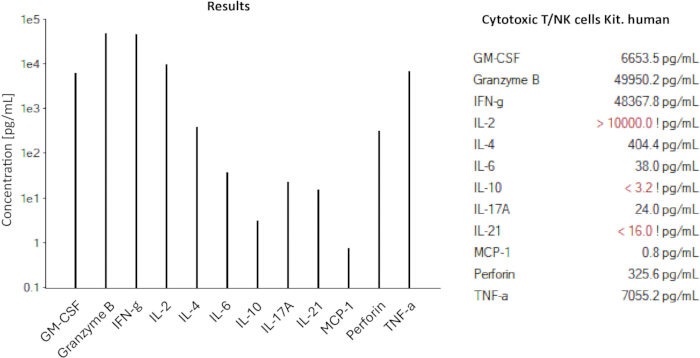
Figure 3: Representative cytokine profile of CAR T cells after co-culture with tumor cells. Engineered Chimeric Antigen Receptor (CAR) T cells were co-cultivated overnight with JeKo-1 tumor cells. Cell culture supernatants were harvested after 16 hours of incubation and centrifuged to remove particulates. Diluted samples were analyzed using the human cytotoxicity panel of the multiplex assay. Two standard curves were carried out and the concentrations of all 12 analytes were determined. A representative data output for the analysis and calculation of analyte-specific concentrations using the flow cytometer's Express Mode is shown. The bar graph and accompanying table show the calculated levels (picogram/milliliter) of the 12 effector molecules. Please click here to view a larger version of this figure.
Cytokine secretion kinetics of CAR T cells upon antigen-specific stimulation
Following co-culture of CAR T cells with target cells expressing (Antigen⁺) or lacking (Antigen⁻) the cognate antigen, cytokine secretion was monitored over time using the human cytotoxicity panel of the multiplex assay. CAR T cells exhibited rapid and robust cytokine release upon recognition of Antigen⁺ targets, with strong upregulation of Granzyme B, IFN-γ, TNF-α, GM-CSF, and IL-2 within 8–24 h, reaching peak levels by 48 h (Figure 4). This pattern indicates potent activation and cytotoxic effector function following antigen engagement. Moderate increases in IL-6, IL-17A, IL-21, and Perforin were also observed, whereas IL-4, IL-10, and MCP-1 remained low or modestly elevated. In contrast, co-cultures with Antigen⁻ targets showed minimal cytokine induction across all analytes (Figure 4). Together, these data demonstrate that CAR T cell activation and effector cytokine production occur specifically in response to antigen recognition and intensify over time.
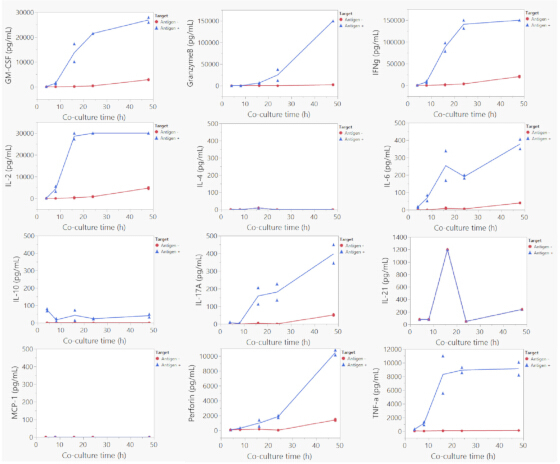
Figure 4: Effector molecule secretion kinetics of CAR T cells co-cultured with antigen-positive or antigen negative target cells. Engineered Chimeric Antigen Receptor (CAR) T cells were co-cultured with target cells either expressing (Antigen⁺) or lacking (Antigen⁻) the cognate CAR T cell antigen for 4, 8, 16, 24, and 48 h. At each time point, culture supernatants were collected and analyzed using the human cytotoxicity panel of the multiplex assay to quantify a broad panel of soluble effector analytes over time. Cytokine kinetics for 12 analytes are shown (picogram/milliliter). Please click here to view a larger version of this figure.
Discussion
The multiplex assay was used to profile soluble immune mediator responses in CAR T cell co-cultures. CAR T cells co-cultured with antigen-positive target cells showed increased secretion of IFN-γ, TNF-α, GM-CSF, Granzyme B, and IL-2, consistent with effector activation and cytotoxic function4,5,8. In contrast, antigen-negative controls exhibited low cytokine production, demonstrating the assay's ability to discriminate antigen-specific responses under the conditions tested5,8. These results support the applicability of the assay for assessing CAR T cell functionality, including use in potency-related analyses, safety-associated profiling, and mechanistic investigations.
While the fixed 12-analyte panel provides a broad overview of CAR T immune activity, it may not be practical to capture the complete range of analytes in all applications. For focused workflows such as assay validation or quality control (QC) testing of CAR T cell products, the panel can be downscaled to a reduced subset (e.g., IL-2, IFN-γ, and TNF-α) to streamline analysis while maintaining functional sensitivity1,2.
Critical steps in the protocol include the design of the CAR T cell co-culture and appropriate selection of sampling conditions. In particular, co-culture duration and effector cell number (E:T ratio) directly determine cytokine magnitude and should be defined during assay setup5,6. In addition, sample dilution should be adjusted to ensure analyte concentrations fall within the assay's dynamic range1,2. Troubleshooting should therefore focus on verifying standard curve performance and adjusting co-culture conditions or dilution factors if signals fall outside of the quantifiable range1,2.
Compared with traditional single-plex ELISAs, the flow cytometry-based multiplex platform generates high-density, multi-analyte datasets from minimal sample volumes. By enabling the simultaneous measurement of multiple analytes within a single sample, multiplexing can reduce overall reagent consumption, increase sample throughput, and shorten assay time relative to performing multiple single-plex assays1,2. Automated acquisition and standardized analysis options can potentially reduce user-dependent variability and support reproducibility and scalability across experimental or manufacturing settings5,8. Standard ELISA detection sensitivity typically ranges from 16 to 2000 pg/mL (can be lower for high-sensitivity kits)7. Within the platform presented in this study, the lowest detectable concentrations range from 0.05 pg/mL for the most sensitive analytes to approximately 93.8 pg/mL for those with inherently lower assay sensitivity. Across internal assessments, more than 74% of measured analytes displayed detection limits below 5 pg/mL, and 38% were detectable below 1 pg/mL, underscoring the overall sensitivity of the system. As multiplex sensitivity can vary by cytokine, potential epitope competition remains an important consideration. To minimize such interference, the assay employs non-overlapping epitopes for capture and detection of each analyte, thereby reducing competition-related bias and improving measurement reliability in multiplexed conditions.
Multiplex assay performance may vary across analytes depending on assay sensitivity and biological context, and under certain conditions, analyte concentrations may approach the upper limit of detection and should therefore be evaluated during assay setup. Conversely, some analytes (e.g., MCP-1 and IL-4 in this study) may remain undetectable depending on the experimental conditions. In addition, pre-analytical factors such as sample handling can influence cytokine measurements, and consistent processing conditions should be maintained to ensure comparability.
Overall, this multiplex approach enables efficient and quantitative characterization of CAR T cell functionality. Relative to most existing multiplex cytokine detection platforms, the assay is compatible with standard flow cytometers and includes an instrument-associated software tool that facilitates streamlined data acquisition and analysis. While multiplex cytokine detection has been used in other immune settings, the present work demonstrates its application to CAR T cell functional profiling within a standardized workflow. The bead-based format allows simultaneous detection of multiple analytes, supporting higher throughput compared with single-plex methods. Potential applications include functional assessment of the drug product, such as CAR binder evaluation, vector optimization, and process development. The assay's scalability and automated analysis capabilities also support potency testing, safety profiling, and mechanistic studies aimed at understanding CAR T cell behavior and functionality5,7,8.
While cytokine secretion profiles provide valuable insights into CAR T cell activation and functional potency in vitro, they cannot fully replicate the complex biology that determines therapeutic efficacy in patients. Factors such as the tumor microenvironment, antigen density, immune regulation, and in vivo persistence all influence CAR T cell performance beyond what can be measured in controlled assays6,8,10. Nevertheless, establishing robust and standardized functional assays such as multiplex cytokine profiling represents an important step toward the functional characterization of the drug product3,4. Cytokine patterns are not only indicative of CAR T cell activity but also closely associated with toxicity phenomena, including cytokine release syndrome (CRS) and immune effector cell-associated neurotoxicity syndrome (ICANS)3,6,7. Currently, variability in measurement methods and reporting limits cross-trial comparability, highlighting the need for standardized, reproducible immune mediator profiling1,2,3. As analytical technologies and clinical datasets continue to advance, the ultimate goal is to define predictive secretion signatures that reliably reflect both therapeutic potential and patient safety, bridging the gap between preclinical potency assays and clinical efficacy.
Disclosures
M.L. and M.H. are listed as inventors on patent application WO2021/058811A1. M.H. is listed as an inventor on patent applications and granted patents related to CAR T technologies that have been filed by the Fred Hutchinson Cancer Research Center, Seattle, WA, and by the University of Würzburg, Würzburg, Germany. M.H. is a co-founder and equity owner of T-CURX GmbH, Würzburg, Germany. M.H. received honoraria from Celgene/BMS, Janssen, Kite/Gilead. J.J, A.R., and C.E. are employees of Miltenyi Biotec.
Acknowledgements
This research was funded by the Innovative Medicines Initiative 2 Joint Undertaking under grant agreement number 945393, T2EVOLVE. This Joint Undertaking receives support from the European Union's Horizon 2020 Research and Innovation Program, the European Federation of Pharmaceutical Industries and Associations (EFPIA) and the European Hematology Association (EHA) (to M.H., C.Q., M.L.), ERA-NET TRANSCAN-3 (EC co-funded call 2021, SmartCAR-T to M.H. and M.L.), Wilhelm-Sander-Stiftung (grant no. 2022.134.1 to M.L.), the Paula & Rodger Riney Foundation (to M.H. and M.L.), IZKF Würzburg (S-511, C-543 to M.L.), the German Research Foundation (Deutsche Forschungsgemeinschaft, DFG, TRR 221 (subproject A03 and A06 to M.H. and M.L.); SFB-TRR 338/3 2026–452881907 (subprojects A02 M.H. and C04 M.L.) and CRC1525 (seed grant to M.L.), the Bavarian Cancer Research Center (BZKF; TANGO to M.H. and M.L.), INCA Award by Novartis (to M.L.)
Materials
| Name | Company | Catalog Number | Comments |
|---|---|---|---|
| MACSPlex Cytotoxic T/NK Cell Kit, human | Miltenyi Biotec | 130-125-800 | Bead-based multiplex cytokine assay for flow cytometry |
| MACSPlex InspectoR Tool | Miltenyi Biotec | \ | Web-based tool for automated gating and analysis of MACSPlex data |
| MACSQuant Analyzer 10 Flow Cytometer | Miltenyi Biotec | 130-096-343 | Flow cytometry instrument of multiplex data measurement |
| MACSQuant Analyzer 16 Flow Cytometer | Miltenyi Biotec | 130-109-803 | Flow cytometry instrument of multiplex data measurement |
| MACSQuant Express Mode | Miltenyi Biotec | \ | Software for automated gating and analysis |
| TexMACS Medium | Miltenyi Biotec | 130-097-196 | Optimized serum-free cell culture medium developed for the cultivation and expansion of human and mouse T cells |
References
- Biery, D. N., Turicek, D. P., Diorio, C., Schroeder, B. A., Shah, N. N. Need for standardization of cytokine profiling in CAR T cell therapy. Mol Ther. 32 (9), 2979-2983 (2024).
- Boulch, M., et al. A cross-talk between CAR T cell subsets and the tumor microenvironment is essential for sustained cytotoxic activity. Sci Immunol. 6 (57), eabd4344(2021).
- Teachey, D. T., et al. Identification of predictive biomarkers for cytokine release syndrome after chimeric antigen receptor T-cell therapy for acute lymphoblastic leukemia. Cancer Discov. 6 (6), 664-679 (2016).
- Liu, C., et al. Cytokines: From clinical significance to quantification. Adv Sci. 8 (15), 2004433(2021).
- Leng, S. X., et al. ELISA and multiplex technologies for cytokine measurement in inflammation and aging research. J Gerontol A Biol Sci Med Sci. 63 (8), 879-884 (2008).
- Tighe, P. J., Ryder, R. R., Todd, I., Fairclough, L. C. ELISA in the multiplex era: Potentials and pitfalls. Proteomics Clin Appl. 9 (3–4), 406-422 (2015).
- Wang, X., et al. Artificial targets: a versatile cell‑free platform to characterize CAR T cell function in vitro. Front Immunol. 15, 1254162(2024).
- Ren, Y., et al. An in vitro co‑culture model with CAR‑T cells, antigen‑presenting cells, and tumor cells to evaluate CAR‑T cell‑induced cytokine release syndrome. Front Cell Infect Microbiol. 16, 1721114(2026).
- Lock, D., et al. Automated, scaled, transposon-based production of CAR T cells. J Immunother Cancer. 10 (9), e005189(2022).
- Bethke, M., et al. Identification and characterization of fully human FOLR1-targeting CAR T cells for the treatment of ovarian cancer. Cells. 13 (22), 1880(2024).
Reprints and Permissions
This article has been published
Video Coming Soon