This chairside protocol delivers a biodegradable 14% doxycycline gel adjunctive to scaling and root planing for stage III/IV periodontitis, detailing screening, randomization, standardized instrumentation, gel placement with quality checks, follow-ups at 1, 3, and 6 months, and site-specific microbiological sampling with representative clinical and microbial outcomes.
Method Article
Effect of Local 14% Doxycycline Gel as an Adjunct to Scaling and Root Planing for Chronic Periodontitis: A Chairside Protocol with Representative Results
In This Article
Summary
Abstract
Adjunctive antimicrobials can enhance non-surgical periodontal therapy by suppressing residual pathogens within deep periodontal pockets. This article presents a reproducible, chairside protocol for delivering a biodegradable 14% doxycycline gel as an adjunct to scaling and root planing (SRP) in adults with stage III or IV periodontitis. The workflow includes participant screening and informed consent, randomization to three arms (SRP plus doxycycline gel; SRP plus placebo gel; SRP alone), allocation concealment, standardized full-mouth debridement, and blinded gel delivery using a blunt cannula with a base-to-margin filling approach. Postoperative instructions and scheduled follow-ups at 1, 3, and 6 months are described to support consistency across operators and visits. Clinical outcomes include probing pocket depth (PPD), clinical attachment level (CAL), gingival index (GI), and bleeding on probing (BOP). Site-specific microbiological sampling targets red-complex organisms (Porphyromonas gingivalis, Tannerella forsythia, and Treponema denticola) using sterile paper points followed by quantitative laboratory analysis with pre-defined quality controls. Examiner calibration, instrument sterility checks, and protocol stopping points are specified to strengthen fidelity and safety. Representative results show that adjunctive doxycycline gel is most likely to yield incremental benefit at deeper residual sites, with between-group differences at full-mouth averages expected to be smaller, consistent with prior evidence on locally delivered antimicrobials after meticulous SRP11–13. This protocol is designed to be video-capturable and readily implemented in clinical research and advanced periodontal training.
Introduction
Chronic periodontitis is a common, progressive inflammatory condition of the supporting tissues of the teeth, characterized by periodontal pocketing, bleeding on probing, and alveolar bone loss, and without effective control may culminate in tooth mobility or loss1. Despite advances in prevention and care, the global burden remains substantial: recent epidemiological syntheses indicate persistently high prevalence in adults, with severe disease representing a meaningful proportion of cases2,3. The overall goal of this protocol is to provide a standardized, chairside workflow for adjunctive local antimicrobial delivery following meticulous SRP, enabling reproducible implementation and consistent outcome assessment in routine clinical practice and clinical research.
SRP is the foundation of non-surgical periodontal therapy4. By disrupting subgingival biofilms and removing calculus, SRP reduces microbial load and inflammatory activity and enables soft-tissue recovery5˒6. However, SRP alone may be insufficient at deep or morphologically complex sites, where residual biofilm, anatomical irregularities, and rapid recolonization contribute to variable clinical response and persistent or recurrent pockets7. Contemporary staging frameworks further indicate that stage III/IV presentations often combine advanced attachment loss with complexity factors that increase the likelihood of residual deep sites following initial therapy8.
Local drug delivery systems have therefore been adopted as adjuncts aimed at managing residual, site-specific deep pockets after meticulous instrumentation, with the practical goal of improving local outcomes while avoiding the exposure and stewardship concerns associated with systemic antibiotics9. In routine clinical use, these adjuncts are generally positioned for localized deep sites that are less predictable with SRP alone (e.g., anatomically complex sites or pockets that remain ≥ 6 mm after debridement), rather than as a blanket full-mouth approach10.
Locally delivered doxycycline gel exemplifies such an adjunct11. Doxycycline combines antimicrobial activity against key periodontal pathogens with inhibitory effects on matrix metalloproteinases implicated in connective-tissue breakdown. When deposited to the pocket base via a blunt cannula after meticulous SRP, controlled-release formulations can maintain high local availability with limited systemic exposure12. Importantly, existing clinical and microbiological evidence has repeatedly suggested that incremental benefits of locally delivered antimicrobials are most consistently detected at deeper sites, whereas full-mouth mean differences may be modest when SRP is performed rigorously13. These observations have shaped common usage protocols in which site selection, timing relative to instrumentation, and operator technique are treated as determinants of effectiveness rather than minor procedural details14.
Compared with other adjunctive local antimicrobials or alternative approaches, doxycycline gel placement offers a practical, site-targeted strategy that can be integrated into standard SRP workflows without altering the mechanical debridement endpoint. While different local delivery formats and non-antibiotic adjuncts have been used in periodontal care, protocols vary substantially in application technique, quality control, and follow-up evaluation; consequently, differences in retention, patient tolerance, and reproducibility can influence interpretability across settings. A key advantage of the present approach is that it pairs standardized SRP with a clearly specified gel-placement technique and predefined quality checks, supporting consistent chairside execution and comparable outcome readouts across operators and clinics. Despite extensive literature on doxycycline gel as an adjunct to SRP, a standardized protocol remains necessary because key procedural elements are not applied or reported consistently across studies and clinics. Variations in site selection, timing relative to instrumentation, isolation and moisture control, cannula positioning, fill strategy, and post-placement instructions can affect gel retention and local exposure, contributing to heterogeneous outcomes and limiting cross-study comparability. This protocol standardizes these technique-critical steps, embeds predefined quality-control checkpoints, and aligns follow-up assessments with clinically meaningful reassessment windows to improve reproducibility for both chairside use and research reporting.
Clinical performance remains technique-sensitive: field isolation, cannula positioning, a base-to-margin filling strategy, and early post-placement care influence gel retention, patient comfort, and outcomes15. In addition, because probing of moderate-to-severe sites shortly after instrumentation may be influenced by early healing dynamics, protocols differ in whether short-term (e.g., 4-week) probing-based endpoints are emphasized or deferred to later timepoints; this consideration is particularly relevant when readers translate a trial design into chairside decision-making16.
This protocol is most appropriate for adult patients receiving non-surgical periodontal therapy in outpatient dental or periodontal clinics where SRP can be performed to a standardized endpoint and follow-up visits can be completed at prespecified timepoints. It is particularly suited to patients with stage III/IV chronic periodontitis who present with localized deep or anatomically challenging sites for which SRP alone may be less predictable, and where site-level monitoring (clinical indices and microbiological sampling) is feasible.
This article presents a reproducible, video-ready protocol for chairside delivery of a 14% doxycycline gel as an adjunct to SRP in adults with stage III/IV chronic periodontitis. The method covers screening and consent, randomization and blinding, standardized SRP, gel placement with pre-defined quality controls, and follow-up assessments at 1, 3, and 6 months, including site-specific microbiological sampling targeting red-complex organisms. Representative results illustrate expected ranges of probing-depth reduction, clinical-attachment gain, and microbial suppression when the protocol is executed with fidelity, while maintaining a conservative interpretation that emphasizes applicability at deeper residual sites rather than uniform full-mouth effects17.
Protocol
Ethics statement
Ensure the study complies with institutional human research guidelines and obtain Ethics Committee approval before any recruitment. Obtain written informed consent from each participant covering participation, de-identified data use, and video recording before any study-specific procedure.
1. Ethics approval, oversight, and registration
- Ethics approval, registration, and documentation
- Obtain Institutional Review Board approval and register the trial before enrollment, then archive approval letters, the protocol version, and registry entries in the site file.
- Obtain written informed consent prior to any screening measurements beyond routine care and retain version-controlled consent forms with date-stamped signatures.
- Maintain an auditable record of consent, eligibility, adverse events/serious adverse events (AE/SAE), protocol deviations, and corrective actions using version control and date-stamped entries.
- Examiner/operator training and calibration
- Train and calibrate examiners/operators before the first enrollment. Achieve intra- and inter-examiner reliability targets of ICC ≥ 0.90 for PPD and ICC ≥ 0.80 for CAL, and document calibration sessions, reference cases, probing-force verification, and ICC calculations in the calibration log.
- Standardize probing force (e.g., 20–25 g) using a force gauge or a scale-based practice method until the examiner can repeatedly reproduce the target force range, then recheck force at pre-defined intervals during the study.
- Whenever feasible, assign the same calibrated examiner to measure the same participant from baseline through 6 months to minimize measurement variability. If examiner changes are unavoidable, document the reason and complete re-calibration before measurements resume.
2. Study design and timeline
- Conduct a 6-month, randomized, double-blind, placebo-controlled clinical trial evaluating 14% doxycycline gel as an adjunct to SRP in adults with stage III/IV chronic periodontitis.
- Schedule visits at baseline, 1, 3, and 6 months, and follow the visit sequence shown in Figure 1 (Treatment Timeline).
- After baseline supragingival prophylaxis and baseline assessments, confirm eligibility and allocation before any gel placement, and ensure that the operator performing gel delivery is not involved in outcome measurements.
3. Sample size and randomization
- Perform an a priori sample size calculation for the co-primary endpoints (PPD and CAL). Specify assumed mean differences, standard deviation, α level, statistical power, and an attrition allowance of approximately 10%, and archive the calculator output in the study binder.
- Generate a computer-based randomization list with 1:1:1 allocation to Group A (SRP + 14% doxycycline gel), Group B (SRP + placebo gel), and Group C (SRP only). Use block randomization to maintain balance across the recruitment period.
CAUTION: Restrict access to the randomization sequence. Store the allocation list with the independent custodian only, and do not disclose group assignment to outcome assessors to preserve blinding. - Implement allocation concealment using sequentially numbered, opaque, sealed envelopes prepared by independent personnel. Open the next envelope only after eligibility is confirmed and baseline sampling is completed.
- Blind the participants and outcome examiners. Maintain operator blinding to gel identity by using identical syringes and generic labels (“A” vs “B”) with matched appearance and viscosity. Ensure that the randomization code is accessible only to the independent custodian until the database lock, except in medical emergencies.
4. Eligibility screening
- Screen adults aged 18–70 years with stage III/IV chronic periodontitis and the ability to attend all scheduled visits. Require at least two qualifying periodontal sites meeting the site-level criterion for adjunctive therapy, and define qualifying sites prospectively as pockets with baseline PPD ≥ 6 mm after supragingival plaque removal.
- Record the number and tooth-site codes of qualifying sites at baseline and pre-define a site-selection rule for gel placement and microbiological sampling as described in Sections 7 and 8.
- Treat qualifying sites as the unit of adjunctive therapy and restrict gel placement to qualifying sites rather than full-mouth delivery, aligning the intervention with the clinical scenario in which local controlled-release agents are typically considered for residual deep pockets.
- Exclude participants with pregnancy/lactation, allergy to tetracyclines or formulation excipients, uncontrolled systemic disease that contraindicates periodontal therapy, systemic antibiotics or periodontal therapy within 3 months, or conditions likely to compromise adherence or safety.
CAUTION: Verify tetracycline allergy history before enrollment. If allergy is suspected or confirmed, do not proceed with gel allocation and document screen failure per the protocol. - Record demographics, smoking status, and medical history using the screening form, and document concomitant medications that may affect periodontal healing.
- Use Table 1 (eligibility criteria) as the screening checklist, and archive signed screening logs.
5. Baseline preparation
- Provide standardized oral-hygiene instruction (OHI).
- Demonstrate toothbrushing using a modified Bass technique for at least 2 minutes. Instruct daily interdental cleaning appropriate to embrasure size, and reinforce plaque disclosure where feasible to confirm patient understanding.
- Record OHI delivery and the recommended home-care tools in the case report form.
- Perform supragingival scaling and plaque control before baseline measurements and sampling.
- Remove visible supragingival plaque first using gauze wiping and water spray, then remove supragingival calculus using ultrasonic instrumentation under continuous water coolant with light lateral pressure and sweeping strokes that keep the tip moving to avoid heat generation.
- Complete residual supragingival calculus removal using hand scalers with short, controlled strokes, then polish plaque-retentive areas with a prophylaxis cup and low-abrasive paste as needed.
- Reinspect the gingival margins of intended sampling and measurement teeth, and repeat brief supragingival debridement until visible supragingival deposits are removed.
- Complete full-mouth charting (Section 10) and collect baseline microbiology (Section 8) at pre-specified sites before any subgingival irrigation that could disrupt sampling.
- Provide identical post-visit home-care instructions across groups to preserve internal validity, and document patient receipt and understanding of the instructions.
6. Standardized SRP (all groups)
- Provide local anesthesia as required. Perform topical mucosal anesthesia for 1 min when needed, then administer local infiltration and/or nerve block according to the quadrant.
CAUTION: Aspirate before injection and inject slowly to reduce the risk of intravascular administration. Monitor participants for immediate adverse reactions. - Aspirate before injection and deliver slowly. Record anesthetic class (e.g., amide local anesthetic), vasoconstrictor presence/absence, total volume (mL), injection sites, and any immediate reactions.
- Confirm adequate anesthesia using gentle air stimulus or probing, prior to instrumentation.
- Perform full-mouth debridement using a standardized sequence and operator endpoints.
- Begin with supragingival ultrasonic debridement of the entire quadrant, then perform subgingival SRP tooth-by-tooth using area-specific curettes.
- Use exploratory strokes to detect calculus, then apply overlapping working strokes with appropriate angulation and moderate lateral pressure to remove deposits and plane the root.
- Maintain adaptation by keeping the terminal shank parallel to the tooth surface for each site and reposition frequently to follow root morphology. Continue instrumentation until the root surface feels smooth and hard on tactile evaluation, and an explorer pass detects no residual or burnished calculus.
- Document the treated quadrants, chair time, and whether SRP is completed in a single session or split sessions according to patient tolerance.
- Irrigate the treated pockets with sterile saline using a blunt irrigation tip, then gently dry only the gingival margin with oil-free air to facilitate subsequent gel retention.
NOTE: Avoid aggressive air-drying that could traumatize tissues or provoke bleeding, which may interfere with gel placement. - Complete SRP before any gel placement. Apply gel in the same treatment visit immediately after completing SRP for the participant and after irrigation/drying (Step 6.9), unless the protocol prespecifies a separate appointment; document the timing between SRP completion and gel placement.
- Do not re-instrument gel-treated sites within 7 days to avoid displacing the gel, and record any inadvertent probing or re-instrumentation as a protocol deviation.
- Pause point: After completion of SRP (and gel placement for Groups A/B in Section 7), participants may be dismissed and scheduled for follow-up visits at 1, 3, and 6 months. Before closing the visit, verify baseline documentation, tooth-site codes, randomization records (if applicable), and SRP/gel-placement logs.
7. Chairside gel placement for Group A or B
- Isolate the tooth with cotton rolls and high-volume evacuation to maintain a relatively dry field.
- Remove visible saliva pooling and attempt to minimize blood contamination at the gingival margin; if bleeding obscures the margin, apply gentle gauze pressure for 30–60 seconds and reassess.
- Identify the pre-specified qualifying sites for gel application and document tooth-site codes before opening the gel syringe.
- Apply gel only to qualifying sites rather than to all sites. Use a consistent site rule across participants by selecting four index sites per participant where feasible, prioritizing interproximal sites with baseline PPD ≥ 6 mm and BOP positivity, distributed across quadrants when possible.
NOTE: If more than four sites qualify, select the four deepest qualifying sites; if ties occur, prioritize sites with BOP positivity and interproximal location. If fewer than four sites qualify, treat all qualifying sites and document the reason for reduced site count. - Use the same index sites as the primary microbiological sampling sites for Groups A and B (Section 8).
- Insert a blunt cannula to the pocket base.
- Advance gently along the root surface until resistance indicates the apical extent of the pocket, then express gel while slowly withdrawing the cannula so the pocket fills from base to margin. Stop when a slight meniscus is visible at the gingival margin.
- Use a typical volume of approximately 0.1–0.2 mL per site, but prioritize complete pocket filling without over-extrusion. Record the number of treated sites and the total gel volume used.
- Stabilize the gel at the margin by lightly shaping the meniscus with a microbrush or gloved finger, avoiding excessive manipulation that may remove material from the pocket entrance. Confirm that gel remains visible at the margin immediately after placement as a placement quality check. Record any immediate loss.
- Maintain the same video sequence for documentation across participants as shown in Figure 2 (Chairside gel application steps), and capture critical visual checkpoints, including cannula insertion depth, withdrawal-filling motion, and final meniscus appearance.
- Instruct participants not to probe treated sites for 7 days after placement, and log any early probing events or gel loss reports in the deviation log.
8. Microbiological sampling
- Define sampling sites prospectively and keep them consistent across visits. Use treated index sites as the primary sampling sites for Groups A and B. For Group C, select matched reference sites using the same tooth type and baseline PPD stratum (≥ 6 mm) where feasible, and document the matching rule.
- Specify whether “reference sites (n = 4)” denotes microbiological sampling sites, clinical measurement sites, or both, and apply the same definition consistently across the manuscript and figures.
- Maintain the same tooth-site codes at baseline, 1, 3, and 6 months unless tooth loss or unavoidable clinical changes occur; if a replacement is required, apply a prewritten replacement rule and document the reason.
- At each visit (baseline, 1, 3, and 6 months), isolate the site, remove supragingival plaque with a sterile curette without entering the pocket, and gently air-dry. Avoid subgingival irrigation, subgingival probing, or air-water syringe entry into the pocket before sampling.
- Insert sterile paper points (#30) to the pocket base and keep them in place for 10 seconds. Pool 2–3 points per site into anaerobic transport medium, and label tubes with participant ID, tooth-site code, visit time point, and timestamp.
- Extract DNA using a validated bacterial DNA extraction procedure and run one extraction blank per batch. Maintain a unidirectional workflow by physically separating pre-PCR reagent preparation, DNA handling, and amplification areas to prevent contamination.
CAUTION: Treat clinical plaque samples as potentially biohazardous. Wear appropriate personal protective equipment, use aerosol-resistant tips, and disinfect work surfaces before and after processing. To minimize amplicon carryover, keep pre-PCR and post-PCR areas strictly separated and open tubes only within designated clean areas. - Perform real-time PCR using a SYBR-based chemistry to quantify Porphyromonas gingivalis (P. gingivalis), Tannerella forsythia (T. forsythia), and Treponema denticola (T. denticola) with the primer pairs (5’ → 3’) listed below. Run reactions on a real-time PCR system (see Table of Materials for manufacturer and model).
NOTE: P. gingivalis forward GCGAGAGCCTGAACCAGCCA and reverse ACTCGTATCGCCCGTTATTCCCGTA; T. forsythia forward CGATGATACGCGAGGAACCTTACCC and reverse CCGAAGGGAAGAAAGCTCTCACTCT; T. denticola forward TAAGGGACAGCTTGCTCACCCCTA and reverse CACCCACGCGTTACTCACCAGTC. - Prepare 20 µL reactions containing 10 µL of 2 × qPCR master mix (SYBR-based chemistry), 0.4 µM of each primer, and 2 µL of template DNA, then bring to volume with nuclease-free water. Run reactions in duplicate for each target per sample and include no-template controls for each primer set.
- Use thermocycling conditions suitable for SYBR-based chemistry: initial denaturation at 95 °C for 10 min, followed by 40 cycles of 95 °C for 15 s and 60 °C for 60 s.
- Perform a melt-curve analysis (e.g., 65–95 °C with 0.5 °C increments) to confirm single, specific amplification.
- Use a plasmid or synthetic DNA standard curve spanning 102–108 copies per reaction, and accept runs only if R2 ≥ 0.99 and amplification efficiency is 90%–110%.
- Repeat runs outside these bounds and repeat any duplicate pairs with Ct standard deviation > 0.35. Report results as log10 copies per site.
- Limit the time from sampling to freezing to ≤ 2 h. Store samples and extracts at -80 °C, and record handling times, transport conditions, and freezer logs.
PAUSE POINT: After samples (and/or extracted DNA) are stored at -80 °C, downstream laboratory processing (DNA extraction and real-time PCR) may be performed in batches at a later time, provided that sample labeling, chain-of-custody documentation, and freezer logs are verified.
9. Post-placement instructions
- Instruct participants to avoid flossing or using interdental aids at treated sites for 7 days, while brushing gently with a soft toothbrush.
- Recommend a soft diet for 24–48 h and avoidance of hard or chewy foods on treated sites to minimize mechanical displacement.
- Provide analgesics per clinical protocol if needed and instruct participants to report pain, swelling, rash, stomatitis, or photosensitivity promptly. Document all symptom reports and management.
10. Clinical measurements
- Measure PPD using a periodontal probe at six sites per tooth (mesiobuccal, buccal, distobuccal, mesiolingual, lingual, distolingual).
- Apply a standardized probing force of 20–25 g verified during calibration by repeatedly pressing the probe tip on a balance until the target force is reproducible.
- Insert the probe parallel to the long axis and keep the tip in contact with the tooth surface, then “walk” the probe in 1 mm steps around each site to identify the deepest reading; record the deepest millimeter value at each of the six sites.
- Measure CAL at the same six sites by recording the distance from the cementoenamel junction to the probe tip. When the cementoenamel junction is obscured, locate it by tactile detection and record any restorative margin that could affect the landmark; apply the same landmark rule consistently across visits.
- Score GI on a 0–3 scale using a pre-specified scoring guide, and record BOP as bleeding occurring within 15 seconds after probing at each site. Use the same probing sequence at each visit to standardize timing for BOP observation.
- Use calibrated examiners masked to allocation. Repeat duplicate measurements on a 10% subset at each visit to monitor drift and retrain when reliability drops below targets (PPD ICC ≥ 0.90; CAL ICC ≥ 0.80). Summarize baseline demographics and full-mouth clinical outcomes (PPD, CAL, GI, and BOP) across study visits in Table 2.
- At the 1-month follow-up, minimize potential interference with tissue healing by avoiding probing-based assessments and limiting procedures to pre-specified outcomes. At this visit, collect microbiological samples at the pre-defined sites (Section 8), document adverse events and adherence, and reinforce OHI.
NOTE: Do not collect PPD, CAL, GI, or BOP at 1 month; reserve full-mouth clinical measurements for the 3 and 6-month visits to reduce the risk that early manipulation influences healing in moderate-to-severe sites. Apply the same 1-month assessment rule to all participants and document any deviation.
11. Follow-up schedule and assessments
- Reassess at 3 and 6 months for PPD, CAL, GI, and BOP. Repeat microbiology at baseline, 1, 3, and 6 months per Section 8 using the same site codes.
- Reinforce OHI at each visit, record adherence using self-report and visible plaque assessment, and document AEs/SAEs systematically.
- Manage gel displacement or significant discomfort using pre-defined criteria. Record the event timing, clinical management, and outcome, and classify the event as an AE when appropriate.
- Summarize visit windows in Table 3 and display the consolidated timeline in Figure 1.
12. Data management and masking
- Use pre-printed case report forms with double data entry and discrepancy adjudication, and maintain a change log with date-stamped edits and reason codes.
- Mask analysts to group labels where feasible using anonymized codes, and maintain deviation logs for missed visits, early probing, gel loss, and protocol departures.
- Store de-identified data in a read-only repository with file checksums, and retain records of instrument and software versions used for analysis and laboratory processing.
13. Statistical analysis
- Perform statistical analyses using statistical software (see Table of Materials for manufacturer and version). Assess normality using the Shapiro–Wilk test and inspect distributional plots.
- Evaluate within-group longitudinal changes using repeated-measures ANOVA for normally distributed data; otherwise use the Friedman test. Apply Bonferroni-adjusted post hoc comparisons where applicable.
- Compare groups at each time point using independent-samples t-tests/one-way ANOVA for normal data; otherwise use the Mann–Whitney U test/Kruskal–Wallis test. Use chi-square tests for categorical variables.
- Analyze primary endpoints (PPD and CAL) at each post-baseline visit using ANCOVA with baseline values as covariates. Report adjusted mean differences with 95% confidence intervals and two-sided p values.
- Handle missing data using a pre-specified approach (e.g., last observation carried forward) and conduct sensitivity analyses where feasible. Predefine the analysis population (per-protocol vs modified intention-to-treat) and apply it consistently across outcomes.
14. Safety monitoring
- Define and actively monitor AEs/SAEs including photosensitivity, allergic reactions, and stomatitis. Grade severity, record causality, and document actions taken such as discontinuation or rescue care.
- Apply pre-defined early withdrawal criteria, such as severe allergy or the need for systemic antibiotics, and document follow-up procedures for withdrawn participants.
- Report SAEs to the IRB according to institutional timelines and maintain reporting documentation in the safety binder.
15. Quality assurance and fidelity
- Use a site-readiness checklist before enrolling each cohort, confirming materials availability, labeling integrity, transport media preparation, balance availability for force calibration, and sterilization logs.
- Conduct monthly inter-rater checks on a convenience subset representing at least 10% of participants to detect drift in probing, and retrain examiners if ICC falls below target thresholds.
- Run laboratory external controls for each qPCR batch and apply pre-defined acceptance criteria including R2, amplification efficiency, and duplicate Ct standard deviation thresholds.
- Perform a blinding-integrity check after database lock by asking examiners to guess allocation and reporting accuracy, and retain the blinding report with the final audit trail.
Results
Participant disposition (CONSORT)
Participant flow followed the pre-specified randomized three-arm design and is summarized in Figure 3 (CONSORT flow diagram). Among 151 screened individuals, 97 eligible participants were randomized in a 1:1:1 ratio to Group A (SRP + 14% doxycycline gel), Group B (SRP + placebo gel), and Group C (SRP only). Follow-up visits were scheduled at 1, 3, and 6 months. The final analysis sets comprised n = 31 (Group A), n = 34 (Group B), and n = 32 (Group C). Losses to follow-up were primarily due to contact failure and protocol-based exclusions (e.g., withdrawal of consent or intercurrent illness). Analyses were conducted according to the pre-specified analysis populations, and missing observations were handled as defined in the protocol.
Clinical outcomes (PPD, CAL, GI, BOP)
Trajectories for the co-primary endpoints are shown in Figure 4 (PPD over time) and Figure 5 (CAL over time), with inflammation-related indices shown in Figure 6 (GI and BOP). Full-mouth descriptive values for each time point are summarized in Table 2. Across all arms, within-group improvements were observed from baseline through months 3 and 6.
In the dataset corresponding to Table 2, mean PPD (mm) decreased from 5.28 ± 0.45 (Group A), 5.12 ± 0.42 (Group B), and 5.36 ± 0.48 (Group C) at baseline to 4.22 ± 0.55, 4.31 ± 0.52, and 4.23 ± 0.51 at month 3, and to 3.91 ± 0.48, 3.87 ± 0.46, and 3.90 ± 0.49 at month 6, respectively. CAL (mm) showed parallel gains, changing from 5.93 ± 0.64 (Group A), 5.77 ± 0.59 (Group B), and 6.02 ± 0.67 (Group C) at baseline to 5.02 ± 0.52, 5.08 ± 0.53, and 5.01 ± 0.50 at month 3, and to 4.77 ± 0.51, 4.81 ± 0.50, and 4.72 ± 0.54 at month 6. Gingival inflammation also improved over time. Mean GI decreased from 1.92 ± 0.45 (Group A), 1.87 ± 0.42 (Group B), and 1.98 ± 0.47 (Group C) at baseline to 1.52 ± 0.43, 1.56 ± 0.44, and 1.50 ± 0.42 at month 3, and to 1.35 ± 0.39, 1.40 ± 0.40, and 1.30 ± 0.38 at month 6. BOP positivity similarly declined from 22/31 (70.97%), 19/34 (55.88%), and 21/32 (65.63%) at baseline to 9/31 (29.03%), 8/34 (23.53%), and 7/32 (21.88%) at month 3, and to 5/31 (16.13%), 6/34 (17.65%), and 4/32 (12.50%) at month 6 (Table 2).
Between-group comparisons for the co-primary endpoints (PPD and CAL) at months 3 and 6 were evaluated using baseline-adjusted models and are reported as adjusted mean differences (AMD), 95% confidence intervals (CI), and p values. For PPD at month 3, AMD(A–B) = −0.10 mm (95% CI −0.24 to 0.04; p = 0.164; Cohen’s d = 0.22) and AMD(A–C) = −0.05 mm (95% CI −0.19 to 0.09; p = 0.476; d = 0.11). For PPD at month 6, AMD(A–B) = 0.03 mm (95% CI −0.10 to 0.16; p = 0.656; d = 0.06) and AMD(A–C) = 0.01 mm (95% CI −0.12 to 0.14; p = 0.884; d = 0.02). For CAL at month 3, AMD(A–B) = −0.08 mm (95% CI −0.24 to 0.08; p = 0.324; d = 0.16) and AMD(A–C) = 0.02 mm (95% CI −0.14 to 0.18; p = 0.806; d = 0.04). For CAL at month 6, AMD(A–B) = −0.05 mm (95% CI −0.20 to 0.10; p = 0.512; d = 0.10) and AMD(A–C) = 0.06 mm (95% CI −0.10 to 0.22; p = 0.462; d = 0.12).
Because probing-based endpoints can be sensitive to early healing dynamics, the protocol did not collect full-mouth PPD, CAL, GI, or BOP at the 1-month visit. The 1-month visit was reserved for microbiological sampling and standardized monitoring of safety and adherence (adverse events, protocol deviations, and home-care reinforcement) according to the pre-specified visit schedule. Accordingly, between-group statistical comparisons for full-mouth clinical outcomes are reported for the 3- and 6-month follow-up time points.
Pre-specified deep-site contrasts (treated index sites vs matched reference sites)
Pre-specified contrasts focusing on deep qualifying sites (baseline PPD ≥ 6−7 mm; corresponding to treated index sites in Groups A and B and matched reference sites in Group C) were analyzed separately. At month 3, the baseline-adjusted deep-site PPD reduction was greater in Group A than Group B: AMD(A−B) = -0.32 mm (95% CI -0.58 to -0.06; p = 0.016; d = 0.52); the contrast versus Group C was smaller: AMD(A−C) = -0.21 mm (95% CI -0.49 to 0.07; p = 0.140; d = 0.34). At month 6, a similar pattern was observed for deep-site PPD: AMD(A−B) = -0.28 mm (95% CI -0.55 to -0.01; p = 0.042; d = 0.45). Deep-site CAL showed a concordant direction at month 6: AMD(A − B) = -0.25 mm (95% CI -0.48 to -0.02; p = 0.034; d = 0.41).
Microbiological outcomes (qPCR)
Red-complex targets (P. gingivalis, T. forsythia, and T. denticola) were quantified by qPCR at baseline and at 1, 3, and 6 months (Figure 7). Bacterial loads are reported as log10 copies per site. From baseline to month 6, median reductions (Δlog10 copies per site, median [IQR]) were: P. gingivalis 1.35 [0.90–1.80] in Group A, 0.92 [0.55–1.30] in Group B, and 0.88 [0.50–1.25] in Group C (Kruskal–Wallis p = 0.012; Dunn–Holm pairwise: A vs B p = 0.018, A vs C p = 0.026, B vs C p = 0.742). For T. forsythia, reductions were 1.20 [0.80–1.65], 0.81 [0.45–1.20], and 0.77 [0.40–1.15], respectively (Kruskal–Wallis p = 0.020; pairwise: A vs B p = 0.031, A vs C p = 0.044, B vs C p = 0.801). For T. denticola, reductions were 0.98 [0.60–1.40], 0.80 [0.45–1.15], and 0.78 [0.40–1.10], respectively (Kruskal–Wallis p = 0.168; pairwise comparisons were not statistically significant after multiplicity adjustment).
Quality control criteria were applied to each batch as pre-specified. Each run included extraction blanks and no-template controls, and reactions were performed in duplicate with repeat testing when duplicate variability exceeded the acceptance threshold. Batch acceptance required a standard-curve R2 ≥ 0.99, amplification efficiency within 90–110%, and duplicate Ct standard deviation ≤ 0.35.
Visual markers of response (optional)
When available, standardized intraoral stills captured at baseline and follow-up can be presented to illustrate reduced erythema and edema, improved marginal cleanliness, and shallower probing with minimal bleeding. If included, present these images as Supplementary Figure S1 using consistent lighting, angulation, and tooth-site labeling, and avoid introducing new claims beyond the quantitative outcomes.
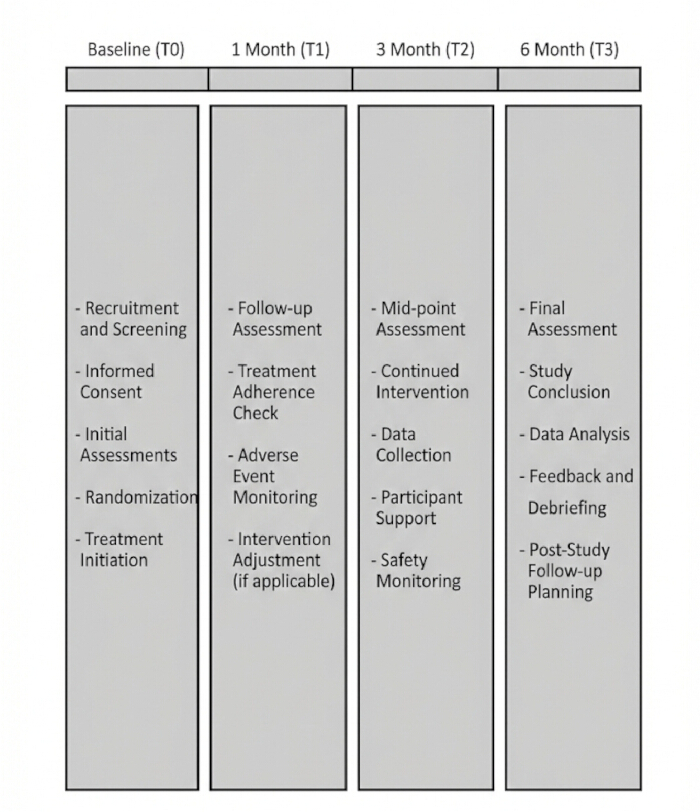
Figure 1: Treatment timeline. Baseline supragingival plaque control and full-mouth clinical charting are followed by standardized subgingival scaling and root planing (SRP). In Groups A and B, gel is placed immediately after completion of SRP in the same visit at pre-specified qualifying index sites. Follow-up visits occur at 1, 3, and 6 months. At the 1-month visit, perform microbiological sampling and standardized monitoring of safety and adherence (adverse events, protocol deviations, and home-care reinforcement) according to the schedule shown; reserve full-mouth clinical assessments for the 3- and 6-month visits. Please click here to view a larger version of this figure.
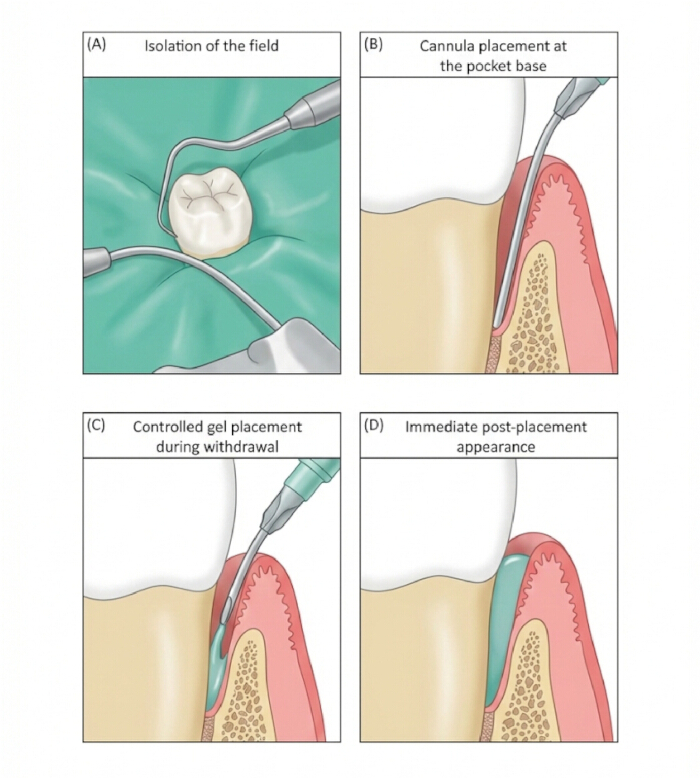
Figure 2: Chairside gel application steps. Isolate the field with cotton rolls and high-volume evacuation, then seat a blunt cannula to the pocket base. Express gel while withdrawing the cannula to fill the pocket from base to margin, then gently stabilize the marginal meniscus to support retention. Do not probe or re-instrument treated sites for 7 days after placement. Please click here to view a larger version of this figure.
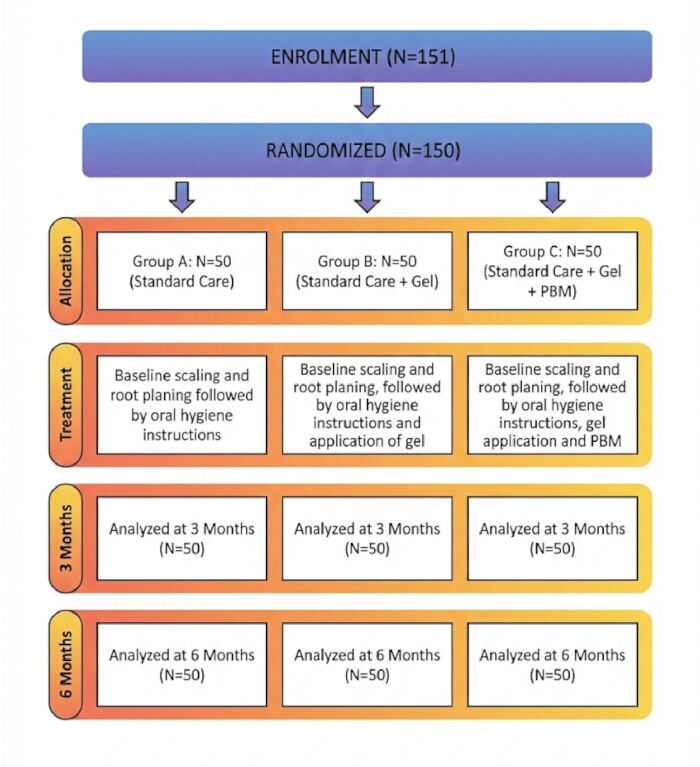
Figure 3: CONSORT flow diagram. Screening, eligibility assessment, randomization (1:1:1), follow-up, and analysis sets are shown for Group A (SRP + 14% doxycycline gel), Group B (SRP + placebo gel), and Group C (SRP only), together with reasons for exclusions and losses to follow-up. Please click here to view a larger version of this figure.
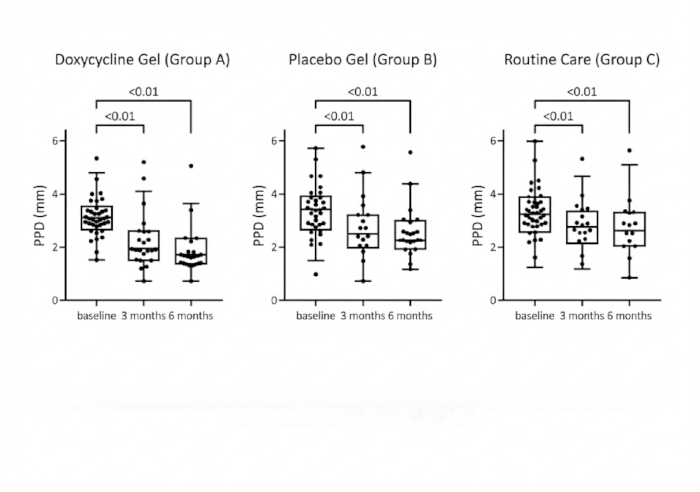
Figure 4: Probing pocket depth (PPD) over time. Mean (± 95% CI) full-mouth PPD (mm) at baseline, 3, and 6 months for each group. All arms show time-dependent improvement after standardized therapy. A pre-specified site-level contrast is also summarized for deep qualifying index sites (baseline PPD ≥ 6–7 mm; treated index sites in Groups A and B and matched reference sites in Group C) to evaluate whether adjunctive therapy yields greater change at deeper pockets. Please click here to view a larger version of this figure.
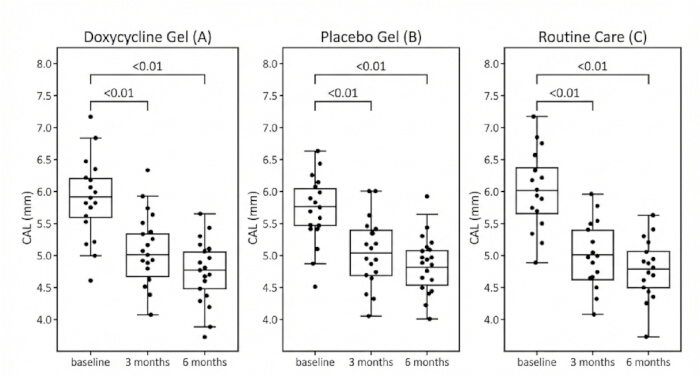
Figure 5: Clinical attachment level (CAL) over time. Mean (± 95% CI) full-mouth CAL (mm) at baseline, 3, and 6 months for each group. CAL gains parallel PPD reductions across follow-up. Interpret between-group differences conservatively at the full-mouth level and anchor site-level interpretation to pre-specified deep qualifying index sites. Please click here to view a larger version of this figure.
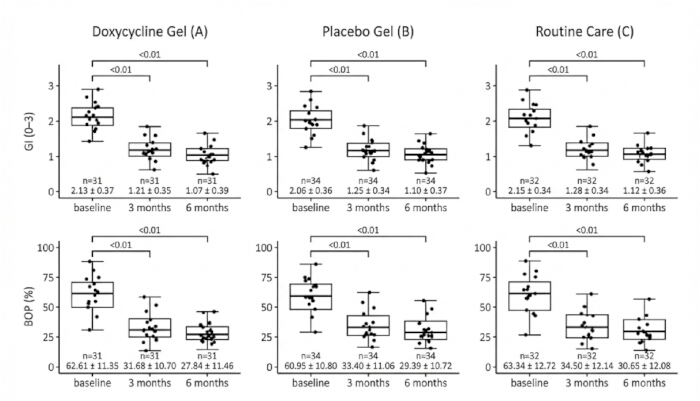
Figure 6: Gingival index (GI) and bleeding on probing (BOP). Group-wise trajectories of GI (0–3 scale) and BOP, expressed as the percentage of sites bleeding within 15 s after standardized probing, at baseline, 3, and 6 months. Assess GI and BOP using a pre-specified scoring guide and a standardized probing sequence to ensure comparability across visits. Please click here to view a larger version of this figure.
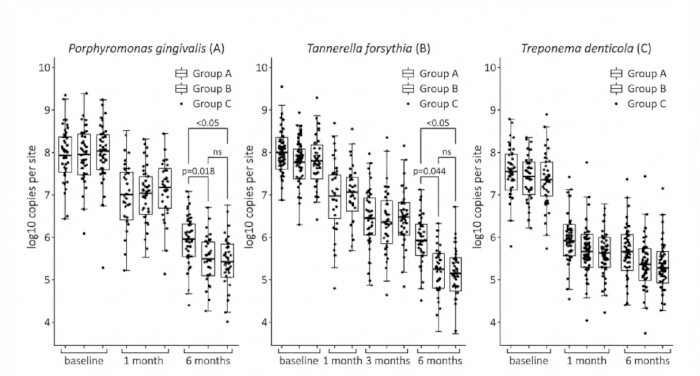
Figure 7: Microbiological loads by qPCR. Subgingival red-complex targets (P. gingivalis, T. forsythia, and T. denticola) quantified by qPCR at baseline, 1, 3, and 6 months and reported as log10 copies per site. Samples are obtained from prespecified sites (treated index sites in Groups A and B; matched reference sites in Group C) and tracked longitudinally across visits. Representative data show reductions after SRP in all groups, with the largest median decreases for P. gingivalis and T. forsythia in the doxycycline arm by month 6, consistent with site-level bacterial suppression under the described quality-control criteria. Please click here to view a larger version of this figure.
General statistical note for figures. Conduct longitudinal analyses using the prespecified model (e.g., mixed models and/or ANCOVA adjusting for baseline), set α = 0.05 (two-tailed), and ensure that all reported p values and confidence intervals match exported statistical outputs. Avoid language implying between-group superiority when p ≥ 0.05.
Table 1: Eligibility criteria. Inclusion and exclusion checklist used at screening for adults with stage III/IV periodontitis, including age range, site-level qualifying thresholds for adjunctive therapy, medical contraindications, recent systemic antibiotic exposure, and allergy history. Please click here to download this Table.
Table 2: Baseline characteristics and full-mouth clinical parameters over follow-up. Baseline demographics, baseline index-site PPD strata, and full-mouth outcomes (PPD, CAL, GI, BOP) are summarized for Group A (SRP + 14% doxycycline gel), Group B (SRP + placebo gel), and Group C (SRP only) at baseline, 3 months, and 6 months. Baseline-adjusted between-group comparisons for PPD and CAL at 3 and 6 months are reported as adjusted mean differences (AMD) with 95% confidence intervals (CI), p values, and Cohen’s d. Please click here to download this Table.
Table 3: Assessment schedule and allowable windows. Overview of assessments performed at baseline, 1, 3, and 6 months, together with allowable visit windows. At the 1-month visit, perform microbiological sampling and standardized monitoring of safety and adherence (adverse events, protocol deviations, and home-care reinforcement) and do not collect full-mouth clinical indices (PPD, CAL, GI, and BOP). Document any deviations from the pre-specified 1-month assessment rule. Please click here to download this Table.
Supplementary Figure S1. Please click here to download this File.
Discussion
This randomized, double-blind, placebo-controlled trial evaluated whether a 14% topical doxycycline gel provides incremental benefit when delivered chairside as an adjunct to standardized SRP in adults with stage III/IV chronic periodontitis. Across all arms, full-mouth indices (PPD, CAL, GI, and BOP) improved through months 3 and 6, consistent with expected responses to effective non-surgical therapy. Against this background, the pre-specified deep-site analyses showed a directionally greater response in the doxycycline arm by month 6, whereas between-group differences at the full-mouth level were modest in this dataset18. A site-based interpretation is clinically coherent because local controlled-release agents are intended to target residual deep pockets where SRP alone can be less predictable, rather than to shift whole-mouth means when SRP is delivered at high quality19. Accordingly, interpretability hinges on maintaining a strict separation between full-mouth outcomes and the pre-specified qualifying sites, together with consistent delivery technique and longitudinal site tracking across follow-up.
Operationally, discussion of troubleshooting should be limited to issues that affect retention and comparability. If crevicular fluid or marginal bleeding compromises placement, the site should be re-isolated and treatment deferred until atraumatic hemostasis is achieved; minor marginal extrusion can be handled by gentle removal without additional instrumentation. When early gel loss is reported, timing and likely cause should be documented and managed under pre-specified deviation rules rather than ad hoc re-application.
The protocol avoided full-mouth probing-based endpoints at the 1-month visit to reduce potential measurement-related interference with early healing dynamics. That visit was reserved for microbiological sampling and standardized monitoring of inflammation and safety, anchoring probing-based clinical interpretation to the 3- and 6-month assessments.
Mechanistically, local doxycycline delivery can achieve high pocket-level concentrations while limiting systemic exposure, and doxycycline may exert host-modulatory effects that support attachment stability in difficult site20.Consistent with that rationale, qPCR trajectories showing stronger suppression of P. gingivalis and T. forsythia in the doxycycline arm by month 6 provide biological plausibility for the deeper-site response pattern21,22, and the relevance of red-complex organisms and qPCR-based quantification is well established23,24.
The magnitude and location of any incremental benefit should also be interpreted in the context of adjunctive strategies evaluated alongside SRP. Across clinical studies of locally delivered gels (including non-doxycycline formulations), incremental effects—when present—are frequently concentrated in deeper or more inflamed sites and appear sensitive to site selection and delivery technique, rather than producing large shifts in full-mouth means25. Comparative work among gel adjuncts similarly underscores that apparent advantages depend on methodological rigor in SRP, pocket selection, and consistent application steps, supporting the use of technique checkpoints to improve reproducibility26. By contrast, antimicrobial adjuncts delivered as mouthrinses can reduce gingival inflammation but are typically less site-targeted and more adherence-dependent, making them conceptually different from pocket-based gel delivery directed at residual deep pockets27.
Several limitations should be considered when interpreting and extending this protocol. Because full-mouth between-group p values were limited in this dataset, inference about added benefit should remain anchored to pre-specified deep-site contrasts and communicated using effect sizes with confidence intervals, avoiding categorical superiority claims28,29. Participant heterogeneity (e.g., smoking and diabetes status) may attenuate adjunctive effects; although these factors were recorded, the study was not powered for robust moderation testing30. The microbiological panel focused on canonical targets31; broader community shifts and keystone dynamics were not evaluated and would require 16S or shotgun approaches to capture ecological remodeling more comprehensively32,33. Finally, antibiotic stewardship considerations, including resistance selection and recurrence patterns, were outside the current scope and should be integrated into future implementations aiming for clinical translation34.
In summary, when delivered as an adjunct to SRP using a standardized, technique-sensitive chairside approach, a 14% topical doxycycline gel was associated with additional improvements that were most evident in pre-specified deeper pockets, while full-mouth between-group differences were modest in this dataset35. Future studies should confirm these observations in multicenter, adequately powered randomized trials with pre-specified deep-pocket analyses, longer follow-up (12–24 months), systematic stewardship and safety monitoring, and inclusion of patient-centered and economic endpoints to support adoption decisions36.
Disclosures
The authors declare no conflicts of interest.
Acknowledgements
We would like to thank all colleagues who have contributed to and supported this research.
Materials
| Name | Company | Catalog Number | Comments |
|---|---|---|---|
| ATM | Anaerobe Systems | AS-911 | 6 mL tubes; for subgingival paper-point transport |
| Anesthetic cartridges (2% lidocaine with epinephrine 1:100,000) | Septodont | 99167 | Local anesthesia for SRP as needed |
| Aspirating dental syringe | Hu-Friedy | ASPI | For dental local anesthetic delivery |
| Balance (for probing-force calibration) | Ohaus | SPX2201 | Portable balance; use for 20–25 g probing-force verification |
| Cotton rolls, medium, non-sterile | Henry Schein | 5703767 | Field isolation during gel placement and sampling |
| Curette, Gracey 1/2 | Hu-Friedy | SG1/2 | SRP instrumentation (anterior) |
| Curette, Gracey 11/12 (rigid) | Hu-Friedy | SGR11/12R | SRP instrumentation (mesial molars) |
| Curette, Gracey 13/14 | Hu-Friedy | SG13/14 | SRP instrumentation (distal molars) |
| Decontamination solution (10% bleach working solution)* | Fisherbrand (Thermo Fisher Scientific) | 23640500 | Surface decontamination for pre-/post-PCR areas (prepare/use per institutional SOP) |
| Disposable face mask (3-ply, earloops) | Fisherbrand | 12-888-001A | Routine chairside/lab use as required by biosafety SOP |
| Disposable nitrile examination gloves | Kimberly-Clark | 55082 | Powder-free nitrile gloves |
| DNA extraction kit | QIAGEN | 51304 | QIAamp DNA Mini Kit (bacterial DNA extraction) |
| Dental explorer (TU17/23) | Hu-Friedy | EXTU17/236 | Detect residual calculus; tactile endpoint verification |
| Doxycycline gel, 14% (periodontal gel) | Kulzer | 397309 | Ligosan Slow Release; for Group A local delivery |
| Filter pipette tips, 20 µL | Axygen (Corning) | TF-20-R-S | Sterile aerosol-barrier tips |
| Filter pipette tips, 200 µL | Axygen (Corning) | TF-200-R-S | Sterile aerosol-barrier tips |
| Filter pipette tips, 1000 µL | Axygen (Corning) | TF-1000-R-S | Sterile aerosol-barrier tips |
| Gauze sponges, sterile 4 × 4 | Medline | PRM21408 | Chairside isolation/hemostasis as needed |
| Irrigation saline, sterile 0.9% | Baxter | 2F7124 | Irrigate pockets after SRP |
| Microbrush applicators | Microbrush International | MB-400 | For shaping/stabilizing gel meniscus |
| Microcentrifuge | Eppendorf | 5404000013 | Centrifuge 5424 R (or equivalent) |
| Micropipette, 0.5–10 µL | Eppendorf | 3123000020 | Research plus (single channel) |
| Micropipette, 10–100 µL | Eppendorf | 3123000055 | Research plus (single channel) |
| Micropipette, 100–1000 µL | Eppendorf | 3123000063 | Research plus (single channel) |
| Nuclease-free water | Invitrogen (Thermo Fisher Scientific) | AM9937 | For qPCR setup and dilutions |
| Paper points, sterile size 30 | Dentsply Sirona | A022T00003000 | Subgingival sampling; pool 2–3 per site |
| PCR plate, optical 96-well (fast clear) | Applied Biosystems (Thermo Fisher Scientific) | 4483485 | Optical 96-well plates |
| Placebo gel base: glycerol (molecular biology grade) | Sigma-Aldrich (Merck) | G5516 | Placebo gel excipient if compounded |
| Placebo gel base: hydroxyethylcellulose | Merck | 822068 | Placebo gel thickener if compounded |
| Placebo gel base: phosphate-buffered saline | Sigma-Aldrich (Merck) | P4474 | Placebo gel diluent if compounded (sterile-filtered PBS) |
| Probing periodontal probe (UNC-15) | Hu-Friedy | PCPUNC15 | PPD/CAL measurement at six sites per tooth |
| qPCR instrument (real-time PCR system) | Applied Biosystems (Thermo Fisher Scientific) | A28139 | QuantStudio 5, 96-well, 0.2 mL block |
| qPCR master mix (SYBR Green) | Applied Biosystems (Thermo Fisher Scientific) | K0221 | PowerUp SYBR Green Master Mix (or equivalent) |
| qPCR analysis software (instrument software) | Applied Biosystems (Thermo Fisher Scientific) | N/A | QuantStudio Design & Analysis Software (version as installed) |
| Sealed envelope supplies (allocation concealment) | Tyvek (DuPont) | S-10562 | Opaque envelopes for randomization (or equivalent) |
| Statistical software | IBM | N/A | IBM SPSS Statistics, Version 26.0 |
| Surface disinfectant (70% ethanol solution)* | Decon Labs | 04-355-122 | SaniHol™ 70 Ethanol Solution (ready-to-use) |
| Sterile syringe, 1 mL (for gel handling if needed) | BD | 309659 | Luer-Lok; chairside preparation |
| Subgingival blunt cannula (irrigation/placement) | Cardinal Health (Monoject) | 8881202397 | Blunt tip cannula for pocket delivery |
| Ultrasonic scaler unit | Dentsply Sirona | 81302 | Cavitron Select SPS (or equivalent) |
| Vortex mixer | Scientific Industries | N/A | Laboratory mixer for sample homogenization |
References
- Papapanou, P. N., et al. Periodontitis: Consensus report of workgroup 2 of the 2017 World Workshop on the Classification of Periodontal and Peri-Implant Diseases and Conditions. J Clin Periodontol. 45 (20), S162-S170 (2018).
- Chen, M. X., Zhong, Y. J., Dong, Q. Q., Wong, H. M., Wen, Y. F. Global, regional, and national burden of severe periodontitis, 1990-2019: An analysis of the Global Burden of Disease Study 2019. J Clin Periodontol. 48 (9), 1165-1188 (2021).
- Wu, L., Zhang, S. Q., Zhao, L., Ren, Z. H., Hu, C. Y. Global, regional, and national burden of periodontitis from 1990 to 2019: Results from the Global Burden of Disease study 2019. J Periodontol. 93 (10), 1445-1454 (2022).
- Sanz, M., et al. Treatment of stage I-III periodontitis: The EFP S3 level clinical practice guideline. Clin Periodontol. 47 (22), 4-60 (2020).
- Budală, D. G., et al. Are Local Drug Delivery Systems a Challenge in Clinical Periodontology. J Clin Med. 12 (12), 4137(2023).
- Cobb, C. M., Sottosanti, J. S. A re-evaluation of scaling and root planing. Periodontol. 92 (10), 1370-1378 (2021).
- Cobb, C. M. Clinical significance of non-surgical periodontal therapy: an evidence-based perspective of scaling and root planing. Clin Periodontol. 29, 22-32 (2002).
- Tonetti, M. S., Greenwell, H., Kornman, K. S. Staging and grading of periodontitis: Framework and proposal of a new classification and case definition. J Periodontol. 89 (1), S159-S172 (2018).
- Herrera, D., et al. Adjunctive effect of locally delivered antimicrobials in periodontitis therapy: A systematic review and meta-analysis. Clin Periodontol. 47 (22), 239-256 (2020).
- American Academy of Periodontology. Statement on local delivery of sustained or controlled release antimicrobials as adjunctive therapy in the treatment of periodontitis. J Periodontol. 77 (8), 1458(2006).
- Gegout, P. Y., Stutz, C., Huck, O. Gels as adjuvant to non-surgical periodontal therapy: A systematic review and meta-analysis. Heliyon. 9 (7), (2023).
- Eickholz, P., et al. Non-surgical periodontal therapy with adjunctive topical doxycycline: a double-blind randomized controlled multicenter study. Clin Periodontol. (2), 108-117 (2002).
- Bonito, A. J., Lux, L., Lohr, K. N. Impact of local adjuncts to scaling and root planing in periodontal disease therapy: a systematic review. J Periodontol. 76 (8), 1227-1236 (2005).
- Smiley, C. J., et al. Systematic review and meta-analysis on the nonsurgical treatment of chronic periodontitis by means of scaling and root planing with or without adjuncts. Am Dent Assoc. 146 (7), 508-524 (2015).
- Drisko, C. H. The use of locally delivered doxycycline in the treatment of periodontitis, Clinical results. J Clin Periodontol. 25 (11 Pt 2), 947-979 (1998).
- Proye, M., Caton, J., Polson, A. Initial healing of periodontal pockets after a single episode of root planing monitored by controlled probing forces. J Periodontol. 53 (5), 296-301 (1982).
- Ratka-Krüger, P., et al. Non-surgical periodontal therapy with adjunctive topical doxycycline: a double-masked, randomized, controlled multicenter study. II. Microbiological results. Periodontol. 76 (1), 66-74 (2005).
- Ilyes, I., Rusu, D., Rădulescu, V., et al. A placebo-controlled trial to evaluate two locally delivered antibiotic gels (piperacillin plus tazobactam vs. doxycycline) in stage III-IV periodontitis patients. Medicina (Kaunas). 59 (2), 303(2023).
- Greenstein, G. Local drug delivery in the treatment of periodontal diseases: assessing the clinical significance of the results. J Periodontol. 77 (4), 565-578 (2006).
- Lee, H. -M., et al. Subantimicrobial dose doxycycline efficacy as a matrix metalloproteinase inhibitor in chronic periodontitis patients is enhanced when combined with a non-steroidal anti-inflammatory drug. J Periodontol. 75 (3), 453-463 (2004).
- Cosgarea, R., et al. Clinical and microbiological evaluation of local doxycycline and antimicrobial photodynamic therapy during supportive periodontal therapy: A randomized clinical trial. Antibiotics (Basel). 10 (3), 277(2021).
- Kuboniwa, M., et al. Quantitative detection of periodontal pathogens using real-time polymerase chain reaction with TaqMan probes. Microbiol Immunol. 19 (3), 168-176 (2004).
- Holt, S. C., Ebersole, J. L. Porphyromonas gingivalis, Treponema denticola, and Tannerella forsythia: the “red complex”, a prototype polybacterial pathogenic consortium in periodontitis. Periodontol 2000. 38, 72-122 (2005).
- Marín, M. J., et al. Validation of a multiplex qPCR assay for detection and quantification of Aggregatibacter actinomycetemcomitans, Porphyromonas gingivalis and Tannerella forsythia in subgingival plaque samples. A comparison with anaerobic culture. Arch Oral Biol. 102, 199-204 (2019).
- Boyapati, R., et al. Efficacy of local drug delivery of Achyranthes aspera gel in the management of chronic periodontitis: A clinical study. Indian Soc Periodontol. 21 (1), 46-49 (2017).
- Zhang, C., Liu, B., Hu, J., Zhao, L., Zhao, H. The Effect of Local Application of Tea Tree Oil Adjunctive to Daily Oral Maintenance and Nonsurgical Periodontal Treatment: A Systematic Review and Meta-Analysis of Randomised Controlled Studies. Oral Health Prev Dent. 22, 211-222 (2024).
- Boyapati, R., et al. Comparative evaluation of the efficacy of probiotic, Aloe vera, povidone-iodine, and chlorhexidine mouthwashes in the treatment of gingival inflammation: A randomized controlled trial. Dent Med Probl. 61 (2), 181-190 (2024).
- Schulz, K. F., et al. CONSORT 2010 statement: updated guidelines for reporting parallel group randomised trials. BMJ. 340, c332(2010).
- Cumming, G. The new statistics: why and how. Psychol Sci. 25 (1), 7-29 (2014).
- Grossi, S. G., et al. Response to periodontal therapy in diabetics and smokers. J Periodontol. 67 (10), 1094-1102 (1996).
- Socransky, S. S., et al. Microbial complexes in subgingival plaque. J Clin Periodontol. 25 (2), 134-144 (1998).
- Hajishengallis, G., Darveau, R. P., Curtis, M. A. The keystone-pathogen hypothesis. Rev Microbiol. 10 (10), 717-725 (2012).
- Griffen, A. L., et al. Distinct and complex bacterial profiles in human periodontitis and health revealed by 16S pyrosequencing. ISME J. 6 (6), 1176-1185 (2012).
- Soysa, N. S., Jayakody, S. L., Alles, N. R. The Long-Term Efficacy of Tetracycline Class Antimicrobials as Local Adjuncts in the Treatment of Chronic Periodontitis: A Systematic Review and Meta-analysis. Front Dent Med. 6, 1658720(2025).
- Kim, T. -S., et al. Comparison of the pharmacokinetic profiles of two locally administered doxycycline gels in crevicular fluid and saliva. J Clin Periodontol. 31 (4), 286-292 (2004).
- Chapple, I. L. C., et al. Periodontal health and gingival diseases and conditions on an intact and a reduced periodontium: Consensus report of workgroup 1 of the 2017 World Workshop on the Classification of Periodontal and Peri-Implant Diseases and Conditions. J Periodontol. 89 (1), S74-S84 (2018).