A retrospective age- and sex-matched case–control study showed that hypertension and current smoking were independently associated with first-ever ischemic stroke and jointly produced a supra-additive increase in risk.
A subscription to JoVE is required to view this content. Sign in or start your free trial.
Research Article
Synergistic Effect of Hypertension and Smoking on Ischemic Stroke Risk: A Case-Control Study With Additive and Multiplicative Interaction Analysis
In This Article
Summary
Abstract
Ischemic stroke remains a leading cause of death and disability worldwide. This single-center retrospective case–control study evaluated the independent and interactive effects of smoking, alcohol consumption, and traditional cardiovascular risk factors on first-ever ischemic stroke. Cases with radiologically confirmed first-ever ischemic stroke and controls were matched in a 1:2 ratio by age (±3 years) and sex between January 2018 and June 2025. Smoking status, pack-years, alcohol intake, hypertension, diabetes mellitus, and lipid variables were assessed. Conditional logistic regression with pre-specified covariates was applied, with interaction evaluated on both multiplicative and additive scales. Firth’s penalization was used to address sparse data, and multiple imputation by chained equations was used to handle missing data. A total of 312 cases and 624 controls were included. Current smoking (odds ratio [OR] 2.34, 95% confidence interval [CI] 1.82–3.01), heavy alcohol consumption (>100 g/wk; OR 1.89, 95% CI 1.34–2.67), hypertension (OR 3.21, 95% CI 2.54–4.06), and diabetes mellitus (OR 2.12, 95% CI 1.56–2.88) were independently associated with ischemic stroke. Hypertension and current smoking demonstrated significant interaction on both multiplicative (interaction OR 1.58, 95% CI 1.12–2.24; P = 0.009) and additive scales (relative excess risk due to interaction 2.87, 95% CI 1.21–4.53; attributable proportion 0.32, 95% CI 0.15–0.49; synergy index 2.18, 95% CI 1.35–3.52). Model discrimination was good (area under the curve 0.82, 95% CI 0.79–0.85). These findings support integrated prevention strategies for individuals with coexisting hypertension and smoking exposure.
Introduction
Ischemic stroke represents a major global health burden, accounting for over 6.55 million deaths and 12.2 million incident cases worldwide in 20201,2. Despite advances in acute treatment and secondary prevention, the incidence of ischemic stroke continues to rise, driven by population aging and the increasing prevalence of modifiable risk factors2,3. Understanding the independent and synergistic effects of these risk factors is critical for developing effective primary prevention strategies and identifying high-risk populations for targeted interventions. Notably, acute ischemic stroke is a heterogeneous disease, and the distribution of risk factors, stroke severity, and outcomes may vary considerably across subtypes, including cardioembolic stroke, lacunar infarct, atherothrombotic infarct, and infarct of unusual aetiology4. Adequate differentiation of ischemic stroke subtypes is therefore an important consideration in clinical studies investigating risk factor profiles.
Traditional cardiovascular risk factors, particularly hypertension, have been consistently identified as major contributors to ischemic stroke risk5,6. Hypertension confers the highest population attributable risk among all modifiable risk factors, with studies showing that blood pressure (BP) control could prevent more than half of all strokes6. Similarly, diabetes mellitus (DM) and dyslipidemia have been established as independent risk factors, with mechanisms involving endothelial dysfunction, atherosclerosis, and prothrombotic states7. The relationship between these metabolic and vascular risk factors and stroke has been extensively documented in large-scale prospective studies and meta-analyses.
Lifestyle factors, particularly cigarette smoking, represent another critical dimension of stroke risk. Current smoking nearly doubles the risk of ischemic stroke, with a clear dose–response relationship between pack-years and stroke risk8,9. The Stroke Prevention in Young Men Study demonstrated odds ratios (ORs) ranging from 1.46 for light smokers (<11 cigarettes/day) to 5.66 for heavy smokers (≥40 cigarettes/day)8. The INTERSTROKE study (Study of the Importance of Conventional and Emerging Risk Factors of Stroke in Different Regions and Ethnic Groups of the World), encompassing 32 countries, reported a global population attributable risk of 12.4% for current smoking10, underscoring its substantial contribution to stroke burden across diverse populations. Smoking exerts its deleterious effects through multiple pathways, including promotion of atherosclerosis, endothelial dysfunction, increased platelet aggregation, elevated fibrinogen levels, and reduced cerebral blood flow secondary to vasoconstriction9.
The relationship between alcohol consumption and ischemic stroke is more complex, exhibiting a J-shaped curve in most populations11,12. Light-to-moderate alcohol intake (1–2 drinks/day) has been associated with reduced ischemic stroke risk in multiple studies11,13, potentially through favourable effects on high-density lipoprotein cholesterol (HDL-C), platelet function, and inflammation. However, heavy alcohol consumption (≥3 drinks/day) increases stroke risk through mechanisms such as hypertension, atrial fibrillation (AF), coagulation abnormalities, and direct neurotoxicity14,15. Recent data from the Alcohol Intake & Health Study suggest that even moderate alcohol consumption may increase ischemic stroke risk at levels of two standard drinks per day (relative risk 1.08, 95% confidence interval 1.01–1.15)16, challenging previous assumptions about protective effects.
Although the independent effects of these risk factors have been well documented, their interactive or synergistic effects remain less comprehensively characterized in certain study contexts. Interaction on the additive scale, quantified by measures such as relative excess risk due to interaction (RERI), is particularly relevant from a public health perspective, as it informs whether interventions targeting multiple risk factors simultaneously would produce benefits exceeding the sum of the benefits of individual interventions17,18. Previous studies, including large prospective cohorts such as UK Biobank, the Multi-Ethnic Study of Atherosclerosis, and the Healthy Life in an Urban Setting study, have examined the smoking–hypertension interaction in relation to cardiovascular disease endpoints9,19,20. However, many earlier case–control studies were limited by small sample sizes and, in some instances, by less standardized exposure definitions or by the absence of formal additive interaction assessment21,22. It is acknowledged that substantial large-scale cohort evidence exists on this topic, and the present study aims to complement rather than replace those findings.
Several methodological challenges have been noted in prior case–control investigations. Earlier case–control studies sometimes employed inconsistent exposure definitions that may have hindered direct comparability10. Smoking status definitions ranged from simple binary categorizations to more nuanced classifications that incorporated duration and intensity. Alcohol consumption quantification also lacked standardization across certain older studies, with diverse definitions of moderate and heavy drinking. Some case–control studies have suffered from insufficient sample sizes, resulting in events per variable (EPV) ratios below the recommended threshold of 10–1523, leading to unstable coefficient estimates and biased standard errors. Sparse data in specific exposure combinations can lead to separation in logistic regression, producing an implausibly large odds ratio (OR)24. Moreover, missing data have often been handled suboptimally through complete-case analysis, introducing selection bias and reducing statistical power.
To address these limitations, a single-center retrospective case–control study was conducted. The primary hypothesis was that smoking and alcohol consumption would demonstrate synergistic interactions with traditional risk factors, particularly hypertension, on both multiplicative and additive scales, suggesting that combined exposures confer risk exceeding the sum of individual effects. The aim was to quantify these independent and interactive effects to inform risk stratification and prevention strategies, with particular emphasis on identifying high-risk subgroups that may benefit most from intensive multifactorial intervention.
Access restricted. Please log in or start a trial to view this content.
Protocol
This study was conducted in accordance with the Declaration of Helsinki and approved by the Research Ethics Committee of Hebei General Hospital (IRB approval number: LW-104). Due to the study's retrospective nature and the use of anonymized patient information, the Ethics Committee of Hebei General Hospital waived the requirement for informed consent. The research tools used in this protocol are listed in the Table of Materials.
1. Study design
This investigation constituted a single-center retrospective case–control study conducted at Hebei General Hospital. Cases comprised individuals with first-ever ischemic stroke, and controls were recruited from contemporaneous health examination attendees or non-cerebrovascular outpatients at the same institution. Individual matching was performed by age (±3 years) and sex, with a case-to-control ratio of 1:2. When individual matching was infeasible, frequency matching was used as a supplementary strategy, with matching factors incorporated into subsequent statistical models.
Data sources included electronic health records, picture archiving and communication systems for neuroimaging, laboratory information management systems, and health examination databases. To ensure an adequate sample size and sufficient events per variable (EPV) for statistical inference, a data collection period from 1 January 2018 to 30 June 2025 was defined. This timeframe was calibrated to yield at least 300 cases and 600 controls, meeting predetermined statistical power requirements and EPV thresholds for the primary analytical model.
2. Study participants
Cases were defined as individuals experiencing a first-ever ischemic stroke, with clinical manifestations consistent with an acute focal neurological deficit of vascular etiology, confirmatory neuroimaging evidence via computed tomography (CT) or magnetic resonance imaging (MRI) with diffusion-weighted imaging (DWI) demonstrating acute cerebral infarction, and no prior history of ischemic stroke based on medical record review and patient or proxy interview. Ischemic stroke subtypes were classified according to the Trial of Org 10172 in Acute Stroke Treatment (TOAST) criteria by adjudicating neurologists.
Exclusion criteria included hemorrhagic stroke (intracerebral hemorrhage or subarachnoid hemorrhage) or transient ischemic attack (TIA) without infarction on imaging, cerebral venous sinus thrombosis, and extensive missing data on critical variables (>30% missingness on key exposure or covariate measurements that could not be reliably imputed).
Two board-certified neurologists independently adjudicated each potential case, with discrepancies resolved through consultation with a third senior neurologist. This standardized adjudication process ensured diagnostic consistency and minimized misclassification bias. The index date for cases was defined as the date of stroke symptom onset or, when precise onset timing was unavailable, the date of initial medical presentation with stroke symptoms.
Controls were sampled from individuals attending the hospital’s health examination center or presenting to non-cerebrovascular outpatient clinics during the same study period. Eligibility criteria required the absence of any history of cerebrovascular disease, including stroke or TIA, as documented in medical records and confirmed by a structured interview. Controls were individually matched to cases by age (±3 years) and sex at a 1:2 ratio. When individual matching was not possible, frequency matching was used to ensure comparable overall age and sex distributions across groups. In such instances, matching factors were explicitly included as covariates in conditional or unconditional logistic regression models to control for residual confounding.
Previous research has documented pervasive problems of inadequate sample size and insufficient EPV in epidemiological studies employing logistic regression25. To address these limitations, the Peduzzi rule-of-thumb, recommending a minimum EPV of 10, was applied, with contemporary guidance suggesting an EPV ≥ 15 for models incorporating interaction terms. The primary analytical model was specified a priori to include approximately 12 parameters, comprising categorical exposure variables such as smoking status and alcohol consumption, pre-specified confounders including age with splines, body mass index (BMI), systolic blood pressure (SBP) with splines, diabetes, dyslipidemia, medication use, renal function, and homocysteine, as well as a primary interaction term between hypertension and current smoking.
Pack-year categories and smoking status categories were not included simultaneously in the primary model to avoid collinearity; instead, these were examined in separate models. The simultaneous inclusion of the hypertension diagnosis and the SBP spline was justified because the binary hypertension variable captures treatment status, whereas the SBP spline models the continuous, potentially non-linear relationship between measured blood pressure and stroke risk. Variance inflation factor (VIF) assessment confirmed acceptable collinearity (VIF < 3.5 for both variables). Applying the conservative threshold of EPV ≥ 15, the minimum required case count of 180 was calculated.
The target sample size was set at ≥300 cases with ≥600 matched controls. This sample size also provided adequate statistical power to detect main effects and key interactions. Using the Hsieh method26 for matched case–control designs, formal power calculations were conducted for the primary smoking exposure, assuming a control exposure prevalence of 30% for current smoking, an anticipated odds ratio (OR) of 1.6, α = 0.05 (two-sided), a 1:2 matching ratio, and a target power of 90%.
3. Variables and measurements
The primary outcome was the occurrence of first-ever ischemic stroke (yes/no). Case ascertainment required dual neurologist adjudication based on clinical presentation and confirmatory neuroimaging. Stroke timing was defined as the date of symptom onset or, when unavailable, the date of first medical evaluation documenting acute neurological deficits.
Exposure variables included smoking and alcohol consumption. Smoking behavior was classified as never smoker, former smoker, or current smoker. Never smoking was defined as lifetime consumption of fewer than 100 cigarettes, former smoking as cessation at least 6 months before the index or reference date, and current smoking as active smoking within 6 months of the index or reference date. Smoking intensity was quantified as pack-years, calculated as (average cigarettes per day ÷ 20) × years of smoking. Ordinal categories (<10, 10–20, >20 pack-years) were used for dose–response analyses.
Alcohol intake was standardized to grams of pure ethanol per week (g/wk), based on standard ethanol content assumptions for beer (5%), wine (12%), and spirits (40%). One standard drink was defined as approximately 10 g of ethanol. Consumption levels were categorized as none (0 g/wk), light-to-moderate (1–100 g/wk), and heavy (>100 g/wk).
All exposure data were collected through structured interviews supplemented by medical record abstraction. For cases, exposures reflected habitual patterns in the year preceding stroke onset; for controls, exposures corresponded to the period preceding the health examination or clinic visit. When necessary, telephone follow-up interviews with patients or proxies were conducted.
Figure 1 presents a directed acyclic graph illustrating the hypothesized relationships among exposures, confounders, and outcomes, which informed covariate selection. The pre-specified covariate set included age, sex, BMI, SBP, diabetes mellitus, dyslipidemia, medication use, lipid profile (LDL-C, HDL-C), renal function (eGFR), homocysteine, atrial fibrillation, and family history. Variables were coded consistently: 1 indicated presence or elevation, and 0 indicated absence or normal levels. Table 1 provides detailed definitions and measurement specifications for the variables.
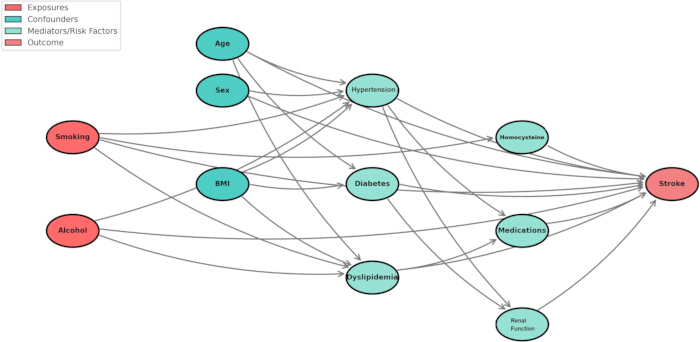
Figure 1: Directed acyclic graph (DAG). This diagram displays the prespecified relationships among smoking, alcohol consumption, traditional cardiovascular risk factors, measured confounders, and ischemic stroke. Directed arrows denote the assumed analytic structure used to identify the minimal sufficient adjustment set with the dagitty algorithm. Please click here to view a larger version of this figure.
| Variable | Definition & Measurement | Encoding | Notes |
| Ischemic stroke | First-ever, imaging-confirmed | 1/0 | Primary outcome |
| Smoking status | Never/Former/Current | 0/1/2 | Also record pack-years |
| Pack-years | (Cigarettes/day ÷ 20) × years | Continuous | RCS modeling |
| Alcohol (g/wk) | Pure ethanol grams/week | Continuous | Categories: 0, 1-100, >100 |
| Systolic BP | mmHg | Continuous | RCS modeling |
| Hypertension | BP ≥140/90 or meds | 1/0 | Binary |
| Diabetes | Diagnosis or meds | 1/0 | Binary |
| Dyslipidemia | Diagnosis or meds | 1/0 | Binary |
| LDL-C | mmol/L | Continuous | Higher=worse |
| HDL-C | mmol/L | Continuous | Lower=worse |
| eGFR | CKD-EPI, mL/min/1.73m² | Continuous | Lower=worse |
| Homocysteine | μmol/L | Continuous | Higher=worse |
| Statin use | Medication history | 1/0 | Binary |
| Antihypertensive use | Medication history | 1/0 | Binary |
| HTN × Smoking | Product term | -- | Primary interaction |
| BP, blood pressure; CKD-EPI, Chronic Kidney Disease Epidemiology Collaboration; HDL-C, high-density lipoprotein cholesterol; HTN, hypertension; LDL-C, low-density lipoprotein cholesterol; RCS, restricted cubic splines | |||
| (Uniform 1=Present/High, 0=Absent/Low) | |||
Table 1: Variable encoding dictionary (Uniform 1=Present/High, 0=Absent/Low). This table defines the coding framework used for all binary, categorical, and continuous variables and documents the harmonized measurement rules applied during data abstraction.
4. Data sources, cleaning, and missing data handling
To minimize transcription errors, two independent researchers performed parallel data abstraction for all cases and a random 10% sample of controls, with discrepancies resolved through third-party adjudication. Data quality assurance included range checks for implausible values, logical consistency checks, and duplicate record resolution. Inter-rater reliability was assessed using intraclass correlation coefficients for continuous variables and Cohen’s kappa statistics for categorical variables, with all values exceeding 0.85.
Missing data were addressed using multiple imputation by chained equations (MICE). Predictive mean matching was used for continuous variables, logistic regression for binary variables, and multinomial or ordinal logistic regression for categorical variables as appropriate. Twenty imputed datasets were generated to improve the estimation precision. The imputation model included all analysis variables, auxiliary variables related to missingness, and the outcome. Derived variables, including interaction terms, were passively imputed to maintain consistency.
5. Statistical analysis
Model goodness-of-fit and predictive performance were evaluated using multiple metrics. Multicollinearity was assessed using variance inflation factors (VIFs), with VIF >10 indicating problematic multicollinearity that requires remediation through variable reduction or ridge penalization. Discrimination was quantified using the area under the curve (AUC). It should be noted that, because this was a matched case–control study, absolute risks could not be estimated directly, and the AUC was derived from an unconditional logistic regression model that included age, sex, and all pre-specified covariates as a secondary assessment of discriminatory ability rather than a claim of population-level calibration. The reported Brier score reflects the mean squared difference between predicted probabilities and observed case–control status within the analytic sample and is presented as a relative model performance measure rather than a calibrated population-level metric, given that the 1:2 case-to-control ratio does not reflect the true disease prevalence. Decision curve analysis was conducted as a secondary assessment; numeric metrics and threshold ranges are reported in the text.
Regarding additive interaction measures (RERI, AP, S), it is acknowledged that these metrics are formally defined in terms of risks or relative risks (RRs). In the present matched case–control design, odds ratios (ORs) estimated from conditional logistic regression serve as approximations to RRs under the rare-disease assumption. Based on the source population data (3,847 potential cerebrovascular cases screened from a broader clinical population alongside 18,456 eligible controls), the crude stroke prevalence in this institutional setting was approximately 17%–18%. Although this exceeds the conventional threshold for the rare-disease assumption, recent methodological work has shown that additive interaction measures derived from ORs remain informative and directionally consistent with those based on RRs even when disease prevalence is moderate, although the magnitude of RERI may be somewhat overestimated17.18. The conditional ORs from the matched analysis were used to calculate RERI, AP, and S, with bootstrapped confidence intervals (1,000 replicates) to provide valid inference. These results should be interpreted as approximate measures of additive interaction strength rather than exact population-level risk attributions.
The six frequency-matched cases (1.9% of the total) were handled by including matching variables (age and sex) as covariates in the conditional logistic regression model. A sensitivity analysis excluding these six cases and their matched controls yielded virtually identical results (data not shown), confirming that this minor departure from individual matching did not influence conclusions.
Influential observations and outliers were identified using delta–beta statistics and Cook’s distance, and sensitivity analyses excluding extreme values were conducted to assess the findings. The following pre-specified sensitivity analyses were conducted: re-analysis using only current smoker (versus never/former combined) as a binary exposure; evaluation of associations with ischemic stroke subtypes classified by TOAST criteria where data permitted; comparison of models using different numbers and positions of restricted cubic spline (RCS) knots for continuous covariates; complete-case analysis restricted to individuals with complete data on all model variables; sequential removal of observations with extreme covariate values (beyond the 1st and 99th percentiles); stratification by sex and age categories (<60 and ≥60 years), including a separate analysis of young patients with stroke (≤55 years); and, if residual covariate imbalance persisted after matching (standardized mean difference ≥0.10), inverse probability of treatment weighting (IPTW) using propensity scores for key exposures as auxiliary analyses.
Regarding propensity score estimation in this case–control design, the propensity model was fitted to predict the probability of current smoking (exposure), conditional on pre-exposure covariates, rather than predicting case–control status; therefore, the 1:2 sampling ratio does not affect the validity of the propensity score. All analyses were performed using R version 4.3.x or later (R Foundation for Statistical Computing, Vienna, Austria). Key packages included survival (conditional logistic regression), logistf (Firth’s penalized logistic regression), rms (RCS and model diagnostics), epiR (additive interaction measures), mice (multiple imputation), boot (bootstrap confidence intervals), and ggplot2 (data visualization).
Access restricted. Please log in or start a trial to view this content.
Results
Sample derivation and matching success
Figure 2 depicts the participant flow diagram following Strengthening the Reporting of Observational Studies in Epidemiology guidelines. From an initial pool of 3,847 patients with suspected cerebrovascular events between January 2018 and June 2025, 892 with hemorrhagic stroke, 456 with TIA without infarction, 127 with cerebral venous thrombosis, 1,238 with recurrent strokes, and 822 with insufficient data were excluded. This yielded 312 cases o...
Access restricted. Please log in or start a trial to view this content.
Discussion
This case–control study, with EPV = 26.0, pre-registration, Firth’s penalization, multiple imputation, and dual-scale interaction assessment, generated several findings. First, independent associations between modifiable risk factors—current smoking, heavy alcohol consumption, hypertension, and diabetes mellitus—and first-ever ischemic stroke were confirmed, with effect sizes consistent with international literature. Second, a significant synergistic interaction between hypertension and current sm...
Access restricted. Please log in or start a trial to view this content.
Disclosures
The authors declare no competing interests. No financial or non-financial conflicts of interest influenced the study design, data collection, analysis, interpretation, or manuscript preparation.
Acknowledgements
The authors thank the study participants for their contributions. The medical staff and research assistants at Hebei General Hospital are acknowledged for their assistance with data collection and patient care. This study was supported by the Health and Wellness Innovation Special Project (Project Number: 242W7703Z) and the Central Funds Project for Guiding Local Technological Development (Freely Exploratory Basic Research) (Project Number: 236Z7745G).
Access restricted. Please log in or start a trial to view this content.
Materials
| Name | Company | Catalog Number | Comments |
|---|---|---|---|
| Computed tomography (CT) imaging system | Hebei General Hospital Department of Radiology | N/A | Clinical CT platform used as part of routine neuroimaging assessment for suspected cerebrovascular events. |
| Electronic health record (EHR) system | Hebei General Hospital | N/A | Institutional clinical record system used to retrieve demographic information, diagnoses, medical history, medication use, and clinical encounter data for de-identified participants. |
| Health examination database | Hebei General Hospital | N/A | Institutional health examination database used as one source for control identification and matching. |
| Laboratory information management system (LIMS) | Hebei General Hospital | N/A | Institutional laboratory database used to extract LDL-C, HDL-C, eGFR, homocysteine, and other laboratory variables. |
| Magnetic resonance imaging (MRI) system with diffusion-weighted imaging (DWI) | Hebei General Hospital Department of Radiology | N/A | Clinical MRI/DWI platform used to confirm acute cerebral infarction where available. |
| Medical record abstraction form | Study-developed form, Hebei General Hospital | N/A | Standardized abstraction sheet used by independent researchers to extract exposure, covariate, medication, and outcome data. |
| Microsoft Excel | Microsoft Corporation | Microsoft 365/Excel-compatible workbook | Used to organize tabular source data and prepare the supplementary data workbook. |
| Picture archiving and communication system (PACS) | Hebei General Hospital | N/A | Institutional neuroimaging archive used to review CT and MRI/DWI studies for ischemic stroke confirmation and adjudication. |
| R package: boot | CRAN/R package authors | boot | Used to calculate bootstrap confidence intervals. |
| R package: dagitty | CRAN/dagitty project | dagitty | Used for directed acyclic graph specification and adjustment-set verification. |
| R package: epiR | CRAN/R package authors | epiR | Used to estimate additive interaction measures including RERI, AP, and synergy index. |
| R package: ggplot2 | CRAN/R package authors | ggplot2 | Used to generate statistical figures and visualizations. |
| R package: logistf | CRAN/R package authors | logistf | Used for Firth's penalized logistic regression to address sparse-data bias. |
| R package: mice | CRAN/R package authors | mice | Used for multiple imputation by chained equations. |
| R package: rms | CRAN/R package authors | rms | Used for restricted cubic splines and model diagnostics. |
| R package: survival | CRAN/R package authors | survival | Used for conditional logistic regression in the matched case-control analysis. |
| R statistical software | R Foundation for Statistical Computing | Version 4.3.x or later | Primary statistical environment used for regression modeling, imputation, interaction analysis, bootstrapping, diagnostics, and visualization. |
| STROBE reporting checklist | STROBE Initiative | N/A | Reporting framework used to structure the observational-study flow and manuscript reporting. |
| Structured interview form | Study-developed form, Hebei General Hospital | N/A | Standardized form used to collect or verify smoking status, pack-years, alcohol intake, and relevant historical exposure information. |
| TOAST ischemic stroke subtype classification | Trial of Org 10172 in Acute Stroke Treatment classification system | N/A | Clinical classification system used by neurologists to categorize ischemic stroke subtypes. |
References
- GBD 2019 Stroke Collaborators. Global, regional, and national burden of stroke and its risk factors, 1990-2019: a systematic analysis for the Global Burden of Disease Study 2019. Lancet Neurol. 2021;20(10):795-820.
- Feigin VL, Brainin M, Norrving B, et al. World Stroke Organization: global stroke fact sheet 2025. Int J Stroke. 2025;20(2):132-144.
- Pu L, Wang L, Zhang R, et al. Projected global trends in ischemic stroke incidence, deaths, and disability-adjusted life years from 2020 to 2030. Stroke. 2023;54(5):1330-1339.
- Tuttolomondo A, Pecoraro R, Casuccio A, et al. Peripheral frequency of CD4+ CD28- cells in acute ischemic stroke: relationship with stroke subtype and severity markers. Int J Mol Sci. 2022;23(16):9476.
- Gorelick PB, Whelton PK. Blood pressure management in stroke: viewpoint. Hypertension. 2020;76(6):1688-1695.
- Zhong XL, Dong Y, Xu W, et al. Role of blood pressure management in stroke prevention: a systematic review and network meta-analysis of 93 randomized controlled trials. J Stroke. 2021;23(1):1-11.
- Ha SH, Lee DY, Shim JS, et al. Dyslipidemia treatment and cerebrovascular disease: evidence regarding the mechanism of stroke. J Lipid Atheroscler. 2024;13(2):139-154.
- Luo J, Tang X, Li F, et al. Cigarette smoking and risk of different pathologic types of stroke: a systematic review and dose–response meta-analysis. Front Neurol. 2022;12:772373.
- Gallucci G, Tartarone A, Lerose R, et al. Cardiovascular risk of smoking and benefits of smoking cessation. J Thorac Dis. 2020;12(7):3866-3876.
- Khan M, Wasay M, O’Donnell MJ, et al. Risk factors for stroke in the young (18–45 years): a case-control analysis of INTERSTROKE data from 32 countries. Neuroepidemiology. 2023;57(5):275-283.
- Larsson SC, Burgess S, Mason AM, et al. Alcohol consumption and cardiovascular disease: a Mendelian randomization study. Circ Genom Precis Med. 2020;13(3):e002814.
- Reynolds K, Lewis B, Nolen JD, et al. Alcohol consumption and risk of stroke: a meta-analysis. JAMA. 2003;289(5):579-588.
- Ding C, O’Neill D, Bell S, et al. Association of alcohol consumption with morbidity and mortality in patients with cardiovascular disease: original data and meta-analysis of 48,423 men and women. BMC Med. 2021;19(1):167.
- Toubasi AA, Al-Sayegh TN. Alcohol use and types of ischemic stroke: a systematic review and meta-analysis. Eur Neurol. 2025;88(3-4):140-150.
- Tomar K. Effect of alcoholism on ego strength among adults. Indian J Health Wellbeing. 2025;16(1):70-72.
- Biddinger KJ, Emdin CA, Haas ME, et al. Association of habitual alcohol intake with risk of cardiovascular disease. JAMA Netw Open. 2022;5(3):e223849.
- Rothman KJ, Greenland S, Lash TL. Modern epidemiology. 3rd ed. Philadelphia (PA): Lippincott Williams & Wilkins; 2008.
- Li R, Chambless L. Test for additive interaction in proportional hazards models. Ann Epidemiol. 2007;17(3):227-236.
- Lacey B, Herrington WG, Preiss D, et al. The role of emerging risk factors in cardiovascular outcomes. Curr Atheroscler Rep. 2017;19(6):28.
- Roerecke M, Kaczorowski J, Myers MG. Comparing automated office blood pressure readings with other methods of measurement: a systematic review and meta-analysis. JAMA Intern Med. 2019;179(3):351-362.
- Lin S, Hu C, Lin Z, et al. Bayesian estimation of the measurement of interactions in epidemiological studies. PeerJ. 2024;12:e17128.
- Knol MJ, VanderWeele TJ, Groenwold RH, et al. Estimating measures of interaction on an additive scale for preventive exposures. Eur J Epidemiol. 2011;26(6):433-438.
- Zabor EC, Reddy CA, Tendulkar RD, et al. Logistic regression in clinical studies. Int J Radiat Oncol Biol Phys. 2022;112(2):271-277.
- Firth D. Bias reduction of maximum likelihood estimates. Biometrika. 1993;80(1):27-38.
- Riley RD, Ensor J, Snell KIE, et al. Calculating the sample size required for developing a clinical prediction model. BMJ. 2020;368:m441.
- Bujang MA. A step-by-step process on sample size determination for medical research. Malays J Med Sci. 2021;28(2):15.
- Amarenco P, Kim JS, Labreuche J, et al. A comparison of two LDL cholesterol targets after ischemic stroke. N Engl J Med. 2020;382(1):9-19.
- Torres-Riera S, Arboix A, Parra O, et al. Predictive clinical factors of in-hospital mortality in women aged ≥85 years with acute ischemic stroke. Cerebrovasc Dis. 2025;54(1):11-19.
- Arboix A, Estevez S, Rouco R, et al. Clinical characteristics of acute lacunar stroke in young adults. Expert Rev Neurother. 2015;15(7):825-831.
- Libby P, Buring JE, Badimon L, et al. Atherosclerosis. Nat Rev Dis Primers. 2019;5(1):56.
- VanderWeele TJ, Ding P. Sensitivity analysis in observational research: introducing the E-value. Ann Intern Med. 2017;167(4):268-274.
- Hackshaw A, Morris JK, Boniface S, et al. Low cigarette consumption and risk of coronary heart disease and stroke: meta-analysis of 141 cohort studies. BMJ. 2018;360:j5855.
- Duncan MS, Freiberg MS, Greevy RA Jr, et al. Association of smoking cessation with subsequent risk of cardiovascular disease. JAMA. 2019;322(7):642-650.
- Larsson SC, Burgess S, Michaëlsson K. Smoking and stroke: a Mendelian randomization study. Ann Neurol. 2019;86(3):468-471.
- Samokhvalov AV, Irving HM, Rehm J. Alcohol consumption as a risk factor for atrial fibrillation: a systematic review and meta-analysis. Eur J Cardiovasc Prev Rehabil. 2010;17(6):706-712.
- Park TH, Ko Y, Lee SJ, et al. Identifying target risk factors using population attributable risks of ischemic stroke by age and sex. J Stroke. 2015;17(3):302-311.
- Riley RD, Snell KI, Ensor J, et al. Minimum sample size for developing a multivariable prediction model: part II—binary and time-to-event outcomes. Stat Med. 2019;38(7):1276-1296.
Access restricted. Please log in or start a trial to view this content.