This study compares corneal curvature and astigmatism measurements from three biometers in age-related cataract patients and assesses inter-device agreement and differences. With a large cohort of 800 eyes, this study provides novel evidence that inter-device agreement varies substantially by parameter: excellent for simulated keratometry but poor for total and posterior keratometry, highlighting the importance of parameter-specific device selection.
Research Article
Comparison of Corneal Curvature and Astigmatism Measurements Among Three Optical Biometers in Age-Related Cataract Patients
Opens in a new tab
In This Article
Summary
Loading...
$$\rightleftharpoonup{xx}$$
$$\longleftharp{xx}$$,
$$\longrightharp{xx}$$,
Abstract
Loading...
$$\rightleftharpoonup{xx}$$
$$\longleftharp{xx}$$,
$$\longrightharp{xx}$$,
Precise preoperative corneal measurements are crucial for optimizing intraocular lens power calculation in cataract surgery. Nevertheless, the agreement among different biometers remains ambiguous. This study was designed to compare the agreement of corneal curvature and astigmatism measurements obtained with CASIA2 (device 1), IOLMaster 700 (device 2), and Pentacam HR (device 3) in patients with age-related cataract. In this cross-sectional study, 800 eyes of 593 patients with age-related cataract were examined prior to phacoemulsification. The steep keratometry (Ks), flat keratometry (Kf), mean keratometry (Km), and astigmatism (J0, J45) of the anterior, posterior, and total cornea were documented. Repeated-measures analysis of variance (rANOVA) or Friedman tests were employed to assess inter-device differences. Agreement was evaluated using Intraclass correlation coefficients (ICCs) and Bland-Altman analysis with 95% limits of agreement (LoA). Statistically significant differences were detected in most parameters across devices. Simulated keratometry (SimK) exhibited excellent inter-device reliability, with over 95% of differences within ± 1.0 D. Total keratometry (TK) showed good agreement, whereas posterior keratometry (PK) demonstrated poor agreement. Regarding astigmatism, the J0 components displayed higher consistency than the J45 components. Bland-Altman analysis revealed clinically acceptable LoA for SimK but greater variability for TK and PK parameters. SimK measurements showed high agreement across the three devices in this cataract cohort, supporting their clinical utility. However, due to significant discrepancies in TK and PK parameters, device-specific protocols are recommended for posterior and total corneal assessments. These findings may provide guidance for device selection in preoperative cataract evaluation.
Introduction
Loading...
$$\rightleftharpoonup{xx}$$
$$\longleftharp{xx}$$,
$$\longrightharp{xx}$$,
Modern cataract surgery has transitioned from a vision-restoration procedure to a sophisticated refractive intervention, where postoperative visual quality has emerged as a primary determinant of surgical success. Considering that the cornea constitutes roughly two-thirds of the total refractive power of the eye, the precise characterization of its curvature is of paramount significance. Corneal astigmatism exceeding 0.5 diopters (D) can lead to clinically significant visual impairments, such as blurred vision, glare, and monocular diplopia1. This refractive sensitivity necessitates careful selection of corneal topography devices, as measurement discrepancies across technologies (e.g., manual keratometry versus Scheimpflug tomography, a rotating camera-based imaging system) directly affect the accuracy of surgical planning. Optimal biometric precision enhances the reliability of intraocular lens (IOL) calculations, minimizes postoperative refractive uncertainties, and consequently improves visual outcomes and patient satisfaction indices2.
Accurate quantification of corneal curvature and astigmatism serves as a critical preoperative requirement in cataract surgery, directly influencing the selection of the optimal IOL power. Previous research has indicated that a 1.0 D difference in corneal power measurement may lead to approximately a 1.0 D change in IOL power calculation, depending on the formula and axial length3. It has been reported that the measurement error of keratometry accounted for 22% of the total prediction error4. Emerging evidence suggests that integrating total corneal refractive power into calculation formulas improves postoperative visual acuity by optimizing astigmatic correction3. Conventional keratometry measures corneal power based on the anterior surface curvature, whereas total refractive power is jointly determined by the anterior and posterior corneal surfaces. TK incorporates essential biometric parameters, including corneal thickness and posterior curvature5. Therefore, TK addresses the prevalent problem of underestimating the alteration in corneal power, which is frequently encountered when using the standard and SimK methods that rely solely on anterior corneal curvature measurements3 .
Epidemiological investigations suggest that approximately half of the eyes subjected to cataract surgery exhibit corneal astigmatism exceeding 1.0 D, with the majority of candidates (60%) having preoperative measurements ranging from 0.25 D to 1.25 D6. Notably, over 20% of cases demonstrate astigmatism exceeding 1.50 D7. Correction of astigmatism exceeding 0.50 D significantly enhances postoperative visual acuity, while central corneal astigmatism greater than 0.75 D may compromise visual outcomes with trifocal IOLs due to the induction of higher-order aberrations2,8. Spherical IOLs result in the persistence of astigmatic errors in the cornea, which are manifested as refractive astigmatism. Toric IOLs, which correct for this corneal astigmatism, facilitate spectacle - free vision in the pseudophakic eye9. Their efficacy is directly associated with the measurement precision of the principal meridian power and axis alignment by ocular biometers10. Previous studies have shown that for every 1° deviation in IOL axis placement, the astigmatism correction effect is reduced by 3.3%, and the correction effect is lost if the deviation exceeds 30°11. Ignoring corneal astigmatism preoperatively or failing to adopt appropriate treatment measures during surgery may impact the surgical outcome. Therefore, accurate preoperative measurement of optical biometry serves as the crucial factor in attaining precise postoperative refractive results12.
Contemporary corneal curvature assessment utilizes multiple modalities, including Scheimpflug tomography, optical low-coherence reflectometry, and slit-scanning topography systems. Although previous studies have evaluated the reliability of individual devices, multicenter, large-sample comparative analyses of these three-device systems are scarce. Recent evaluations of device 1, device 2, and Pentacam have provided critical insights: First, all three devices show strong inter-device agreement in anterior corneal power measurements, indicating comparable performance in curvature assessment2,13. Second, the repeatability of these measurements supports their clinical and research applications14,15. Additionally, the measurement correlations for astigmatism quantification are weaker compared to those for corneal power, and the differential clinical implications require further validation.
There are still significant knowledge gaps in current ophthalmic measurement research. While paired-device comparisons are prevalent, comprehensive multi-platform analyses are underrepresented. Moreover, temporal variations in corneal refractive power and astigmatism, especially the post-interventional progression, require long-term characterization. Finally, standardization protocols for devices using different optical acquisition principles and proprietary algorithms need systematic validation. Resolving these limitations is essential for achieving cross-platform measurement accuracy and clinical comparability in corneal biometric assessment. Statistically significant differences in TK, PK, and associated astigmatism measurements among device 2, device 1, and Pentacam AXL have been demonstrated, confirming their non-interchangeability13. Although their analysis revealed inter-device correlations for TK and PK parameters, its clinical applicability was limited by the small sample size. No prior multicenter studies have directly compared device 1, device 2, and device 3 in cataract populations. Therefore, this study aims to systematically evaluate the inter-device agreement for corneal curvature and astigmatic measurements among device 1, device 2, and device 3 using a large sample of age-related cataract patients, thereby providing evidence-based guidelines for optimal device selection in preoperative cataract assessment. A schematic overview of the study workflow and measurement procedure is presented in Figure 1.
Access restricted. Please log in or start a trial to view this content.
Protocol
Loading...
$$\rightleftharpoonup{xx}$$
$$\longleftharp{xx}$$,
$$\longrightharp{xx}$$,
This study was approved by the ethics committee of Aier Eye Hospital of Wuhan University (approval number: 2022IRBKY032001, date: 2022-03-20) and adhered to the tenets of the Declaration of Helsinki. The study included 593 patients (800 eyes). All participants provided written informed consent prior to enrollment.
Study design
A cross-sectional comparative measurement workflow was performed in patients with age-related cataract at a tertiary eye hospital. A total of 593 patients (800 eyes) with age-related cataract who were scheduled for phacoemulsification at Wuhan Aier Eye Hospital between April 2022 and May 2023 were consecutively recruited. The cohort was composed of 255 male patients and 338 female patients, with a mean age of 67.74 ± 8.42 years. Both eyes of each patient were included when they met the eligibility criteria. If only one eye qualified, that eye was enrolled. For patients with both eyes included, each eye was analyzed independently, given the bilateral nature of cataract pathology and the focus on device-level comparisons rather than inter-eye symmetry. Relevant demographic data, such as age and sex, were retrieved from electronic medical records.
Inclusion criteria
Inclusion criteria were as follows: (1) The participants were aged 18 years or older and capable of cooperating to complete this study. (2) Soft contact lenses had been discontinued for at least two weeks, and rigid contact lenses had been discontinued for at least one month.
Exclusion criteria
The exclusion criteria encompassed active keratitis, pterygium, corneal scarring, keratoconus, glaucoma, uveitis, retinal detachment, nystagmus that impaired fixation, prolonged use of contact lenses (> 2 weeks pre-operatively), and a history of ocular trauma or intraocular surgery.
Devices
This study assessed three optical biometers. All three devices were adjusted to their default settings.
Device 1: The second-generation anterior segment optical coherence tomography (AS-OCT) employs a light source with a wavelength of 1310 nm. It achieves axial and lateral resolutions of 10 µm and 30 µm, respectively, with an acquisition speed of 50,000 A-scans per second. The system captures 16 three-dimensional volumetric scans (16 × 16 × 13 mm) of the anterior segment within 0.3 seconds4. For corneal measurements, the device automatically identifies the anterior and posterior corneal boundaries using low-coherence interferometry and reconstructs topographic maps based on 16 radial B-scans centered on the corneal apex14. It uses a 3.0 mm optical zone for simulated keratometry. Each subject's eyes were examined once by an experienced operator, ensuring data of "OK" quality.
Device 2: It adopts swept-source OCT technology with a wavelength of 1055 nm, achieving an axial resolution of 22 µm15. This system conducts six-meridian scans across a 6 mm corneal width and obtains anterior keratometry from 18 projected points within the central 2.5 mm zone. Posterior corneal curvature and pachymetry are quantified through high-speed OCT acquisition (2,000 A-scans per second). It uses partial-coherence interferometry and image-processing algorithms to measure the distance between six symmetrically arranged reflected-light spots on the anterior corneal surface. By ascertaining the separation among these spots, the device calculates the radius of curvature of the annular corneal surface and the mean corneal curvature between two points. During the examination, the six light spots must be in sharp focus. The patient is requested to blink to maintain tear film stability prior to each reading. A green “√” indicator and a distortion-free corneal curvature image verify the adequacy of the measurement quality.
Device 3: This rotating Scheimpflug imaging system employs a monochromatic 475 nm wavelength as its light source. This system executes 360° rotational scans across 25 meridians within one second using a 14 mm slit beam. It reconstructs three-dimensional anatomical models of the anterior segment from 138,000 discrete elevation data points via proprietary Scheimpflug imaging algorithms. The derivation of the total refractive power of the cornea requires the extraction of data from the anterior and posterior surfaces through tomographic imaging. Sagittal and tangential curvature radii are computationally determined through vector analysis of these topographic datasets, enabling comprehensive corneal optical characterization16. The system computationally determines total corneal refractive power through ray tracing that adheres to Snell's law across multiple corneal loci. This optical power distribution analysis enables the derivation of SimK values for discrete annular zones via polynomial regression modeling17, In this study, total corneal refractive power was measured as the total corneal refractive power calculated for the central 3.0 mm zone centered on the corneal apex, using the device's default settings. During the examination, the patient's chin and forehead are placed on the instrument supports within a darkroom, and the patient gazes at a fixation target. After focusing, the patient blinks to moisten the cornea, and an automatic measurement commences. Only scans that meet the "OK" criteria in pentacam's quality specification system were incorporated into this study. If yellow or red warnings appear (such as blinking, eye movement, or light interference), remeasurement is necessary.
Measurement procedure
All biometric measurements were performed by two certified ophthalmology technicians with over five years of clinical experience. To ensure consistency, each patient was examined by the same technician for all three devices throughout the study. A randomized device measurement sequence was implemented to minimize order effects. Participants maintained a standardized position with the chin stabilized on the chin rest and the forehead in contact with the headrest; they were instructed to fixate on the internal fixation target of each device. Before each measurement, patients were asked to blink twice completely and then keep their eyes open to ensure an intact and evenly distributed tear film. Both eyes of each patient were included in the study when they met the eligibility criteria, as this reflects routine clinical practice where bilateral cataract surgery is common. For patients with only one eligible eye (e.g., due to prior surgery or trauma in the fellow eye), that single eye was enrolled.
Quality control
All three imaging systems automatically acquired corneal measurements during steady fixation. All reported values represent the automatic output of the devices, with no manual adjustments applied. No manual averaging or outlier removal was performed by the investigators. For each device, only measurements meeting the manufacturer's built-in quality specifications were accepted. If any scan failed these quality criteria, it was immediately discarded and repeated. Using this protocol, three acceptable scans were obtained for each eye with each device. To prevent measurement sequences from affecting results, this study adopted randomized measurement sequences. The interval between measurements on each device was controlled within 10 min to reduce the impact of natural tear film fluctuations on measurement results.
Outcome measures
Anterior, posterior, and total keratometry values were quantified. Comparative analyses encompassed Kf, Ks, Km, and astigmatic magnitude/axis measurements across corneal planes. All keratometry values were recorded in D, and astigmatism axes were recorded in degrees from 0° to 180°.
Vector conversion
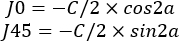
For statistical analysis, corneal curvatures were converted from diopters into vector representation in accordance with the methods proposed by Thibos and Horner18. The J0 and J45 parameters represent the Jackson-crossed cylinder components with powers along the axes 180 and 45, respectively19, are more suitable for mathematical and statistical analysis as independent, orthogonal components18. Positive values of J0 represented with-the-rule astigmatism, negative values represented against-the-rule astigmatism, and J45 corresponded to oblique astigmatism. The cylinder C was equivalent to the difference between steep keratometry and flat keratometry. Moreover, the axis corresponded to the degree of the steep keratometry18. Prior to analysis, we verified that all three devices report corneal astigmatism using the conventional minus-cylinder format, with the axis indicating the steep meridian in degrees from 0 to 180. No discrepancies in axis notation or sign convention were identified across devices. Therefore, the raw axis values were used directly in the power vector conversion without additional standardization. The conversion to Jackson cross-cylinder components (J0 and J45) followed the method of Thibos and Horner18.
Statistical analysis
Analyses were performed using SPSS, Normality was assessed via the Kolmogorov–Smirnov test, where statistical significance was delineated as p < 0.05. Data conforming to a normal distribution were reported as the mean ± standard deviation (SD), whereas non-normally distributed data were presented in the form of the interquartile range, rANOVA was utilized to evaluate inter-device differences, and Fisher’s LSD tests were subsequently conducted for significant results (p < 0.05). Nonparametric comparisons utilized Friedman tests with Bonferroni-corrected post hoc analyses. Inter-device agreement was evaluated through the ICC computed via a two-way random-effects model for single measurements, based on the absolute agreement definition20. The analysis was performed in SPSS by selecting "Analyze > Scale > Reliability Analysis," setting the model to "Two-Way Random > Absolute Agreement." ICC values (ranging from 0 to 1) were interpreted in accordance with established clinical reliability thresholds: values less than 0.50 were considered indicative of poor reliability, those between 0.50 and 0.75 of moderate reliability, those between 0.75 and 0.90 of good reliability, and those greater than 0.90 of excellent reliability21. Furthermore, agreement analysis were performed using MedCalc, the Bland-Altman method was used to quantify inter-device agreement, reporting the mean difference, 95% confidence interval (CI), and LoA22,23. In MedCalc, this was performed by selecting "Statistics > Method comparison & evaluation > Bland-Altman plot," then selecting the two variables to compare and checking "Calculate limits of agreement." The plots visually displayed the agreement, and the output table provided the bias, LoA, and 95%CI. The mean difference and 95% LoA were utilized to illustrate the agreement and variability. The 95% LoA was defined as the mean ± 1.96 SD of the difference between the devices. Moreover, the width of the LoA was integrated into the analysis, as it is more applicable in clinical practice. A narrower 95% LoA was associated with a higher degree of agreement. A P. value less than 0.05 was considered to be statistically significant24. The clinical significance of the analysis was contrasted by taking into account the following factors: 1. In the case of keratometry, an acceptable LoA was considered to be one where 95% of the differences were within 1.0 D of the mean. 2. A difference in astigmatism with a magnitude greater than 0.5D would influence the outcome25,26.
Access restricted. Please log in or start a trial to view this content.
Results
Loading...
$$\rightleftharpoonup{xx}$$
$$\longleftharp{xx}$$,
$$\longrightharp{xx}$$,
Agreement of keratometry
Statistically significant disparities were detected for SimKf, SimKs, SimKm, PKf, PKs, PKm, and TKf, TKs, TKm obtained via these three biometers (all P < 0.001). The device 1 exhibited the highest mean SimK (SimKm; 44.33 ± 1.47 D), followed by the device 2 (44.22 ± 1.49 D) and the device 3 (44.05 ± 1.46 D). The device 2 had the highest TKm (TKm; 44.26 ± 1.48 D), followed by the device 3 (43.31 ± 1.5 D) and the device 1 (43.28 ± 1.44 D). The device 3 presented the ...
Access restricted. Please log in or start a trial to view this content.
Discussion
Loading...
$$\rightleftharpoonup{xx}$$
$$\longleftharp{xx}$$,
$$\longrightharp{xx}$$,
This study assessed the concordance of ocular biometric measurements in cataract patients among three devices. Statistically significant disparities were identified in corneal curvature and astigmatism measurements across the devices. Specifically, device 1 presented the highest SimK values. For total keratometry, device 2 exhibited the highest TK values, while device 1 and device 3 showed comparable lower values, with device 3 measuring slightly lower TKf than device 1. Regarding posterior keratometry, device 3 recorded...
Access restricted. Please log in or start a trial to view this content.
Disclosures
Loading...
$$\rightleftharpoonup{xx}$$
$$\longleftharp{xx}$$,
$$\longrightharp{xx}$$,
The authors declare that they have no competing interest.
Acknowledgements
Loading...
$$\rightleftharpoonup{xx}$$
$$\longleftharp{xx}$$,
$$\longrightharp{xx}$$,
The authors thank the 593 patients for their participation, as well as the colleagues, institutions, and agencies who supported this work. This work received funding from the Natural Science Foundation of Hunan Province, China (Grant No. 2024JJ9042) and the Scientific Research Foundation of Aier Eye Hospital Group (Project No. AGF2314D03).
Access restricted. Please log in or start a trial to view this content.
Materials
| Name | Company | Catalog Number | Comments |
|---|---|---|---|
| Anterior segment optical coherence tomography (AS-OCT) device | Tomey Corporation, Nagoya, Japan | CASIA2 (Device 1) | Optical coherence tomographer |
| MedCalc software | MedCalc Software Ltd, Ostend, Belgium | 22.009 | RRID: SCR_015044 |
| Scheimpflug tomography system | Oculus Optikgeräte GmbH, Wetzlar, Germany | Pentacam HR (Device 3) | Three-dimensional anterior segment analysis system |
| SPSS software | IBM, Armonk, NY, USA | 27.0.1.0 | RRID: SCR_016479 |
| Swept-source optical coherence tomography (SS-OCT) biometer | Carl Zeiss Meditec AG, Jena, Germany | IOLMaster 700 (Device 2) | Optical biometer |
References
Loading...
$$\rightleftharpoonup{xx}$$
$$\longleftharp{xx}$$,
$$\longrightharp{xx}$$,
- Han, S. U., et al. Analysis of keratometric measurements in accordance with axial length in an aged population. Sci Rep. 12 (1), 4087(2022).
- Ma, S., et al. Comparison of two swept-source optical coherence tomography devices, a Scheimpflug camera system and a ray-tracing aberrometer in the measurement of corneal power in patients with cataract. Graefes Arch Clin Exp Ophthalmol. 262 (5), 1567-1578 (2024).
- Liu, Q., et al. Total and simulated keratometry measurements using IOLMaster 700 and Pentacam AXL after small incision lenticule extraction. Int Ophthalmol. 44 (1), 237(2024).
- Ruan, X., et al. Agreement of anterior segment parameter measurements with CASIA 2 and IOLMaster 700. Front Med (Lausanne). 9, 777443(2022).
- Zhao, H., Chen, X., Liu, B., Liu, X., Liu, Y. Accuracy of refractive outcomes using standard or total keratometry for intraocular lens power formulas in conventional cataract surgery. BMC Ophthalmol. 23 (1), 346(2023).
- Mohammadi, M., Naderan, M., Pahlevani, R., Jahanrad, A. Prevalence of corneal astigmatism before cataract surgery. Int Ophthalmol. 36 (6), 807-817 (2016).
- Llorens-Quintana, C., et al. Accuracy of OCT-derived net corneal astigmatism measurement. J Cataract Refract Surg. 48 (3), 267-274 (2022).
- Wang, L., Meng, J., Qi, J., Guo, D., Lu, Y., et al. Impact of central corneal astigmatism on postoperative visual outcomes in patients undergoing trifocal intraocular lens implantation. BMC Ophthalmol. 25 (1), 19(2025).
- Goggin, M. Toric intraocular lenses: Evidence-based use. Clin Exp Ophthalmol. 50 (5), 481-489 (2022).
- McLintock, C., Uprety, S., McKelvie, J. Corneal astigmatism agreement between a swept-source ocular coherence tomography and Scheimpflug-Placido based optical biometers. Int Ophthalmol. 45 (1), 83(2025).
- Berdahl, J. P., Hardten, D. R., Kramer, B. A., Potvin, R. The effect of lens sphere and cylinder power on residual astigmatism and its resolution after toric intraocular lens implantation. J Refract Surg. 33 (3), 157-162 (2017).
- Xiao, Y. H., Liu, Y. Q., Chen, Z. G. Changes in corneal curvature and astigmatism in senile cataract patients after phacoemulsification. Front Med (Lausanne). 11, 1481285(2024).
- Jin, A., et al. Agreement of total keratometry and posterior keratometry among IOLMaster 700, CASIA2, and Pentacam. Transl Vis Sci Technol. 12 (3), 13(2023).
- Jin, G. M., Xiao, B., Zhou, Y. J., Wang, Y. Y., Li, X. P., et al. Agreement of corneal curvature and central corneal thickness obtained from a swept-source OCT and Pentacam in ectopia lentis patients. Int J Ophthalmol. 13 (8), 1244-1249 (2020).
- Srivannaboon, S., Chirapapaisan, C. Comparison of refractive outcomes using conventional keratometry or total keratometry for IOL power calculation in cataract surgery. Graefes Arch Clin Exp Ophthalmol. 257 (12), 2677-2682 (2019).
- Kose, B. Agreement between swept-source optical biometry and Scheimpflug-based topography measurements of posterior corneal curvature. J Cataract Refract Surg. 48 (2), 185-189 (2022).
- Wang, L., et al. Repeatability and agreement of 4 biometers measuring corneal astigmatism in eyes with irregular corneal astigmatism component. Am J Ophthalmol. 265, 200-212 (2024).
- Thibos, L. N., Horner, D. Power vector analysis of the optical outcome of refractive surgery. J Cataract Refract Surg. 27 (1), 80-85 (2001).
- Thibos, L. N., Wheeler, W., Horner, D. Power vectors: an application of Fourier analysis to the description and statistical analysis of refractive error. Optom Vis Sci. 74 (6), 367-375 (1997).
- Koo, T. K., Li, M. Y. A guideline of selecting and reporting intraclass correlation coefficients for reliability research. J Chiropr Med. 15 (2), 155-163 (2016).
- Shoji, T., et al. In vivo crystalline lens measurements with novel swept-source optical coherent tomography: an investigation on variability of measurement. BMJ Open Ophthalmol. 1 (1), e000058(2017).
- Montes-Mico, R. Evaluation of 6 biometers based on different optical technologies. J Cataract Refract Surg. 48 (1), 16-25 (2022).
- Doğan, N. Bland-Altman analysis: A paradigm to understand correlation and agreement. Turk J Emerg Med. 18 (4), 139-141 (2018).
- Bland, J. M., Altman, D. G. Statistical methods for assessing agreement between two methods of clinical measurement. Lancet. 1 (8476), 307-310 (1986).
- Shajari, M., et al. Evaluation of total corneal power measurements with a new optical biometer. J Cataract Refract Surg. 46 (5), 675-681 (2020).
- Kommineni, U. B., Mohamed, A., Vaddavalli, P. K., Reddy, J. C. Comparison of total keratometry with corneal power measured by optical low-coherence reflectometry and placido-dual Scheimpflug system. Eur J Ophthalmol. 32 (3), 1496-1503 (2022).
- Cheng, S., et al. Repeatability and agreement of two swept-source optical coherence tomographers and Scheimpflug imaging for measurements of corneal curvature. BMC Ophthalmol. 24 (1), 439(2024).
- Hua, Y., Qiu, W., Xiao, Q., Wu, Q. Precision (repeatability and reproducibility) of ocular parameters obtained by the Tomey OA-2000 biometer compared to the IOLMaster in healthy eyes. PLoS One. 13 (2), e0193023(2018).
- Liao, X., Peng, Y., Liu, B., Tan, Q. Q., Lan, C. J. Agreement of ocular biometric measurements in young healthy eyes between IOLMaster 700 and OA-2000. Sci Rep. 10 (1), 3134(2020).
- Zhang, T., et al. Comparison of a new swept-source anterior segment optical coherence tomography and a Scheimpflug camera for measurement of corneal curvature. Cornea. 39 (7), 818-822 (2020).
- Savini, G., Taroni, L., Schiano-Lomoriello, D., Hoffer, K. J. Repeatability of total keratometry and standard keratometry by the IOLMaster 700 and comparison to total corneal astigmatism by Scheimpflug imaging. Eye (Lond). 35 (1), 307-315 (2021).
- Asena, L., Akman, A., Güngör, S. G., Dursun Altınörs, D. Comparison of keratometry obtained by a swept source OCT-based biometer with a standard optical biometer and Scheimpflug imaging. Curr Eye Res. 43 (7), 882-888 (2018).
- Dong, J., et al. Comparison of corneal power and corneal astigmatism of different diameter zones centered on the pupil and corneal apex using Scheimpflug tomography. Cornea. 39 (1), 77-83 (2020).
- Wang, Q., et al. A comprehensive assessment of the precision and agreement of anterior corneal power measurements obtained using 8 different devices. PLoS One. 7 (9), e45607(2012).
- Sharma, A., Batra, A. Assessment of precision of astigmatism measurements taken by a swept-source optical coherence tomography biometer - IOLMaster 700. Indian J Ophthalmol. 69 (7), 1760-1765 (2021).
- Li, X., Cao, X., Bao, Y. Comparison of total corneal astigmatism between IOLMaster and Pentacam. Biomed Res Int. 2022, 9236006(2022).
- Hiraoka, T., et al. Influence of dry eye disease on the measurement repeatability of corneal curvature radius and axial length in patients with cataract. J Clin Med. 11 (3), (2022).
- Ho, J. D., Tsai, C. Y., Liou, S. W. Accuracy of corneal astigmatism estimation by neglecting the posterior corneal surface measurement. Am J Ophthalmol. 147 (5), 788-795.e1-2 (2009).
- Zheng, T., Chen, Z., Lu, Y. Influence factors of estimation errors for total corneal astigmatism using keratometric astigmatism in patients before cataract surgery. J Cataract Refract Surg. 42 (1), 84-94 (2016).
- Ueno, Y., et al. Age-related changes in anterior, posterior, and total corneal astigmatism. J Refract Surg. 30 (3), 192-197 (2014).
- Koch, D. D., et al. Contribution of posterior corneal astigmatism to total corneal astigmatism. J Cataract Refract Surg. 38 (12), 2080-2087 (2012).
- Langenbucher, A., et al. Prediction of corneal power vectors after cataract surgery with toric lens implantation: a vector analysis. PLoS One. 18 (9), e0288316(2023).
Access restricted. Please log in or start a trial to view this content.
Reprints and Permissions
Request permission to reuse the text or figures of this JoVE article
Request Permission