This article presents a standardized protocol for spine-pinching manipulation (SP) in a young rat model of asthma. This protocol attenuated airway inflammation, hyperresponsiveness, and remodeling in an OVA-induced asthma model. The study may lay the groundwork for mechanistic exploration and clinical translation.
Method Article
Establishment of a Standardized Protocol of Spine-Pinching Manipulation for a Rat Model of Pediatric Asthma
In This Article
Summary
Abstract
Asthma is the most prevalent chronic inflammatory airway disease in children and is characterized by chronic airway inflammation, airway hyperresponsiveness (AHR), and airway remodeling. In traditional Chinese medicine (TCM), spine-pinching manipulation (SP) is a widely used pediatric massage technique for managing asthma and other childhood diseases. Despite a history of clinical use spanning more than 1,000 years, SP remains largely unfamiliar outside China. Moreover, the mechanisms underlying SP remain insufficiently characterized. This article describes a feasible and standardized protocol for SP that replicates the essential procedures used in clinical practice. Application of the protocol improved airway inflammation, AHR, and airway remodeling in a juvenile rat model of asthma. To enhance reproducibility, key procedural parameters were standardized, including finger pressure, manipulation frequency, number of repetitions, and intervention duration. The standardized protocol in this study may serve as a reference for further research on SP standardization and its underlying mechanisms in experimental pediatric asthma.
Introduction
Pediatric asthma is characterized by chronic airway inflammation, airway hyperresponsiveness (AHR), and airway remodeling1,2. It often begins in early childhood and is the most common chronic disease among school-aged children. Current conventional treatments include inhaled corticosteroids, β₂-receptor agonists, leukotriene receptor antagonists, and biologic therapies3,4. However, only 44.1% of children and 55.4% of adolescents with asthma achieve adequate disease control worldwide5. Moreover, repeated administration of systemic or inhaled corticosteroids may contribute to growth retardation in children with poorly controlled asthma6.
As a traditional external therapy, massage (also known as tuina in China) is cost-effective, well-tolerated, and generally considered safe for children. Massage has long been used in both China and Western countries for the prevention and treatment of pediatric asthma7. Systematic reviews and meta-analyses have reported favorable outcomes of massage therapy in the management of pediatric asthma7,8. Spine-pinching manipulation (SP) is a classical and widely practiced technique in traditional Chinese pediatric massage. According to traditional Chinese medicine (TCM) theory, stimulation of the Governor Vessel (GV) and Bladder (BL) meridians along the back modulates Zang-Fu organ function, thereby maintaining systemic homeostasis and preventing or treating disease9,10,11. Previous studies demonstrated that SP not only improved atopic symptoms and signs in children but also reduced chronic airway inflammation in a young rat model of asthma12,13,14. In addition to its clinical use, SP is commonly practiced as a home-based healthcare intervention11,15. Despite a clinical history spanning more than one thousand years, SP remains relatively unfamiliar outside China, and its underlying mechanisms have not been extensively investigated. Therefore, standardized animal models are essential for elucidating the mechanisms of SP and supporting its broader scientific evaluation and application.
Several studies have established standardized massage protocols for animal research. A previous study developed a standardized back- or abdominal-stroking protocol at approximately 20 cm/s and a pressure of 100 mm H₂O to inhibit cardiovascular excitatory responses16. More recently, repetitive unidirectional spinal tactile stimulation along the GV using a mechanical stimulator was shown to promote synaptic remodeling in the medial prefrontal cortex of an adolescent mouse model of autism. In that protocol, a moderate pressure of approximately 30–50 g was applied at a velocity of approximately 15.3 cm/s without causing discomfort or injury. Stimulation was delivered in a unidirectional manner from the caudal region to the nape (occipital region) twice daily for 10 min over a 21-day period17. However, manual manipulation differs fundamentally from mechanical stimulation, and no mechanical device currently reproduces the characteristic movements of SP. Furthermore, although several studies have investigated the mechanisms of SP in rat models of asthma and other pediatric disorders18, no standardized protocol has been established to define the stimulation force and speed required for SP in animal studies. Therefore, the development of a standardized SP protocol is essential to improve reproducibility and facilitate mechanistic investigations.
Allergic asthma is the most common phenotype of pediatric asthma19. Accordingly, ovalbumin (OVA) sensitization and challenge are the most widely used methods for establishing an experimental model of pediatric asthma20. Rats are particularly suitable for investigating massage-based interventions because their larger body size facilitates manual manipulation. In addition, rat models reliably reproduce key pathological features of allergic asthma, including Th2-skewed inflammation, AHR, and airway remodeling21.
Previous studies demonstrated that SP alleviated airway inflammation in young rats following OVA sensitization and challenge11,14. Therefore, the present study aimed to establish a standardized SP protocol for a young rat model of pediatric asthma to facilitate future investigations into the underlying mechanisms of SP. This standardized protocol provides a reproducible experimental framework for mechanistic studies and future translational research on SP in animal models of pediatric asthma.
Protocol
This study was approved by the Animal Care and Use Committee of the Nanjing University of Chinese Medicine (No. 202306A032). All procedures were conducted in accordance with the National Institutes of Health Guidelines for the Care and Use of Laboratory Animals and the ARRIVE 2.0 guidelines.
Thirty 3-week-old male specific pathogen-free (SPF) Sprague-Dawley (SD) rats weighing 45–55 g were used. The rats were housed (three per cage) in an SPF barrier facility under a 12 h light/dark cycle at 22 ± 2 °C and 30%–40% relative humidity, with free access to standard chow and water. Based on previous studies using young rat models of asthma11,14, the sample size was determined to minimize animal use in accordance with the reduction principle of the 3Rs. After a 7-day acclimatization period, baseline body weight was recorded, and each rat was assigned a unique identification number. The rats were stratified according to baseline body weight and then allocated within each stratum to one of five groups using a random-number table, with an allocation ratio of 1:1:1:1:1 (n = 6 per group): control (CN), asthma (AS), asthma + SP (AS+SP), asthma + methylprednisolone (AS+MP), and asthma + SP + methylprednisolone (AS+SP+MP). The randomization sequence and group allocation were generated by an investigator who was not involved in the subsequent interventions or outcome assessments.
The inclusion criteria were healthy male SPF SD rats aged 3 weeks, weighing 45–55 g at baseline, exhibiting a normal respiratory pattern, and showing regular physical activity. Rats were excluded if they exhibited signs of disease or a body weight deviation of >20% from the cohort mean during acclimatization, or if they died before completion of the intervention phase. Appropriate personal protective equipment, including a laboratory coat, disposable mask, and gloves, was worn throughout the procedure. Animal carcasses and tissues were placed in double-layer biohazard bags and stored at −20 °C before disposal. Contaminated bedding was disposed of as biohazardous solid waste, and sharps were discarded in approved puncture-resistant sharps containers. For terminal tissue collection, 20% urethane (5 mL/kg, i.p.) was administered, and deep anesthesia was confirmed by the absence of pedal withdrawal and corneal reflexes.
1. Establishment of the young rat asthma model
NOTE: The following procedure was used to establish the young rat asthma model12.
- Prepare the OVA/Al(OH)₃ suspension immediately before each injection. Dissolve 2 mg of Grade V OVA directly in 1 mL of 4% Al(OH)₃ gel, and vortex until a homogeneous suspension is obtained.
NOTE: Ensure that the suspension is homogeneous before injection. If precipitation occurs, briefly vortex to resuspend the mixture. Store the suspension on ice and use it within 2 h of preparation. - Inject 1 mL of the OVA/Al(OH)₃ suspension intraperitoneally on experimental days 1, 8, and 15. Inject 1 mL sterile normal saline (0.9% NaCl) into rats in the CN group according to the same schedule.
- Challenge the rats with a 2% Grade II OVA solution from experimental day 21 to day 42 using an ultrasonic nebulizer. Administer the final two consecutive challenges with 3% OVA to induce exacerbation after sensitization.
- Perform nebulization every other day for 30 min over a 3-week period. Place each rat individually in a sealed exposure chamber connected to the ultrasonic nebulizer (ultrasonic frequency: 1.7 MHz ± 10%; nebulization rate: ≥3 mL/min; particle diameter: <5 µm).
NOTE: Confirm successful establishment of the asthma model by observing sneezing, head nodding during respiration, open-mouth breathing, abdominal muscle contraction, and wheezing.
2. Operation and application of the Finger TPS system software
- Insert the sensor plug vertically into the circuit-board interface. Connect the circuit board to the computer using a USB-C cable approximately 40 cm in length to allow sufficient operating flexibility.
- Disinfect the hands and finger protectors. Insert the operator's right thumb and index finger into the sensor-equipped finger sleeves. Position the flexible sensors over the center of the finger pads and ensure close, wrinkle-free contact with the skin.
- Perform system calibration and quality control for force measurement
- Inspect the sensors and connecting cables before each operator-training session and verify that the device is properly connected.
- Select “N” as the measurement unit and set the measurement range to −3.5 to 32 N.
- Ensure that no external force is applied to the sensors. Execute the “Tare” function to zero the system.
- Record the unloaded baseline for 30 s. Begin force measurement only when the baseline variation remains below 0.02 N.
- Repeat the zeroing procedure whenever the sensor position or sleeve tightness is adjusted or when baseline drift is observed.
- Use the Finger TPS system to monitor the applied force during operator training. Maintain a force of 5 ± 0.6 N during back stroking and 12 ± 2 N during SP while maintaining the prescribed speed and frequency.
- Accept the force curve only when the baseline remains stable, no signal interruption or saturation occurs, and the applied force remains within the specified target ranges.
- Perform back-stroking manipulation and SP while monitoring the dynamic force curve. Adjust the tightness of the finger sleeves as needed until a stable force curve is obtained.
- Practice the manipulations while monitoring the real-time force curve. Maintain a target force of 5 ± 0.6 N and a speed of approximately 5 cm/s during back stroking, and maintain a target force of 12 ± 2 N at a frequency of 6–8 repetitions/min during SP. Consider the operator competent only after five consecutive practice trials meet the criteria for manipulation technique, finger force, and SP frequency.
NOTE: Consider the operator qualified only after consistently achieving the target force and movement parameters. Remove the finger protectors before performing the formal SP procedure to avoid additional tactile stimulation of the rats. However, none of the inter-operator reproducibility tests in this study should be considered when adopting this protocol as a reference for the SP study.
3. Detailed procedure of spine-pinching manipulation
- Hold the rat gently in the prone position on one palm. Support the forelimbs by gently encircling the front axillae with the thumb and index finger and allow the forelimbs to hang naturally. Ensure that the rat remains calm with steady respiration. If vocalization, struggling, or defecation occurs, release the rat and allow it to acclimate for 2–3 min before repositioning (Figure 1).
- Stroke the back twice from the shoulder region to the tail base along the Governor Vessel (GV) using the right index, middle, and ring fingers. Apply a force of approximately 5 N to calm the rat before SP.
- Pinch the skin at the root of the tail using the right thumb positioned posteriorly and the index and middle fingers positioned anteriorly. Lift the skin gently, then twist and advance the fingers cranially along the spine toward Dazhui (GV14). Avoid causing obvious signs of discomfort. Maintain a finger pressure of approximately 12 N and perform the manipulation at a frequency of 6–8 repetitions/min. Perform 15 repetitions from experimental day 1 to day 21 and 25 repetitions from day 22 to day 44.
- Repeat the back-stroking procedure described in Step 3.2 to conclude the treatment session and calm the rat.
NOTE: According to traditional Chinese medicine (TCM) theory, SP is performed along the spine to stimulate the GV and BL meridians (Figure 2). The GV extends along the dorsal midline from the tail root to Dazhui (GV14), whereas the BL meridian lies approximately 3–6 mm lateral to the midline, depending on body size22. Dazhui (GV14) is located at the midpoint between the seventh cervical vertebra and the first thoracic vertebra. Increase the number of SP repetitions with age to mimic the clinical treatment regimen. During back stroking, ensure the rat remains relaxed, breathes calmly, and shows no defensive behavior. During SP, expect mild back arching and whisker spreading without stress-induced urination, defecation, violent struggling, vocalization, or escape attempts.
4. Intervention protocols
- Assign rats in the CN group to receive no disease-specific intervention. Handle the rats gently for the same duration as the AS+SP group to control for handling effects. Administer intraperitoneal normal saline (1 mL/kg) on the same schedule used for methylprednisolone injections.
- Subject rats in the AS group to OVA sensitization and challenge. Apply the same handling and saline-injection control procedures used for the CN group.
- Subject rats in the AS+SP group to OVA sensitization and challenge. Apply the SP protocol once daily before model induction.
- Subject rats in the AS+MP group to OVA sensitization and challenge. Administer methylprednisolone (10 mg/kg; 2 mg/mL prepared in saline) by intraperitoneal injection 30 min before each OVA challenge.
- Subject rats in the AS+SP+MP group to the same procedures used for the AS+MP group. Apply the SP protocol once daily before methylprednisolone injection.
NOTE: Except for the AS+SP and AS+SP+MP groups, apply the same handling procedures to all other groups to control for nonspecific handling effects. Use sterile disposable syringes for all injections and discard needles in puncture-resistant sharps containers. Insert the intraperitoneal injection needle lateral to the abdominal midline to minimize the risk of visceral injury. To control for tactile stimulation in non-SP groups, stroke the rats four times during the same intervention as the SP group every day. Use the same back-stroking procedure as that used for the SP groups.
Results
Body weight is an important indicator of growth in young rats. No significant differences in body weight were observed among the five groups before experimental treatment. Following asthma model induction, the AS group exhibited significantly lower body weight than the CN group (P = 0.000; Figure 3A). Compared with the AS group, the AS+SP group showed a significantly greater body weight (P = 0.008; Figure 3A), whereas the AS+MP group showed no significant difference (P = 0.975; Figure 3A). Similarly, the AS+SP+MP group showed no significant increase in body weight compared with the AS group (P = 0.925; Figure 3A). The results suggest that SP promotes weight gain during pediatric asthma modeling and methylprednisolone (MP) treatment in young rats.
Following the OVA challenge, rats in the CN group exhibited no signs of respiratory distress, including shortness of breath, sneezing, head nodding, open-mouth breathing, abdominal muscle contraction, or wheezing. In contrast, rats in the AS group displayed typical manifestations of pediatric asthma, including shortness of breath, sneezing, head nodding, and open-mouth breathing. These clinical signs were markedly alleviated following treatment with SP, MP, or their combined application.
To evaluate the anti-inflammatory effects of SP in young rats with experimental asthma, lung tissues were collected after deep anesthesia with 20% urethane (5 mL/kg, i.p.) according to previously described procedures12. Hematoxylin and eosin (HE) staining and analysis of pro-inflammatory gene expression were performed to assess chronic airway inflammation, whereas Masson staining was used to evaluate airway remodeling. Airway hyperresponsiveness (AHR) was assessed using whole-body plethysmography (WBP) by measuring enhanced pause (Penh).
Following routine HE and Masson staining procedures23, lung sections were stained with hematoxylin and eosin and scored for peribronchiolar inflammation using a modified 0–4 scale24. The asthma model group exhibited significantly higher inflammation scores than the CN group (P = 0.000). Compared with the AS group, the AS+SP, AS+MP, and AS+SP+MP groups all showed significantly reduced inflammation scores (P = 0.005, P = 0.006, and P = 0.000, respectively), with no significant differences among the three treatment groups (Figure 4A, Table 1).
Airway remodeling was evaluated by quantifying collagen deposition around the bronchioles using Masson staining. Collagen deposition was expressed as the collagen-positive area normalized to the basement membrane perimeter (µm2/µm). The AS group exhibited significantly greater collagen deposition than the CN group (P = 0.000). Compared with the CN group, the AS+SP and AS+MP groups showed moderately higher collagen deposition (P = 0.050 and P = 0.051, respectively) but significantly lower collagen deposition than the AS group (P = 0.001 for both comparisons). The AS+SP+MP group showed no significant difference from the CN group (P = 0.105) but exhibited significantly reduced collagen deposition compared with the AS group (P = 0.001). No significant differences were observed among the three intervention groups (Figure 4B, Table 1).
Representative force curves obtained using the Finger TPS system are shown in Figure 5. During operator training, the force curve recorded during back stroking remained stable at approximately 5 N (Figure 5A), whereas the force curve recorded during SP showed repeated force peaks corresponding to the pinching manipulation, with the applied force maintained within the predefined target range (Figure 5B). These force profiles demonstrate the standardized force characteristics used during operator training.
The overall experimental timeline is summarized in Figure 6. Following the 7-day acclimatization period, OVA sensitization was performed according to the specified schedule, followed by repeated OVA challenges. SP was administered to the AS+SP and AS+SP+MP groups during the designated intervention period, while methylprednisolone was administered before OVA challenge in the corresponding treatment groups. WBP assessment and tissue collection were performed after the final challenge (Figure 6).
Whole-body plethysmography is widely used to assess Penh in conscious, unrestrained rodents without causing significant injury or distress25. Although Penh is an indirect indicator influenced by respiratory timing and environmental factors, direct measurement of airway resistance requires anesthesia and tracheostomy, which may alter airway physiology26. Penh has nevertheless been reported to correlate with invasive measurements of lung resistance27. Twenty-four hours after the final OVA challenge, rats were placed in unrestrained chambers and sequentially exposed to aerosolized PBS followed by acetylcholine (Ach) at concentrations of 3.125, 6.25, 12.5, 25, and 50 mg/mL. Each aerosol challenge lasted 2 min and was followed by a 5-min recording period28. The AS group exhibited significantly higher Penh values than the CN group, whereas treatment with SP, MP, or their combined application significantly reduced Penh values (P = 0.005; Figure 3B). This result indicated that SP enhanced respiratory function in asthmatic rats, a finding that still needs further validation, combined with direct airway resistance (Raw) measurements.
Interleukin-4 (IL-4) initiates Th2-mediated eosinophilic inflammation, whereas tumor necrosis factor-α (TNF-α) contributes to AHR and airway remodeling, together playing central roles in the pathogenesis of pediatric asthma29. To further evaluate airway inflammation, the expression levels of IL-4 and TNF-α in lung tissues were quantified by quantitative reverse transcription polymerase chain reaction (qRT-PCR). Compared with the CN group, the AS group showed significantly increased expression of IL-4 and TNF-α (P = 0.000 and P = 0.000, respectively; Figure 3C,D). Expression of both cytokines was significantly reduced following SP or MP treatment, and the combination of SP and MP produced the greatest reduction (P = 0.001 and P = 0.000, respectively; Figure 3C,D).
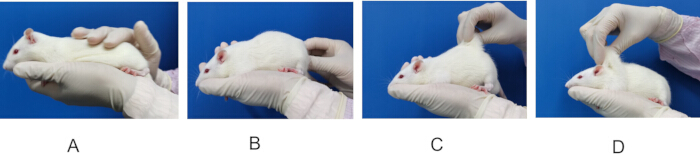
Figure 1: Detailed procedure of spine-pinching manipulation (SP) in rats. (A) Hold the rat in the prone position on the operator's palm. (B) Pinch the skin at the root of the tail. (C) Lift the pinched skin. (D) Twist and advance the fingers cranially along the spine toward Dazhui (GV14). Please click here to view a larger version of this figure.
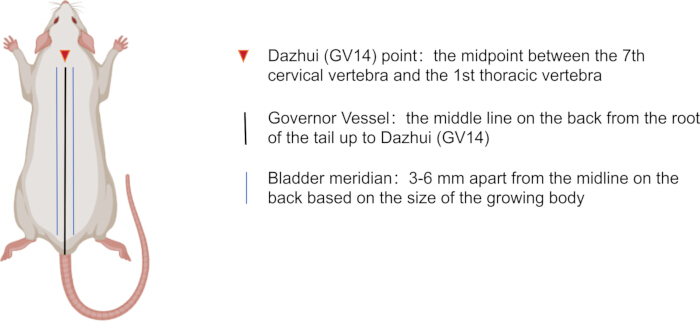
Figure 2: Schematic illustration of the Governor Vessel (GV), Bladder (BL) meridian, and Dazhui (GV14) in rats. The diagram illustrates the anatomical location of the GV, BL meridian, and Dazhui (GV14), which serve as the target sites for spine-pinching manipulation. Please click here to view a larger version of this figure.
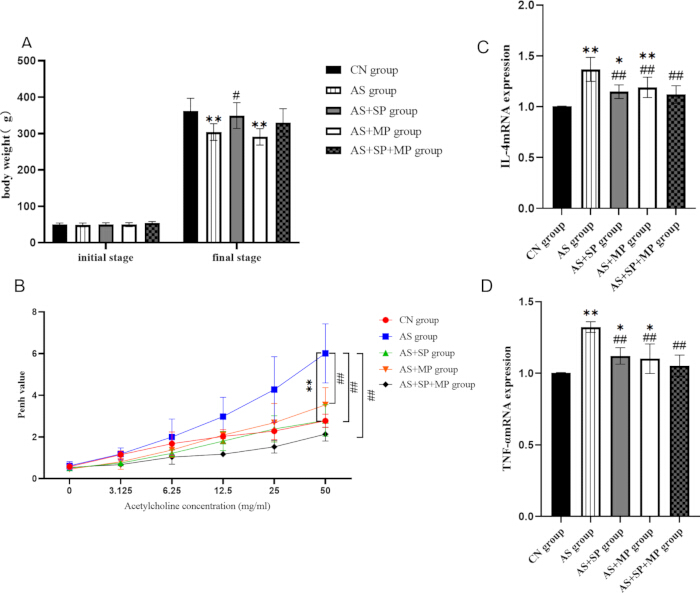
Figure 3: Effects of spine-pinching manipulation on body weight, airway hyperresponsiveness, and pulmonary inflammatory factors in young rats. (A) Comparison of body weight among the experimental groups. (B) Comparison of enhanced pause (Penh) values. (C) Relative gene expression of interleukin-4 (IL-4) in lung tissue. (D) Relative gene expression of tumor necrosis factor-α (TNF-α) in lung tissue. Data are presented as mean ± SD. *P < 0.05 and **P < 0.01 versus the CN group; #P < 0.05 and ##P < 0.01 versus the AS group. Please click here to view a larger version of this figure.
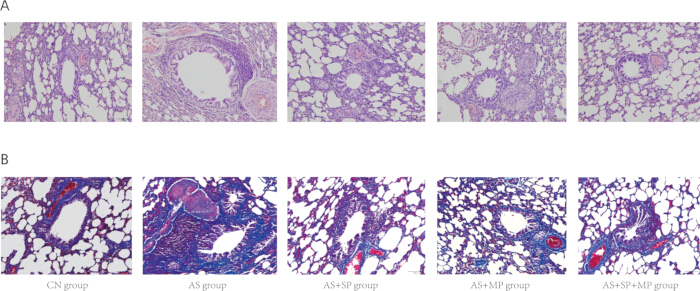
Figure 4: Representative histopathological changes in lung tissue. (A) Hematoxylin and eosin (HE) staining showing peribronchiolar inflammation. (B) Masson trichrome staining showing collagen deposition and airway remodeling. Images were acquired at 200× magnification. Scale bars = 100 µm. Please click here to view a larger version of this figure.
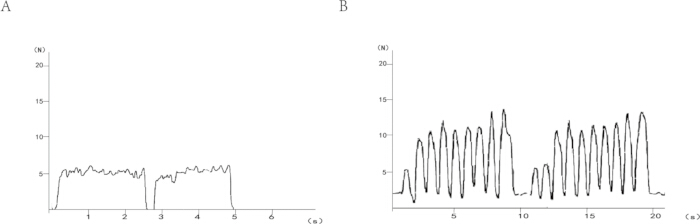
Figure 5: Representative force curves recorded during spine-pinching manipulation using the Finger TPS system. (A) Force curve recorded during back-stroking manipulation. (B) Force curve recorded during spine-pinching manipulation (SP). Please click here to view a larger version of this figure.
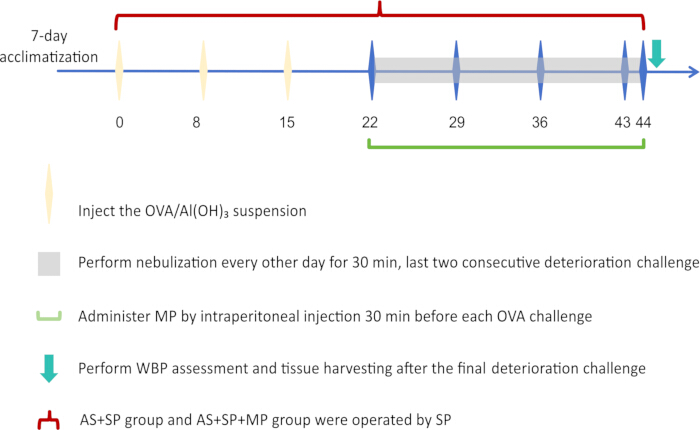
Figure 6: Experimental timeline. Please click here to view a larger version of this figure.
| Group | HE Inflammation Score | Collagen Area/Basement Membrane Perimeter (μm²/μm) |
| CN | 1.10 ± 0.25 | 2.50 ± 0.43 |
| AS | 2.32 ± 0.50** | 4.23 ± 0.53** |
| AS+SP | 1.66 ± 0.27## | 3.12 ± 0.56*## |
| AS+MP | 1.67 ± 0.31## | 3.12 ± 0.50*## |
| AS+SP+MP | 1.34 ± 0.27## | 3.01 ± 0.33## |
Table 1: Lung histopathology scores. Peribronchiolar inflammation was evaluated using HE staining, and airway remodeling was quantified as the collagen-positive area normalized to the basement membrane perimeter (µm2/µm). Data are presented as mean ± SD (n = 5 per group). *P < 0.05 and **P < 0.01 versus the CN group; #P < 0.05 and ##P < 0.01 versus the AS group.
Discussion
Ovalbumin (OVA) sensitization and challenge is one of the most widely used experimental models for studying pediatric asthma30,31. The present study demonstrated that the standardized spine-pinching manipulation (SP) protocol alleviated chronic airway inflammation, airway hyperresponsiveness (AHR), and airway remodeling. Previous clinical studies have shown that traditional pediatric massage, including SP, improves asthma and other allergic diseases in children11,13,32. In addition, previous animal studies have demonstrated that SP attenuated airway inflammation in young rat models of asthma by modulating the gut microbiota12,15. The present study further demonstrated that application of a standardized SP protocol improved chronic airway inflammation, AHR, and airway remodeling in a young rat model of asthma. Furthermore, SP enhanced the therapeutic effects of methylprednisolone (MP) while reducing its growth-retarding side effects.
SP has been practiced in China for more than 1,000 years and remains one of the most widely used pediatric massage techniques for the prevention and treatment of asthma and other childhood diseases12,15,33,34,35. Despite its long history of clinical application, SP remains relatively unfamiliar outside China. According to traditional Chinese medicine theory, the GV and BL meridians run along or adjacent to the spine and communicate with the internal organs. Consequently, stimulation of the GV and BL meridians is believed to regulate visceral function, modulate immune activity, and enhance disease resistance. SP consists of pinching, lifting, twisting, and advancing the skin along the spine, thereby stimulating both the GV and BL meridians. This manipulation simultaneously applies compressive and tensile forces to the skin and underlying fascia, producing moderate mechanical stimulation. In clinical practice, gentle back-stroking manipulation is routinely performed before and after SP to reduce stimulation and improve patient comfort. Back stroking consists of gentle downward stroking along the back and is widely used in pediatric massage. Therefore, based on the principles of clinical relevance, feasibility, simplicity, and reproducibility, the standardized protocol incorporates both SP and back-stroking manipulation.
Previous studies have demonstrated that SP reduces inflammation in both the lungs and the hippocampus through immunomodulatory mechanisms12,36. Pediatric asthma is characterized by Th2-skewed inflammation closely associated with immune dysregulation37. Previous experimental studies reported that hand or brush stroking regulated immune responses in mice when performed at a pressure of 100–150 mmH₂O (7–11 mmHg) and a speed of approximately 3 cm/s38. In addition, a clinical study reported that stroking performed at approximately 1–10 cm/s was perceived as more pleasant39. Based on these findings, the standardized protocol adopted a back-stroking force of 5 ± 0.6 N and a speed of 5 cm/s to achieve an appropriate soothing effect. The pressure, frequency, and number of SP repetitions were determined based on previous studies12,15and related investigations by other research groups40,41. Although previous studies have standardized either manual back-stroking (20 cm/s; approximately 100 mmH₂O) or mechanical GV stimulation (30–50 g; approximately 15.3 cm/s) to achieve cardiovascular inhibition or promote synaptic remodeling in rodents, manual SP represents a distinct biomechanical intervention that relies on tactile and proprioceptive feedback and therefore cannot be fully replicated by existing mechanical devices. This distinction highlights the importance of practitioner-standardized protocols for future translational research on tactile interventions for allergic asthma.
Numerous studies published in Chinese have demonstrated that SP modulates immune function and suppresses inflammation42,43,44. To the best of current knowledge, however, no previous study outside the author’s research group has standardized the pressure and speed of SP for investigating a specific disease in animal models of pediatric asthma. Previous studies investigated the mechanisms underlying SP in young rat models of asthma, including modulation of the gut microbiota, increased production of short-chain fatty acids, enhanced respiratory muscle function (e.g., diaphragm strength), and attenuation of airway inflammation and pulmonary dysfunction11. The present study focused primarily on establishing a standardized protocol rather than comprehensively elucidating the underlying mechanisms of action. A high-precision tactile pressure measurement and recording system was used to standardize the force applied during both back stroking and SP, while the speed and frequency of the manipulations were standardized according to previous studies. Rats were selected because their body size facilitates stable handling and manual application of SP while closely approximating the clinical procedure. Back stroking was performed using the fingers of one hand, as in pediatric clinical practice. Owing to the smaller body size of rats, SP was performed with three fingers of one hand rather than both, while preserving the essential biomechanical characteristics of the clinical technique. This modification closely reproduces stimulation of the GV and BL meridians in the rat model. Because measurement parameters may differ among tactile pressure measurement systems, standardizing manual manipulation based on rats' behavioral responses during back stroking and SP may yield greater reproducibility than relying solely on device-specific force measurements. Previous studies also demonstrated that back stroking exerts antidepressant effects in CUMS-induced young rat9, although SP produced significantly greater therapeutic effects. Consequently, the beneficial effects observed in the present study may partially reflect the contribution of back-stroking manipulation in addition to the primary effects of SP.
Several limitations should be acknowledged. First, the sample size was relatively small, which may limit the robustness and generalizability of the findings. Second, the present study primarily focused on establishing and validating a standardized SP protocol; therefore, it investigated only a limited set of mechanistic outcomes rather than comprehensively delineating the underlying biological mechanisms. Accordingly, mechanistic validation—including BALF inflammatory cell counts, OVA-specific IgE levels, Th2 cytokine profiling (e.g., IL-5, IL-13), and intracellular signaling pathway analysis—was not performed. This result indicated that SP enhanced respiratory function in asthmatic rats, a finding that still needs further validation, combined with direct airway resistance (Raw) measurements. Third, all manipulations were performed by a single trained operator, and reproducibility among different trained operators was not evaluated. Finally, a back-stroking-only intervention group was not included to distinguish the independent effects of back stroking from those of SP. Future studies should include larger sample sizes, evaluate inter-operator reproducibility, incorporate additional control groups, and further investigate the molecular mechanisms underlying the therapeutic effects of SP.
Disclosures
The authors declare that they have nothing to disclose. During the manuscript preparation process, no artificial intelligence tools were used in the preparation of this manuscript. The authors assume full responsibility for the completeness and accuracy of the final manuscript.
Acknowledgements
This work was supported by the National Natural Science Foundation of China (project leader Xiong Ying, No.81973970, relying on Nanjing University of Chinese Medicine). The authors thank the Institute of Pediatrics, Jiangsu Key Laboratory of Children's Health and Chinese Medicine, and Key Laboratory of Acupuncture and Medicine Research of the Ministry of Education for providing venues, instruments, and equipment.
Materials
| Name | Company | Catalog Number | Comments |
|---|---|---|---|
| 4%Al(OH)3 gel | Shanxi ZHHC Biomedical Technology Co., LTD, China | BS010 | N/A |
| Ach(acetylcholine) | Sigma, USA | A2251 | N/A |
| Adhesion microscope slides | Citotest, Jiangsu, China | REF.188105 P/N.80312-3161 | N/A |
| Biohazard waste bags | Nanjing Xinyuan plastic Co., Ltd. | HJ421-2008 | N/A |
| Biological tissue baking machine | Kedee, Zhejiang, China | KD-HII | N/A |
| Biological tissue embedding machine | Kedee, Zhejiang, China | KD-BM | N/A |
| Biological tissue spreading machine | Kedee, Zhejiang, China | KD-PI | N/A |
| Buxco Research Systems | DSI Buxco,Wilmington, NC,USA | PFT | N/A |
| Cdjustable mixer(MX-S) | DLAB, Beijing, China | 8031102000 | N/A |
| Centrifuge for microplate | Scilogex, USA | SCI-CF2800M E050S11B000798 | N/A |
| Clean bench | Sanfa, Shanghai, China | SF-CJ-1A | N/A |
| Conventional centrifuge | DLAB, Beijing, China | D100BE: 9031001011 | N/A |
| Disposable sterile gloves | Shanghai Kebang Medical Latex Equipment Co., Ltd. | 22010739 | https://www.sh-kebang.com/products_detail/6.html |
| Electronic balance | Jinghai, Shanghai | YP3001N | N/A |
| Electronic balance | Jinghai, Shanghai, China | YP3001N | N/A |
| Finger TPS system | Pressure Profile System, Inc, USA | Applicable software version: Chameleon 2018 | https://pressureprofile.com/body-pressure-mapping/finger-tps |
| Fluorescence optical microscope | Olympus, Tokyo, Japan | DP70 | N/A |
| High-pressure steam sterilizer | Tomy, Japan | SX-500 | N/A |
| High-speed freezing centrifuge | Eppendorf | 5418R | N/A |
| Masson trichromatic staining kit | Solarbio, Shanghai, China | G1340 | N/A |
| Micropipettes and sterile tips | eppendorf | J48931L | https://www.eppendorf.com/hk-en/Products/Liquid-Handling/All-Pipettes-Dispensers-Automated-Liquid-Handlers/Eppendorf-Reference2-p-PF-222171 |
| Microtomes | Leica, German | RM2145 | N/A |
| MP(methylprednisolone sodium succinate) | Shyndec, Shanghai, China | H20070007 | N/A |
| NanoDrop Lite spectrophotometer | Thermo Fisher Scientific, USA | nd-ndl-pr-2yrw-ccc | N/A |
| Nebulization controller | Emka, France | VENT4:14554 | N/A |
| Opaque sealed envelopes | Nanjing Kongdu printing Co., Ltd | 201701 | N/A |
| OVA (Grade II) | Sigma, USA | A5253 | N/A |
| OVA (Grade V) | Sigma, USA | A5503 | N/A |
| PCR kit | Yeasen, Shanghai, China | 11201ES08 | N/A |
| Puncture-resistant sharps container | Nanjing Xinyuan plastic Co., Ltd. | KMT-15Y | N/A |
| Reverse transcription kit | Bio.vazyme, Nanjing, China | R323 | N/A |
| Small Centrifuges | Hettich, German | MIKRO 220R D-78532 | N/A |
| Sterile dry cotton balls | ZHENDE, Zhejiang, China | 202203121B | https://www.zhende.com/index.php?g=product&m=index&a=info&id=13 |
| Trizol | Bio.vazyme, Nanjing, China | R771 | N/A |
| Ultra cold storage freezer | Thermo Fisher Scientific, USA | 950GP-ULTS | N/A |
| Ultrasonic Nebulizer | Jiangsu Yuwell Medical Instruments Co., Ltd., China | 402AI | N/A |
| ViiATM7 Real-Time PCR System | Life TechnologiesTM , Singapore | 278882021 | N/A |
| Whole body plethysmograph | Scrieq, Canada | 1185162,1184031,1185898 | FV-FXM1-01,FX1 expiratory cartridge :FV-FXM1 ET,FX1 inspiratory cartridge :FV-FXM1-IA |
References
- Bateman ED, et al. Global strategy for asthma management and prevention: GINA executive summary. Eur Respir J. 2008;31(1):143-178.
- Lizano-Barrantes C, et al. Impact of treatment adherence and inhalation technique on asthma outcomes of pediatric patients: A longitudinal study. Front Pharmacol. 2024;15:1340255.
- Vähätalo I, et al. Long-term adherence to inhaled corticosteroids and asthma control in adult-onset asthma. ERJ Open Res. 2021;7(1).
- Yılmaz İ, et al. Biological therapy management from the initial selection of biologics to switching between biologics in severe asthma. Tuberk Toraks. 2023;71(1):75-93.
- García-Marcos L, et al. Asthma management and control in children, adolescents, and adults in 25 countries: A Global Asthma Network phase I cross-sectional study. Lancet Glob Health. 2023;11(2):e218-e228.
- Kelly HW, et al. Effect of inhaled glucocorticoids in childhood on adult height. N Engl J Med. 2012;367(10):904-912.
- Wu J, Yang XW, Zhang M. Massage therapy in children with asthma: A systematic review and meta-analysis. Evid Based Complement Alternat Med. 2017:5620568.
- Yue QJ, et al. Effect of pediatric massage in the treatment of chronic persistent asthma in children: A systematic review and meta-analysis of randomized controlled trials. J Hainan Med Univ. 2019;25:1260-1266.
- Wu R, et al. Traditional pediatric massage enhanced hippocampal GR, BDNF, and IGF-1 expressions and exerted an antidepressant effect in an adolescent rat model of CUMS-induced depression. Neuroscience. 2024;542:47-58.
- Lin L, Yu L, Zhang S, Liu J. The positive effect of mother-performed infant massage on infantile eczema and maternal mental state: A randomized controlled trial. Front Public Health. 2022;10:1068043.
- Lin L, et al. Traditional pediatric massage enhanced skeletal muscle mass in OVA-exposed adolescent rats via regulating the SCFAs-FFAR2-IGF-1/AKT pathway. Front Microbiol. 2024;15:1492783.
- Xiong Y, Noraas AU, Yang X. The effect of chiropractic manipulation on atopic symptoms and gut microbiota in children with atopy. J Li Shizhen Tradit Chin Med. 2017;28:2440-2442.
- Liu Y, Gu Y, Xiong Y. Wrist-ankle acupuncture combined with spine-pinching manipulation for allergic rhinitis in children: A randomized controlled trial. World J Acupunct Moxibustion. 2019;29:259-263.
- Zhu Y, et al. Chiropractic therapy modulated gut microbiota and attenuated allergic airway inflammation in an immature rat model. Med Sci Monit. 2020;26:e926039.
- Lu W, Fang M, Yang X. Observation on the influence of parent-child massage on children's psychological and behavioral problems. Chin Med Mod Distance Educ China. 2025;23(4):75-78.
- Lund I, Lundeberg T, Kurosawa M, Uvnäs-Moberg K. Sensory stimulation (massage) reduces blood pressure in unanesthetized rats. J Auton Nerv Syst. 1999;78(1):30-37.
- Chen YN, et al. Repetitive unidirectional spinal tactile stimulation engages microglial BMAL1 pathways to promote synaptic remodeling in the medial prefrontal cortex of adolescent VPA-exposed mice. J Neuroinflammation. 2025;23(1):23.
- Gorrell LM, et al. Spinal manipulation characteristics: A scoping literature review of force-time characteristics. Chiropr Man Therap. 2023;31(1):36.
- Papadopoulos NG, Miligkos M, Xepapadaki P. A current perspective of allergic asthma: From mechanisms to management. Handb Exp Pharmacol. 2022;268:69-93.
- Nials AT, Uddin S. Mouse models of allergic asthma: Acute and chronic allergen challenge. Dis Model Mech. 2008;1(4-5):213-220.
- Martin JG, Tamaoka M. Rat models of asthma and chronic obstructive lung disease. Pulm Pharmacol Ther. 2006;19(6):377-385.
- QDV, et al. Construction of an acupoint atlas for experimental rats. Acupunct Res. 2025;50(11):1339-1351.
- Dong L, et al. Hypoxic hUCMSC-derived extracellular vesicles attenuate allergic airway inflammation and airway remodeling in chronic asthma mice. Stem Cell Res Ther. 2021;12(1):4.
- Muhamad SA, et al. Intranasal administration of Lignosus rhinocerotis (Cooke) Ryvarden (Tiger Milk Mushroom) extract attenuates airway inflammation in a murine model of allergic asthma. Exp Ther Med. 2019;17(5):3867-3876.
- Vaickus LJ, Bouchard J, Kim J, Natarajan S. Assessing pulmonary pathology by detailed examination of respiratory function. Am J Pathol. 2010;177(4):1861-1869.
- Glaab T, Taube C, Braun A, Mitzner W. Invasive and noninvasive methods for studying pulmonary function in mice. Respir Res. 2007;8(1):63.
- Lomask M. Further exploration of the Penh parameter. Exp Toxicol Pathol. 2006;57(Suppl 2):13-20.
- Leung SY, et al. Effect of transforming growth factor-beta receptor I kinase inhibitor 2,4-disubstituted pteridine (SD-208) in chronic allergic airway inflammation and remodeling. J Pharmacol Exp Ther. 2006;319(2):586-594.
- Ogulur I, et al. Type 2 immunity in allergic diseases. Cell Mol Immunol. 2025;22(3):211-242.
- Lee JH, Son SH, Kim NJ, Im DS. NJK14047 suppression of the p38 MAPK pathway ameliorates OVA-induced allergic asthma during sensitization and challenge periods. Biomol Ther (Seoul). 2023;31(2):183-192.
- Li J, et al. Establishment of a juvenile mouse asthma model induced by postnatal hyperoxia exposure combined with early OVA sensitization. Heliyon. 2024;10(1):e23291.
- Wei J, Yang X. Efficacy of pediatric tuina on spleen deficiency syndrome and allergic constitution in children with bronchial asthma during the remission period: A study of 29 cases. J Pediatr Tradit Chin Med. 2023;19(3):86-89.
- Gao J, He J. Fifty-eight cases of allergic rhinitis treated with spine-pinching manipulation and acupuncture in Switzerland. World J Acupunct Moxibustion. 2010;20(3).
- Hu Y, et al. Clinical study of Yupingfeng Powder combined with spine-pinching manipulation for cough variant asthma in children. Heilongjiang J Tradit Chin Med. 2024;53(2):369-371.
- Yao D, Zhang Y, Deng L. Effect of spine-pinching manipulation on asthma control in children. Heilongjiang J Tradit Chin Med. 2020;49(2):157-158.
- Zhang X, et al. Traditional pediatric massage exerted an antidepressant effect and activated the IGF-1/NRF2 pathway in CUMS-exposed adolescent rats. J Neuroimmunol. 2025;400:578554.
- Lan J, McCray A, Brown E, Eddens T. Early-life viral infections and asthma: New cells and ideas. Curr Opin Pediatr. 2025;37(6):597-605.
- Major B, et al. Massage-like stroking boosts the immune system in mice. Sci Rep. 2015;5:10913.
- Ackerley R, Carlsson I, Wester H, Olausson H, Backlund Wasling H. Touch perceptions across skin sites: Differences between sensitivity, direction discrimination, and pleasantness. Front Behav Neurosci. 2014;8:54.
- Li Q, et al. Experimental study on the effects of different durations of spine-pinching manipulation on immune function in rats with Wei Qi deficiency. Jiangsu J Tradit Chin Med. 2017;49(9):75-77.
- Tang Q, Shen L, Lin L. Effects of spine-pinching manipulation with different stimulation intensities on hippocampal inflammation-related factors and behavioral disorders in autistic rats. J Hunan Univ Chin Med. 2025;45(7):1264-1270.
- Li Z, et al. Effects of spine-pinching therapy on thoracic duct lymph flow and mesenteric lymphatic microcirculation in rats with spleen deficiency. China J Tradit Chin Med Pharm. 2025;40(8):4246-4250.
- Ma W, et al. Effects of spine-pinching intervention on anorexia in young rats based on the 2-AG/CB1/AMPK1 pathway. Shaanxi J Tradit Chin Med. 2025;46(2):159-164.
- Tang Q, et al. Effects of spine-pinching manipulation on BDNF and CREB protein expression in different brain regions of rats with autism spectrum disorder. J Hunan Univ Chin Med. 2025;45(2):259-266.
Reprints and Permissions
This article has been published
Video Coming Soon