This retrospective study compared tacrolimus plus glucocorticoids versus cyclophosphamide in 112 pediatric lupus nephritis patients. Tacrolimus-based regimen showed higher remission rates, better renal and immune outcomes, and fewer adverse events, supporting its efficacy and safety in this population.
A subscription to JoVE is required to view this content. Sign in or start your free trial.
Research Article
Retrospective Comparative Study of Tacrolimus and Cyclophosphamide Treatment in Pediatric Lupus Nephritis
* These authors contributed equally
In This Article
Summary
Abstract
Lupus nephritis (LN) is a kidney injury caused by systemic lupus erythematosus (SLE) and can lead to serious impairment of renal function. Glucocorticoid (GC) combined with cyclophosphamide (CTX) is currently a commonly used treatment for LN; however, it is associated with several limitations, including a high proportion of refractory cases, a high recurrence rate after remission, and a long treatment cycle. The purpose of this study was to evaluate the safety and efficacy of Tacrolimus (Tac) combined with GC in the treatment of lupus nephritis.
This retrospective cohort study included 112 pediatric LN patients at Inner Mongolia Autonomous Region People's Hospital (January 2022 to June 2025), divided into two groups (n = 56 each): Tac group [Tac + GC] and CTX group (CTX + GC), with a treatment duration of 6 months. Primary endpoints included post-treatment overall response rate, pre/post-treatment renal function, and disease activity scores. Secondary endpoints included immune-inflammatory markers, immune function parameters, anti-dsDNA antibody positivity rate (pre/post-treatment), and adverse reaction incidence.
Baseline characteristics showed no significant difference between the two groups (P > 0.05). Post-treatment, the Tac group had a significantly higher complete remission rate than the CTX group (P < 0.05). Both groups exhibited improved renal function, reduced immune-inflammatory markers, immunoglobulins, and anti-dsDNA positivity (P < 0.05), and increased complement C3 and C4 levels (P < 0.05). The Tac group showed more pronounced improvements and a lower overall adverse reaction incidence (P < 0.05). Tac combined with GC can improve renal function and immune-inflammatory status in children with lupus nephritis, with good safety.
Introduction
Childhood-onset lupus nephritis (CLN) constitutes a serious complication of pediatric systemic lupus erythematosus (SLE), characterized by renal involvement that may lead to chronic kidney disease and renal failure1. The prevalence of renal involvement in children with Childhood Systemic Lupus Erythematosus (cSLE) is as high as 35%–60%1. Compared to adult-onset Lupus Nephritis (LN), CLN typically presents with more severe manifestations and a poorer prognosis2,3. The incidence of cSLE varies between 3.3 and 8.8 per 100,000 pediatric individuals, with higher numbers reported in Asian groups4. Additionally, the prevalence of cSLE in females gradually increases with age, reaching levels comparable to those seen in adults4. LN features a complex pathogenesis, centered on the breakdown of immune tolerance, which leads to excessive activation of B lymphocytes and the production of various autoantibodies, including anti-double-stranded DNA (dsDNA) antibodies5. These autoantibodies form immune complexes by binding to corresponding antigens, which deposit along the glomerular basement membrane. This deposition activates the complement system and inflammatory signaling pathways, triggering mesangial cell proliferation, podocyte injury, and tubulointerstitial inflammation, ultimately resulting in proteinuria and renal impairment6,7,8. Anti-dsDNA antibodies are a serological hallmark of SLE and bears a close association with the onset and progression of LN9. These antibodies bind to DNA to form immune complexes that deposit in the glomeruli, activate the complement system, and cause inflammation and kidney damage5. A study by Wang Xiang et al. indicated that glomerular immune complex deposition acts as a core factor in the pathogenesis of LN, though the prognostic relevance of individual immunoglobulin components remains unclear10. Without standardized treatment, LN may progress to end-stage renal disease (ESRD). Although specific data were not provided, research by Abdulrahman and Sallam emphasized the significance encompassing treatment resistance, recurrent renal flares, as well as progression to ESRD among adolescent and young adult patients with LN11. ESRD necessitates dialysis or kidney transplantation, profoundly impacting patients' growth, development, and socioeconomic well-being.
Currently, the clinical management of CLN primarily relies on glucocorticoids as the cornerstone therapy. Glucocorticoids rapidly suppress acute inflammatory responses by inhibiting phospholipase A2 activity, reducing the release of arachidonic acid metabolites, and consequently diminishing macrophage chemotaxis and neutrophil infiltration12,13. This inhibition alleviates inflammation by decreasing the production of pro-inflammatory mediators such as prostaglandins and leukotrienes14,15,16. However, as children's immune systems and metabolic functions are not fully developed, long-term, high-dose glucocorticoid use can lead to a range of adverse effects. These include growth retardation due to suppressed growth hormone secretion, osteoporosis resulting from bone calcium loss, and an increased risk of respiratory and fungal infections due to immunosuppression. Additionally, glucocorticoids may induce hyperglycemia, hypertension, and peptic ulcers. Prolonged use in children can specifically contribute to osteoporosis12, impacting growth and development. Immunosuppression further elevates the risk of infections17. Metabolic disturbances such as hyperglycemia and hypertension are also potential concerns18. In clinical practice, some pediatric patients are forced to reduce doses or discontinue treatment due to intolerance of these side effects, leading to disease flares. Consequently, identifying highly effective and low-toxicity combination regimens has become a key research direction in CLN management16. Monotherapy with glucocorticoids may not fully control the disease, and sustained application is correlated with substantial untoward effects16. Therefore, combination therapy with other agents with immunosuppressive effects, e.g., Mycophenolate Mofetil, Tacrolimus (Tac), or Cyclophosphamide (CTX), has become a common treatment strategy19,20,21.
As a macrolide immunosuppressant, Tac forms a complex with FKBP12, inhibits calcineurin activity, blocks nuclear factor of activated T cells (NF-AT) dephosphorylation, and thereby suppresses T lymphocyte activation and the release of pro-inflammatory cytokines such as IL-2, IL-6, and TNF-α22,23,24. In adult LN treatment, Tac combined with glucocorticoids has been proved to significantly improve the complete remission rate and reduce the hormone dosage, but the liver metabolic enzyme activity (such as CYP3A4) of children is low, the blood-brain barrier function is not yet perfect, the pharmacokinetic parameters of Tac are different from adults, and the research data on its long-term regulation effect on immune and inflammatory markers in children, its impact on growth and development, and its safety are still scattered25. A 2025 research by Xiaojing Liu et al. examined the use of glucocorticoid in combination with Tac for NELL1-positive idiopathic membranous nephropathy, centering on clinical results, nutritional status and inflammatory reactions26. Because the physiological characteristics of children are different from adults, the metabolism and mechanism of Tac in children may be different, so more research data for children are needed to support its safe and effective application25.
Current studies predominantly focus on adult LN or single-agent efficacy, with a lack of systematic controlled data on tacrolimus combined with glucocorticoids in pediatric populations. In particular, the regulatory effects of this regimen on complement components (C3, C4) and proinflammatory cytokines (IL-6, TNF-α) in children remain unclear. This study is the first to systematically compare tacrolimus versus cyclophosphamide, both combined with glucocorticoids, in a pediatric LN cohort, with a comprehensive assessment of renal outcomes, immune-inflammatory markers, and safety profiles.
Access restricted. Please log in or start a trial to view this content.
Protocol
Ethical approval was obtained from the Institutional Ethics Committee of Inner Mongolia Autonomous Region People's Hospital (approval No.202515810K) prior to data collection. All procedures complied with the National Measures for Ethical Review of Biomedical Research Involving Human Beings and the Declaration of Helsinki26. Anonymized retrospective medical records were used, and all personal information was de-identified to maintain confidentiality.
Inclusion criteria
The inclusion criteria were age ≤ 12 years old; LN diagnosis by renal biopsy and pathological examination according to the International Society of Nephrology/Renal Pathology Society (ISN/RPS) 2003 classification system27; no other treatment history within 30 days before treatment.
Exclusion criteria
Patients were excluded if they had a malignant tumor, respiratory failure, and systemic inflammatory reaction28; gastrointestinal bleeding; hearing and language impairment.
Study subjects
This was a retrospective clinical study. Initially, 133 cases from our hospital were selected between January 2022 and June 2025. All laboratory parameters, including inflammatory cytokines, were extracted from routine clinical records. During the study period, our center performed comprehensive immune-inflammatory monitoring as part of standardized clinical care for pediatric lupus nephritis patients, enabling retrospective collection of these biomarker data. The inclusion and exclusion criteria were applied to screen the cases. Finally, 112 cases were included and divided into the Tac group (n = 56) or the CTX group (n = 56) according to the treatment received during the study period. The two groups were formed based on actual treatment selection in clinical practice, without artificial matching. Both groups were treated with GC. In addition to GC, the Tac group received Tac, and the CTX group received CTX. Pre- and post-treatment data were collected to evaluate the effectiveness of Tac combined with glucocorticoid in treating pediatric LN, as well as its impact on immune-inflammatory markers. The flow chart is depicted in Figure 1.
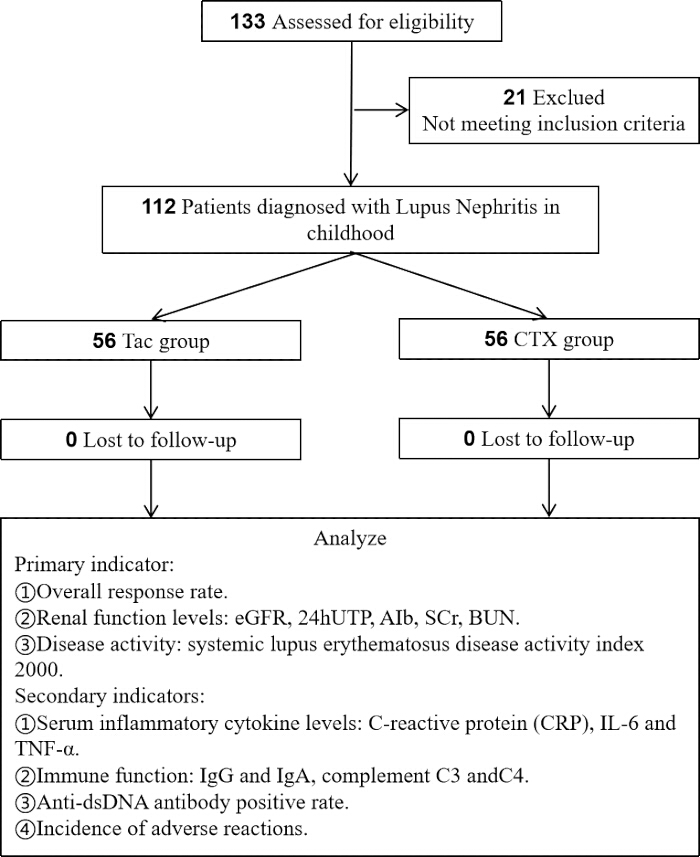
Figure 1. Research flowchart. Please click here to view a larger version of this figure.
Sample size estimation
Since this was a retrospective study, the sample size was determined by the number of eligible cases within the study period. A post hoc power analysis was performed to assess whether the final sample size provided sufficient statistical power29. With an effect size of 0.8, a significance level (α) of 0.05 (two-sided), and a statistical power (1 – β) of 0.95, the calculated minimum required sample size was 35 per group (70 total). The final analysis included 56 patients per group, exceeding the minimum requirement and confirming adequate statistical robustness.
Treatment methods
Common treatment (see Supplemental File 1):
Oral prednisone acetate. was administered to both groups at a starting dose of 60 mg/day, tapered to 15 mg/day by week 12.
Tac Group (Tac+GC):
In addition to glucocorticoids, patients in the Tac group received tacrolimus capsules at an initial dose of 0.1 mg∙kg-1∙day-1, divided into two oral doses. All patients underwent routine therapeutic drug monitoring according to a standardized clinical protocol. Blood trough concentrations were measured on day 7 after the first dose and then every 2–4 weeks thereafter, with a target range of 10 ± 2 µg/L (Note: This upper limit requires close monitoring for nephrotoxicity). Dose adjustments were made by the attending physicians based on these concentrations and were retrospectively extracted from electronic medical records. All included patients had at least one recorded trough concentration within the target range during the treatment period.
CTX Group (CTX+GC):
Cyclophosphamide was administered intravenously at a dose of 1,000 mg/m2 per dose, with body surface area calculated based on standard pediatric formulas using height and weight measurements.
Total treatment duration:
The treatment period for both groups was 180 days, with no interruption unless severe adverse reactions occurred.
Efficacy evaluation
The following criteria were used to define treatment response30,31:
Complete remission (CR): normal renal function. The estimated glomerular filtration rate (eGFR) >90 mL∙min-1∙1.73 m-2, 24h urinary protein (24hUTP) <0.5 g/day, serum creatinine (SCr) and blood urea nitrogen (BUN) returned to the normal range for the same age.
Partial remission (PR): Stable renal function, and 24hUTP decreased by more than 50% relative to baseline. SCr and BUN decreased ≥25% from baseline (or remained normal).
No renal remission (NR): failure to achieve partial or complete remission.
Overall response rate (ORR) = (CR cases + PR cases) / total cases × 100%.
Observation indicators
Main observation indicators
The main indicators were the total remission rate after treatment, estimated glomerular filtration rate (eGFR), and disease activity. The eGFR was obtained from laboratory reports, which were calculated using the updated Schwartz formula validated for pediatric populations; 24 h urinary protein quantification (24hUTP), detected by routine microscopy and the 24 h urine protein quantification method; plasma albumin (Alb) concentration, measured by routine venous blood testing; serum creatinine (SCr) concentration, measured using the immunoturbidimetry method on a automatic biochemical analyzer; blood urea nitrogen (BUN) concentration, measured by routine venous blood testing32. Disease activity was assessed using the Systemic Lupus Erythematosus Disease Activity Index 2000 (SLEDAI-2000)30, which includes 24 clinical indicators such as fever, rash, and proteinuria. The total score ranges from 0 to 105. A higher score indicates a higher level of disease activity.
Secondary observation indicators
Secondary observation indicators included immune-inflammatory biomarkers, immune function comparisons, and the anti-dsDNA antibody levels (%)28. The following immune-inflammatory biomarkers were retrospectively collected: C-reactive protein (CRP) level, detected using the immunoturbidimetric method on a fully automated chemiluminescence analyzer; Interleukin-6 (IL-6) and Tumor Necrosis Factor-α (TNF-α) levels: Data were obtained from routine clinical testing performed during the treatment period using the Enzyme-Linked Immunosorbent Assay (ELISA) method. Detection was performed using commercial ELISA kits28. Immune function comparisons included immunoglobulins: IgG and IgA; C3 and C430.
Safety indicators
Adverse events (AEs) were retrospectively collected from electronic medical records and patient self-reports throughout the treatment period. The following prespecified categories of AEs were assessed: gastrointestinal reactions (including nausea, vomiting, and diarrhea), infections (documented by clinical symptoms, laboratory findings, or pathogen identification), hyperglycemia (fasting blood glucose ≥ 7.0 mmol/L or random blood glucose ≥ 11.1 mmol/L), leukopenia (white blood cell count < 4.0 × 10⁹/L), and elevated liver enzymes (alanine aminotransferase or aspartate aminotransferase > 2.5× the upper limit of normal). All AEs were graded for severity according to the Medical Dictionary for Regulatory Activities (MedDRA)33 terminology. The incidence of AEs was compared between the two groups. In addition, vital signs and routine laboratory parameters (including blood routine, urine routine, liver and kidney function, and electrocardiogram) were monitored as part of standard clinical care.
Statistical analysis
For measurement data—such as age, duration of disease, IL-6, and TNF-α levels—the Kolmogorov-Smirnov test was first applied to assess normality. If the data conformed to a normal distribution, it was expressed as the mean ± standard deviation. The independent samples t-test was used for comparisons between groups, and the paired t.-test was employed for within-group comparisons before and after treatment. For categorical data, such as sex, it was presented as frequency (percentage) [n (%)] and the chi-square (χ2) test was used for intergroup comparisons. A difference was considered statistically significant when P < 0.05.
Access restricted. Please log in or start a trial to view this content.
Results
Baseline characteristics of the study population
Baseline characteristics of the Tac group (n = 56) and CTX group (n = 56) are compared in Table 1. There was no significant difference in sex, age, age of onset, SLEDAI-2000 score, duration of disease, organ damage, clinical classification and pathological classification between the two groups (P > 0.05), indicating that the two groups had balanced baseline and good comparability.
Access restricted. Please log in or start a trial to view this content.
Discussion
This study found that the Tac group’s complete remission rate of 69.6% and total remission rate of 94.6% were significantly higher than those in the CTX group, and this outcome is broadly comparable to findings from recent research in adult LN. Amudalapalli et al.32 confirmed in a randomized controlled trial published in 2025 that Tac as an induction therapy can achieve a complete remission rate of 65%-70% in adult LN, and the onset time is ~4–6 weeks shorter than that of traditional i...
Access restricted. Please log in or start a trial to view this content.
Disclosures
The authors have no conflicts of interest to declare.
Materials
| Name | Company | Catalog Number | Comments |
|---|---|---|---|
| Automatic biochemical analyzer | Hitachi | 7600-020 | |
| Automatic blood cell analyzer | Beckman coulter | DxH 800 | |
| Automatic urine analyzer | Roche | cobas 6800 | |
| Electrocardiograph | Mindray | iMEC 12 | |
| Electronic sphygmomanometer | OMRON | HEM-907 | |
| G*Power software | Heinrich-Heine-Universität Düsseldorf | Version 3.1 | RRID:SCR_013726 |
| Ifosfamide | Qilu Pharmaceutical (Hainan) Co., Ltd | 86905847000094 | |
| Medical Dictionary for Regulatory Activities (MedDRA, version 26.0 | RRID:SCR_003751 | ||
| microscope | Olympus | CX23 | |
| Prednisone Acetate Tablets | Jichuan Pharmaceutical Group Co., Ltd | 86901453001371 | |
| SPSS 25.0 statistical software | IBM | Version 25.0 | RRID:SCR_002865 |
| Tacrolimus Capsules | Sinopharm Chuankang Pharmaceutical Co., Ltd | 86902014000215 |
References
- Chan, E. Y. -h, et al. Managing lupus nephritis in children and adolescents. Pediatr Drugs. 26 (2), 145-161 (2023).
- Renson, T., Lightstone, L., Ciurtin, C., Gaymer, C., Marks, S. D. The unique challenges of childhood-onset systemic lupus erythematosus and lupus nephritis patients: a proposed framework for an individualized transitional care plan. Pediatr Nephrol. 40 (10), 3045-3053 (2025).
- Asis, C. M. L., Tee, C. A., Resontoc, L. P. R. Prognostic factors for disease progression and mortality of childhood-onset lupus nephritis in the Philippines: a retrospective cohort study in a tertiary hospital. Pediatr Rheumatol. 23 (1), 86(2025).
- Das, J., et al. Clinicopathological, immunological, and laboratory parameters of childhood lupus nephritis: a study from Northeast India. J Lab Physicians. 15 (3), 361-364 (2023).
- Spencer, J., Jain, S. Could tolerance to DNA be broken in the gut in systemic lupus erythematosus. Immunol Lett. 270, 106937(2024).
- Fu, S. M., Sung, S. -S. J., Wang, H., Zhao, Z., Gaskin, F. Mechanisms of renal damage in systemic lupus erythematosus. Syst Lupus Erythematosus. , 313-324 (2021).
- Fu, R., et al. Podocyte activation of NLRP3 inflammasomes contributes to the development of proteinuria in lupus nephritis. Arthritis Rheumatol. 69 (8), 1636-1646 (2017).
- Masum, M. A., et al. Vasculature-associated lymphoid tissue: a unique tertiary lymphoid tissue correlates with renal lesions in lupus nephritis mouse model. Front Immunol. 11, 595672(2020).
- González Rodríguez, C., Aparicio Hernández, M. B., Alarcón Torres, I. Update and clinical management of anti-DNA auto-antibodies. Adv Lab Med. 2 (3), 313-321 (2021).
- Xiang, W., et al. Significant glomerular IgM deposition predicts poorer kidney outcomes in lupus nephritis compared with other forms of immune complex deposits. Lupus Sci Med. 12 (2), e001708(2025).
- Abdulrahman, M. A., Sallam, D. E. Treatment response and progression to end stage renal disease in adolescents and young adults with lupus nephritis: a follow up study in an Egyptian cohort. Egypt Rheumatol. 42 (3), 189-193 (2020).
- Deng, J., Chalhoub, N. E., Sherwin, C. M., Li, C., Brunner, H. I. Glucocorticoids pharmacology and their application in the treatment of childhood-onset systemic lupus erythematosus. Semin Arthritis Rheum. 49 (2), 251-259 (2019).
- Russo-Marie, F. Macrophages and the glucocorticoids. J Neuroimmunol. 40, 281-286 (1992).
- Mukhopadhyay, N., Shukla, A., Makhal, P. N., Kaki, V. R. Natural product-driven dual COX-LOX inhibitors: overview of recent studies on the development of novel anti-inflammatory agents. Heliyon. 9 (3), e14569(2023).
- Wajda, J., et al. Potential prognostic markers of acute kidney injury in the early phase of acute pancreatitis. Int J Mol Sci. 20 (15), 3714(2019).
- Mejía-Vilet, J. M., Ayoub, I. The use of glucocorticoids in lupus nephritis: new pathways for an old drug. Front Med. 8, 622225(2021).
- Gülsen, A., Wedi, B., Jappe, U. Hypersensitivity reactions to biologics (part II): classifications and current diagnostic and treatment approaches. Allergo J Int. 29 (5), 139-154 (2020).
- Nikolaidou, A., Beis, I., Dragoumi, P., Zafeiriou, D. Neuropsychiatric manifestations associated with juvenile systemic lupus erythematosus: an overview focusing on early diagnosis. Brain Dev. 46 (3), 125-134 (2024).
- Zhang, L., et al. Optimal exposure of mycophenolic acid for induction therapy of childhood lupus nephritis patients: an observational cohort study. Rheumatology. 63 (S12), SI180-SI187 (2024).
- Tanaka, H., et al. Long-term tacrolimus-based immunosuppressive treatment for young patients with lupus nephritis: a prospective study in daily clinical practice. Nephron Clin Pract. 121 (3-4), c165-173 (2013).
- Sakai, R., et al. Efficacy and safety of multitarget therapy with cyclophosphamide and tacrolimus for lupus nephritis: a prospective, single-arm, single-centre, open label pilot study in Japan. Lupus. 27 (2), 273-282 (2017).
- Letko, E., Bhol, K., Pinar, V., Foster, C. S., Ahmed, A. R. Tacrolimus (FK 506). Ann Allergy Asthma Immunol. 83 (3), 179-190 (1999).
- Vierling, J. M., Flores, P. A. Evolving new therapies of autoimmune hepatitis. Clin Liver Dis. 6 (3), 825-850 (2002).
- Elalouf, A. Infections after organ transplantation and immune response. Transpl Immunol. 77, 101798(2023).
- Kise, T., Yoshimura, H., Fukuyama, S., Uehara, M. Successful treatment with mycophenolate mofetil and tacrolimus in juvenile severe lupus nephritis. Case Rep Pediatr. 2015, 1-4 (2015).
- Wen, B., Zhang, G., Zhan, C., Chen, C., Yi, H. The 2024 revision of the Declaration of Helsinki: a modern ethical framework for medical research. Postgrad Med J. 101 (1194), 371-382 (2025).
- Hochberg, M. C. Updating the American College of Rheumatology revised criteria for the classification of systemic lupus erythematosus. Arthritis Rheum. 40 (9), 1725(1997).
- Li, L., Du, Y., Ji, J., Gao, Y., Shi, X. Q. Analysis of the safety and efficacy of tacrolimus combined with glucocorticoid in the treatment of lupus nephritis. Pak J Med Sci. 38 (5), 1285-1291 (2022).
- Kim, N., Fischer, A. H., Dyring-Andersen, B., Rosner, B., Okoye, G. A. Research techniques made simple: choosing appropriate statistical methods for clinical research. J Invest Dermatol. 137 (10), e173-e178 (2017).
- Li, H., Chen, C., Yang, H., Tu, J. Efficacy and safety of belimumab combined with the standard regimen in treating children with lupus nephritis. Eur J Pediatr. 183 (9), 3987-3995 (2024).
- Sammaritano, L. R., et al. 2024 American College of Rheumatology guideline for the screening, treatment, and management of lupus nephritis. Arthritis Rheumatol. 77 (9), 1115-1135 (2025).
- Amudalapalli, A., et al. Comparative efficacy of intravenous cyclophosphamide, mycophenolate mofetil, and tacrolimus as induction therapy for lupus nephritis: a randomized controlled open-label trial. Lupus. 34 (12), 1211-1220 (2025).
- Wang, C., Zhang, Y., Tang, X., Zhang, G., Chen, L. Signal detection and analysis of adverse events associated with Genvoya based the FAERS database. Front Pharmacol. 15, 1439781(2024).
- Pandurangan, A. K. Targeting IL-17A: a new frontier in the treatment of colitis-associated cancer. Curr Cancer Res. 1 (1), 16-25 (2025).
Access restricted. Please log in or start a trial to view this content.