In a mouse model of ulcerative colitis, five-flavor Sophora flavescens enteric-coated capsules alleviated colonic injury and improved oxidative stress, inflammatory cytokine imbalance, JAK2/STAT3 signaling, and changes in ferroptosis-related markers.
Research Article
Five-flavor Sophora flavescens Enteric-coated Capsules Alleviate Experimental Colitis and Ferroptosis-related Changes
1Department of Gastroenterology and Hepatology, Jiangxi Provincial People's Hospital, The First Affiliated Hospital of Nanchang Medical College, 2Department of Integrated Traditional Chinese and Western Medicine, Jiangxi Provincial People's Hospital, The First Affiliated Hospital of Nanchang Medical College, 3Department of Gastroenterology and Hepatology, Pengze County People's Hospital, 4Department of Gastroenterology and Hepatology, General Hospital of Pingxiang Mining Group Company, 5Department of Rehabilitation Medicine, Jiangxi Provincial People's Hospital, The First Affiliated Hospital of Nanchang Medical College
Opens in a new tab
In This Article
Summary
Loading...
$$\rightleftharpoonup{xx}$$
$$\longleftharp{xx}$$,
$$\longrightharp{xx}$$,
Abstract
Loading...
$$\rightleftharpoonup{xx}$$
$$\longleftharp{xx}$$,
$$\longrightharp{xx}$$,
Ulcerative colitis remains difficult to manage because effective and targeted therapeutic options are limited, and oxidative stress, inflammatory signaling, and regulated cell-death pathways may contribute to mucosal injury. This study evaluated whether five-flavor Sophora flavescens enteric-coated capsules (FSEC) alleviate experimental colitis and explored associated changes in oxidative stress, inflammation, and markers of ferroptosis. A mouse model of ulcerative colitis was established using cyclic exposure to 2.5% dextran sulfate sodium, combined with tumor necrosis factor alpha challenge. Mice were treated with low-, medium-, or high-dose FSEC or with the TLR4 antagonist CRX-526 as a positive-control intervention. Colon histopathology was assessed by hematoxylin and eosin staining. Serum superoxide dismutase, catalase, glutathione, myeloperoxidase, and Fe2⁺ levels were measured using biochemical assays. Colon tissue cytokines were quantified by enzyme-linked immunosorbent assay, JAK2 and STAT3 expression were evaluated by immunohistochemistry, and GPX4, FTH1, and ACSL4 expression were analyzed by western blotting. FSEC treatment reduced colonic mucosal injury and inflammatory-cell infiltration, increased antioxidant indices, and decreased myeloperoxidase levels. FSEC also reduced TNF-α and IL-1α levels, partially restored IL-13 levels, and was associated with weaker JAK2 and STAT3 immunostaining. In parallel, FSEC improved ferroptosis-related marker changes, including reduced Fe2⁺ and ACSL4 levels and increased GPX4 and FTH1 expression. These findings suggest that FSEC alleviates experimental ulcerative colitis in mice, at least in part by improving oxidative-stress status, moderating inflammatory signaling, and restoring ferroptosis-related marker profiles.
Introduction
Loading...
$$\rightleftharpoonup{xx}$$
$$\longleftharp{xx}$$,
$$\longrightharp{xx}$$,
Ulcerative colitis (UC) is a chronic inflammatory disorder that primarily affects the colonic and rectal mucosa and is characterized by recurrent episodes of mucosal inflammation, ulceration, and impaired barrier function1,2,3. Although genetic susceptibility, environmental factors, epithelial barrier dysfunction, and immune dysregulation have been implicated in UC pathogenesis, the mechanisms underlying persistent mucosal injury remain incompletely understood. Current pharmacological treatments, including aminosalicylates, corticosteroids, immunosuppressants, and biologic agents, can reduce disease activity in many patients; however, their clinical use may be limited by relapse after treatment discontinuation, adverse effects, high cost, and incomplete therapeutic responses3.
Ferroptosis, an iron-dependent form of regulated cell death characterized by lipid peroxidation and altered iron metabolism, has increasingly been implicated in intestinal inflammation and UC-associated epithelial injury4,5,6,7,8. In parallel, traditional Chinese medicine formulations have attracted increasing attention as complementary approaches for UC treatment because of their multi-target therapeutic potential9.
Five-flavor Sophora flavescens enteric-coated capsules (FSEC) are used clinically for the treatment of mild to moderate active UC in traditional Chinese medicine practice. Previous studies suggest that FSEC may improve UC symptoms through multi-component and multi-target mechanisms10. However, the effects of FSEC on oxidative stress, inflammatory signaling, JAK2/STAT3 activity, and ferroptosis-related changes in experimental UC remain insufficiently characterized.
Oxidative stress and inflammatory signaling are important contributors to intestinal mucosal injury in UC. Excessive production of reactive oxygen species can disrupt epithelial integrity, promote inflammatory-cell infiltration, and impair antioxidant defense systems. Cytokine-mediated pathways such as JAK2/STAT3 signaling contribute to inflammatory amplification and tissue injury11,12,13,14,15. In addition, oxidative stress and ferroptosis are closely linked through alterations in antioxidant defenses, iron metabolism, and lipid peroxidation16,17,18,19,20. Therefore, simultaneous evaluation of oxidative-stress indices, inflammatory cytokines, JAK2/STAT3 signaling, and ferroptosis-related markers may provide a more comprehensive understanding of mucosal injury and therapeutic responses in experimental UC.
In the present study, a cyclic dextran sulfate sodium and tumor necrosis factor alpha–challenged mouse model was used to evaluate the effects of low-, medium-, and high-dose FSEC. A key methodological strength of this design is the integration of histopathological assessment with measurements of serum oxidative-stress indices, colon tissue cytokines, JAK2/STAT3 immunohistochemistry, and western blot analysis of ferroptosis-related proteins within a single experimental framework. This approach was used to determine whether FSEC alleviates experimental UC and to characterize associated changes in oxidative stress, inflammatory signaling, and ferroptosis-related marker profiles. The overall experimental design and analytical workflow are summarized in Figure 1.
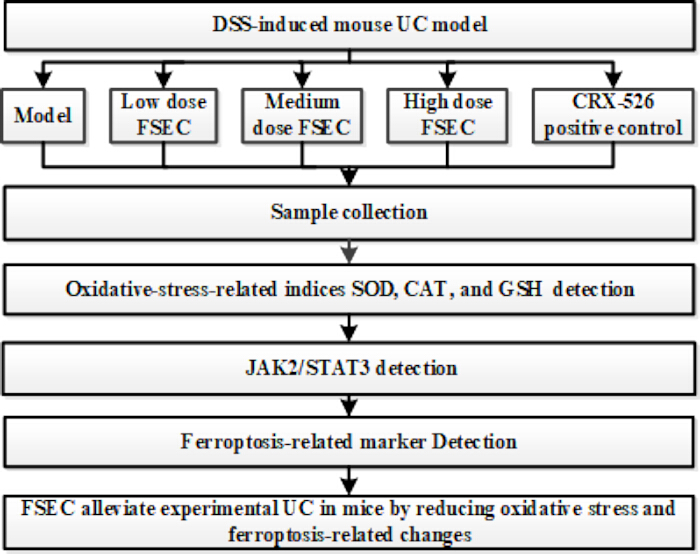
Figure 1: Experimental workflow of the mouse model and downstream analyses. Chronic experimental ulcerative colitis was induced by cyclic exposure to 2.5% dextran sulfate sodium (DSS) combined with tumor necrosis factor alpha (TNF-α) challenge during the final week of the experimental protocol. Mice were assigned to normal control, model, low-dose FSEC, medium-dose FSEC, high-dose FSEC, and CRX-526 positive-control groups. FSEC was administered by intragastric gavage at doses of 108, 216, or 432 mg/kg body weight. CRX-526 was used as the positive-control intervention. Following the final treatment, samples were collected for histopathological evaluation, oxidative-stress-related biochemical assays, cytokine analysis by ELISA, immunohistochemistry, and western blot analysis. Please click here to view a larger version of this figure.
Protocol
Loading...
$$\rightleftharpoonup{xx}$$
$$\longleftharp{xx}$$,
$$\longrightharp{xx}$$,
All animal procedures were reviewed and approved by the Animal Welfare and Ethics Committee of Nanchang Medical College (approval no. NY2SC 20250407). All experiments were conducted in accordance with institutional guidelines for the care and use of laboratory animals. The chemicals, reagents, and equipment are listed in the Table of Materials.
1. Animals and treatment
Male C57BL/6J mice (wild-type, 8 weeks old) were used in this study. Animals were housed under standard laboratory conditions with controlled temperature and humidity and were provided free access to food and water. Following acclimatization, chronic colitis was induced by administering three cycles of 2.5% dextran sulfate sodium (DSS) in the drinking water. Each cycle lasted 1 week and was separated by a 2-week recovery period with regular drinking water. During the final week of the experimental protocol, mice in the model and treatment groups received tumor necrosis factor alpha (TNF-α; 10 µg/100 g body weight, twice daily) by intragastric gavage to further aggravate colonic injury. Normal control mice received vehicle only and were not exposed to DSS or TNF-α.
Five-flavor Sophora flavescens enteric-coated capsules (FSEC) were used as a commercially available, approved Chinese patent medicine. The formulation contained Sophora flavescens Aiton, Sanguisorba officinalis L., Indigo naturalis, Bletilla striata (Thunb.) Rchb.f., and Glycyrrhiza uralensis Fisch. ex DC. Capsule contents from the same production batch were weighed and suspended in sterile distilled water to prepare fresh dosing suspensions before administration. Suspensions were mixed thoroughly before each gavage to ensure uniform dispersion. Product source, approval number, pharmaceutical specifications, and quality-control information are provided in the Table of Materials. Product quality was described in accordance with the approved pharmaceutical specification and manufacturer-provided information, including capsule specifications, appearance, enteric-release and disintegration requirements, microbial limit requirements, and quality-control standards.
FSEC-treated mice received low-dose FSEC (108 mg/kg body weight), medium-dose FSEC (216 mg/kg body weight), or high-dose FSEC (432 mg/kg body weight) by intragastric gavage twice daily during the final week of modeling. Dose levels were selected based on the approved clinical dose, body-surface-area conversion, and preliminary dose-ranging considerations. Vehicle-treated mice received the same volume of sterile distilled water by intragastric gavage.
The positive-control group received the TLR4 antagonist CRX-526 at 1 mg/kg via tail vein injection during the final week of modeling. CRX-526 was used as a reference anti-inflammatory intervention. The study included six groups (n = 6 per group): normal control, model, low-dose FSEC, medium-dose FSEC, high-dose FSEC, and CRX-526 positive-control groups. The mice were sacrificed 24 h after the last study treatment. Euthanasia was performed by cervical dislocation under isoflurane anesthesia, in accordance with the institutional guidelines for the care and use of laboratory animals.
2. Histological evaluation by hematoxylin and eosin staining
Colon tissues were collected from the macroscopically most affected region between the anus and the ileocecal area. For each mouse, one representative colon segment from this region was fixed in 10% neutral buffered formalin, embedded in paraffin, sectioned, and stained with hematoxylin and eosin. For histological evaluation, at least three sections were prepared from each animal, and five non-overlapping high-power fields were examined per section. Fields were selected systematically at random by scanning the section from one edge to the other, avoiding torn, folded, or poorly stained areas. Histopathological changes, including mucosal ulceration, glandular destruction, congestion, and inflammatory-cell infiltration, were evaluated under light microscopy.
3. Measurement of oxidative-stress-related biochemical indicators
Blood samples (0.5 mL) were collected into anticoagulant-containing tubes and centrifuged at approximately 1160 × g for 10 min at 4 °C. The supernatant was collected and used to measure serum iron, superoxide dismutase (SOD), glutathione (GSH), catalase (CAT), and myeloperoxidase (MPO) levels using the corresponding assay kits listed in the Table of Materials according to the manufacturers' instructions.
4. Immunohistochemical analysis of JAK2 and STAT3
Paraffin-embedded colon tissue sections (5 µm) were deparaffinized in xylene, rehydrated through a graded ethanol series, and rinsed with phosphate-buffered saline. Antigen retrieval was performed in citrate buffer (pH 6.0) using microwave heating. After cooling to room temperature, endogenous peroxidase activity was blocked with 3% H₂O₂ for 10 min. Sections were blocked with 5% normal goat serum for 30 min at room temperature and incubated overnight at 4 °C with primary antibodies against JAK2 and STAT3 at dilutions of 1:50 and 1:80, respectively. Following phosphate-buffered saline washes, sections were incubated with a horseradish peroxidase-conjugated secondary antibody according to the manufacturer's instructions. Immunoreactive signals were visualized using 3,3′-diaminobenzidine, and nuclei were counterstained with hematoxylin. Sections were dehydrated, mounted, and examined under a light microscope.
5. Cytokine quantification by enzyme-linked immunosorbent assay
Colon tissues were cut into 2–3 mm3 pieces, homogenized on ice in phosphate-buffered saline, and centrifuged at 12,000 × g for 15 min at 4 °C. The supernatant was collected, and concentrations of TNF-α, IL-1α, and IL-13 were measured using the corresponding ELISA kits according to the manufacturers' instructions. Absorbance values were measured using a microplate reader, and cytokine concentrations were calculated from standard curves generated for each assay.
6. Western blot analysis of ferroptosis-related proteins
Total proteins were extracted from colon tissues, and protein concentrations were determined using a bicinchoninic acid assay. Equal amounts of protein from each sample were separated by SDS-PAGE and transferred onto membranes. After blocking with 5% non-fat milk or an equivalent blocking buffer for 2 h at room temperature, membranes were incubated overnight at 4 °C with primary antibodies against GPX4, FTH1, ACSL4, and the loading-control protein β-actin, as listed in the Table of Materials. On the following day, membranes were washed and incubated with the corresponding horseradish peroxidase-conjugated secondary antibody for 2 h at room temperature. Protein bands were visualized using a chemiluminescent substrate and imaged using a chemiluminescence imaging system. Band intensities were quantified using densitometry software. Expression levels of GPX4, FTH1, and ACSL4 were normalized to β-actin, and relative protein expression was calculated for statistical analysis.
7. Statistical analysis
Data are presented as mean ± standard deviation (SD). Comparisons among multiple groups were performed using one-way analysis of variance, followed by Bonferroni's post hoc test when the assumptions of normality and homogeneity of variance were met. A value of P < 0.05 was considered statistically significant.
Results
Loading...
$$\rightleftharpoonup{xx}$$
$$\longleftharp{xx}$$,
$$\longrightharp{xx}$$,
FSEC alleviates histopathological injury and improves oxidative-stress-related indices in mice with ulcerative colitis
As shown in Figure 2, the normal control group exhibited intact colonic mucosal architecture, with well-organized glands and minimal inflammatory cell infiltration. In contrast, the model group displayed severe mucosal injury characterized by epithelial disruption, mucosal ulceration, glandular destruction, congestion, and marked inflammatory-cell infiltration. Compared with the model group, mice treated with high-, medium-, or low-dose FSEC showed reduced histopathological damage, including less mucosal destruction and inflammatory-cell infiltration. The most pronounced histological improvement was observed in the high-dose and medium-dose FSEC groups and in the CRX-526 positive-control group.
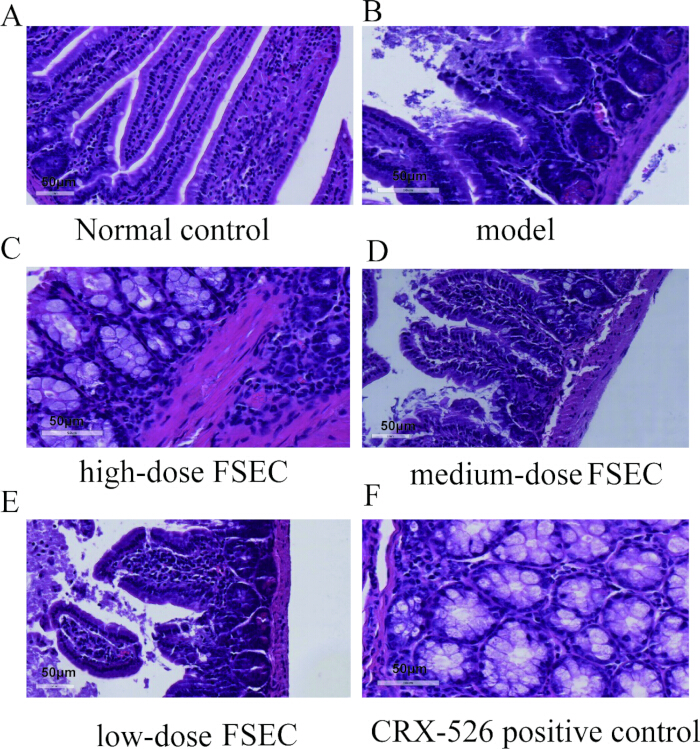
Figure 2: Histopathological changes in colon tissues from mice with experimental ulcerative colitis. Representative hematoxylin and eosin-stained colon sections are shown for the following groups: (A) normal control, (B) model, (C) high-dose FSEC, (D) medium-dose FSEC, (E) low-dose FSEC, and (F) CRX-526 positive control. The model group exhibited marked mucosal disruption, glandular destruction, congestion, and inflammatory-cell infiltration, whereas reduced histopathological injury was observed in the FSEC-treated and CRX-526-treated groups. Magnification, ×400. Scale bar = 50 µm. Please click here to view a larger version of this figure.
Oxidative-stress-related indices were subsequently evaluated (Table 1). Compared with the normal control group, the model group exhibited significantly lower serum SOD, CAT, and GSH levels and significantly higher MPO levels (P < 0.01), indicating impaired antioxidant defenses and increased inflammatory oxidative activity. Relative to the model group, FSEC treatment increased SOD, CAT, and GSH levels while decreasing MPO levels, with the greatest changes observed in the high-dose FSEC group. These findings are consistent with improvement in oxidative-stress-related biochemical alterations in experimental UC.
| Group | SOD (U/mL) | GSH (mg/L) | CAT (U/mL) | MPO (U/L) |
| Normal control | 252.06 ± 22.36 | 30.07 ± 1.01 | 10.05 ± 2.01 | 180.05 ± 22.01 |
| Model | 149.07 ± 29.38** | 15.85 ± 5.01** | 5.84 ± 0.91** | 382.65 ± 32.81** |
| High-dose FSEC | 190.76 ± 32.17**,## | 20.11 ± 3.22**,## | 7.86 ± 1.84**,## | 202.65 ± 30.65## |
| Medium-dose FSEC | 161.53 ± 16.27** | 16.83 ± 3.01** | 7.25 ± 1.12**,## | 262.65 ± 35.62**,## |
| Low-dose FSEC | 151.31 ± 28.21** | 16.52 ± 2.72** | 5.45 ± 1.34** | 302.15 ± 45.71**,## |
| CRX-526 positive control | 192.69 ± 30.19**,## | 20.13 ± 3.02**,## | 7.17 ± 1.74**,## | 198.95 ± 30.27## |
| Data are presented as mean ± SD (n = 6 per group). SOD, superoxide dismutase; GSH, glutathione; CAT, catalase; MPO, myeloperoxidase; FSEC, five-flavor Sophora flavescens enteric-coated capsules. Statistical comparisons were performed using one-way ANOVA followed by Bonferroni’s post-hoc test. **P < 0.01 versus the normal control group; ##P < 0.01 versus the model group. | ||||
Table 1: Comparison of serum oxidative-stress-related indices among groups. Serum superoxide dismutase (SOD), glutathione (GSH), catalase (CAT), and myeloperoxidase (MPO) levels were measured in normal control, model, FSEC-treated, and CRX-526-treated mice. Data are presented as mean ± SD.
FSEC modulates inflammatory cytokines and reduces JAK2/STAT3 immunostaining in mice with ulcerative colitis
Inflammatory cytokine levels were measured in colon tissues (Table 2). Compared with the normal control group, the model group exhibited increased TNF-α and IL-1α levels and decreased IL-13 levels, indicating disruption of cytokine homeostasis following UC induction. Compared with the model group, FSEC treatment reduced TNF-α and IL-1α levels, whereas IL-13 levels were partially restored. The high-dose FSEC group and the CRX-526 positive-control group exhibited the most apparent improvements in cytokine profiles.
| Group | TNF-α (pg/mL) | IL-1α (pg/mL) | IL-13 (pg/mL) |
| Normal control | 31.304 ± 7.301 | 51.705 ± 6.802 | 122.035 ± 15.401 |
| Model | 311.721 ± 50.103** | 263.337 ± 30.103** | 92.535 ± 16.511** |
| High-dose FSEC | 148.429 ± 17.711##,†† | 149.253 ± 16.241##,†† | 105.201 ± 5.205##,†† |
| Medium-dose FSEC | 190.239 ± 26.151## | 162.721 ± 15.281## | 102.215 ± 5.721## |
| Low-dose FSEC | 281.290 ± 6.310## | 167.350 ± 5.610## | 100.262 ± 5.413## |
| CRX-526 positive control | 149.210 ± 17.151##,†† | 147.821 ± 17.131##,†† | 106.301 ± 5.405##,†† |
| ed as mean ± SD (n = 6 per group). TNF-α, tumor necrosis factor alpha; IL-1α, interleukin-1 alpha; IL-13, interleukin-13; FSEC, five-flavor Sophora flavescens enteric-coated capsules. Statistical comparisons were performed using one-way ANOVA followed by Bonferroni’s post-hoc test. **P < 0.01 versus the normal control group; ##P < 0.01 versus the model group; ††P < 0.01 versus the medium-dose and low-dose FSEC groups. No significant difference was observed between the CRX-526 positive-control group and the high-dose FSEC group for the three cytokines (P > 0.05). | |||
Table 2: Comparison of colon tissue cytokine levels among groups. Colon tissue concentrations of tumor necrosis factor alpha (TNF-α), interleukin-1 alpha (IL-1α), and interleukin-13 (IL-13) were determined in normal control, model, FSEC-treated, and CRX-526-treated mice. Data are presented as mean ± SD.
JAK2 and STAT3 expression were further evaluated by immunohistochemical staining. As shown in Figure 3 and Figure 4, JAK2 and STAT3 immunostaining appeared stronger in the model group than in the normal control group. In contrast, staining intensity appeared weaker in the FSEC-treated groups and in the CRX-526 positive-control group than in the model group. These observations are consistent with reduced inflammatory signaling in experimental UC following treatment.
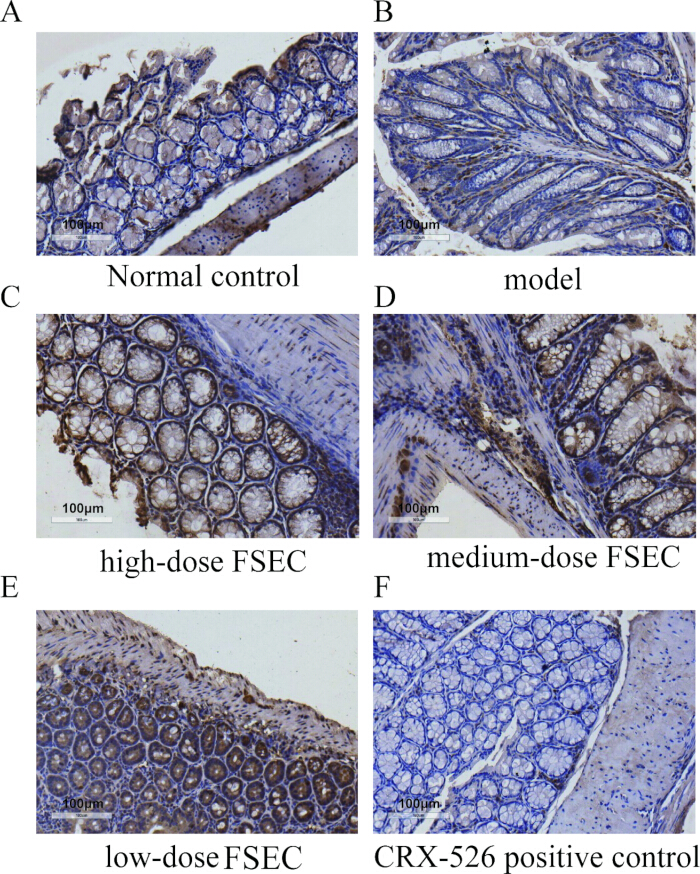
Figure 3: Immunohistochemical analysis of JAK2 expression in colon tissues. Representative JAK2-stained sections are shown for the following groups: (A) normal control, (B) model, (C) high-dose FSEC, (D) medium-dose FSEC, (E) low-dose FSEC, and (F) CRX-526 positive control. JAK2 immunostaining appeared stronger in the model group than in the normal control group and appeared weaker following FSEC or CRX-526 treatment. Magnification, ×400. Scale bar = 100 µm. Please click here to view a larger version of this figure.
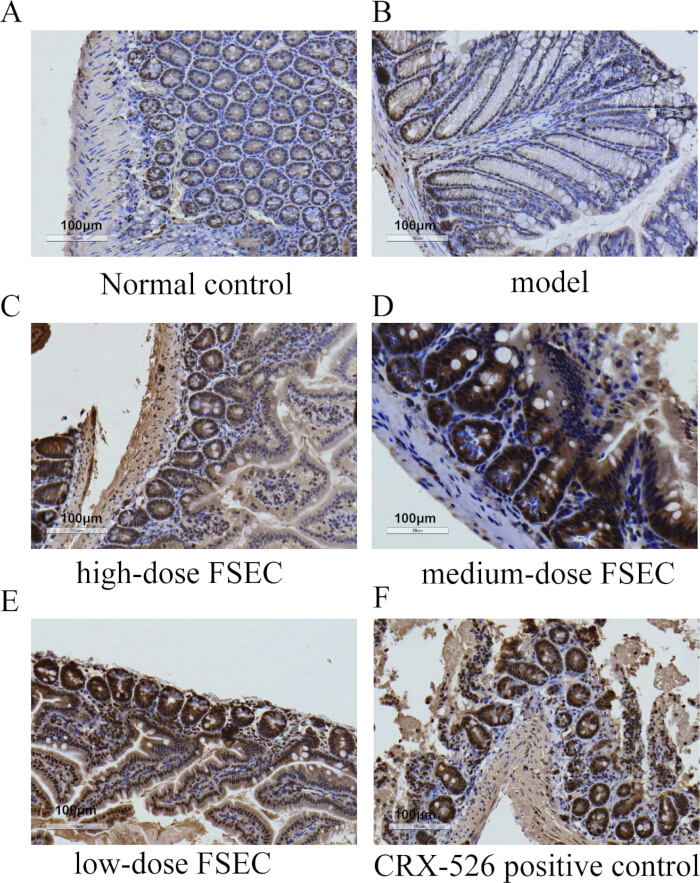
Figure 4: Immunohistochemical analysis of STAT3 expression in colon tissues. Representative STAT3-stained sections are shown for the following groups: (A) normal control, (B) model, (C) high-dose FSEC, (D) medium-dose FSEC, (E) low-dose FSEC, and (F) CRX-526 positive control. STAT3 immunostaining appeared stronger in the model group than in the normal control group and appeared weaker following FSEC or CRX-526 treatment. Magnification, ×400. Scale bar = 100 µm. Please click here to view a larger version of this figure.
FSEC improves ferroptosis-related marker changes in mice with ulcerative colitis
Ferroptosis-related indices were assessed by serum Fe2⁺ measurement and western blot analysis of GPX4, FTH1, and ACSL4 (Table 3 and Figure 5). Compared with the normal control group, the model group exhibited significantly increased Fe2⁺ levels and ACSL4 expression, together with decreased GPX4 and FTH1 expression (P < 0.01). These findings are consistent with ferroptosis-related alterations in the UC model.
| Group | Fe²⁺ (mg/L) | GPX4 | FTH1 | ACSL4 |
| Normal control | 0.74 ± 0.31 | 0.86 ± 0.05 | 0.82 ± 0.02 | 0.35 ± 0.07 |
| Model | 6.13 ± 0.71** | 0.31 ± 0.03** | 0.31 ± 0.03** | 0.75 ± 0.11** |
| High-dose FSEC | 2.79 ± 0.62**,## | 0.69 ± 0.07**,## | 0.66 ± 0.08**,## | 0.51 ± 0.06**,## |
| Medium-dose FSEC | 4.38 ± 1.36** | 0.59 ± 0.05**,## | 0.53 ± 0.05**,## | 0.61 ± 0.08**,## |
| Low-dose FSEC | 5.32 ± 0.48** | 0.45 ± 0.06**,## | 0.35 ± 0.06** | 0.63 ± 0.08**,## |
| CRX-526 positive control | 2.73 ± 0.55**,## | 0.68 ± 0.08**,## | 0.68 ± 0.08**,## | 0.49 ± 0.07**,## |
| a are presented as mean ± SD (n = 6 per group). Fe²⁺, ferrous iron; GPX4, glutathione peroxidase 4; FTH1, ferritin heavy chain 1; ACSL4, acyl-CoA synthetase long-chain family member 4; FSEC, five-flavor Sophora flavescens enteric-coated capsules. Statistical comparisons were performed using one-way ANOVA followed by Bonferroni’s post-hoc test. **P < 0.01 versus the normal control group; ##P < 0.01 versus the model group. | ||||
Table 3: Comparison of Fe2⁺ levels and ferroptosis-related protein expression among groups. Serum Fe2⁺ levels and relative expression of GPX4, FTH1, and ACSL4 proteins in colon tissues were evaluated in normal control, model, FSEC-treated, and CRX-526-treated mice. Protein expression values were normalized to β-actin and are presented as mean ± SD.
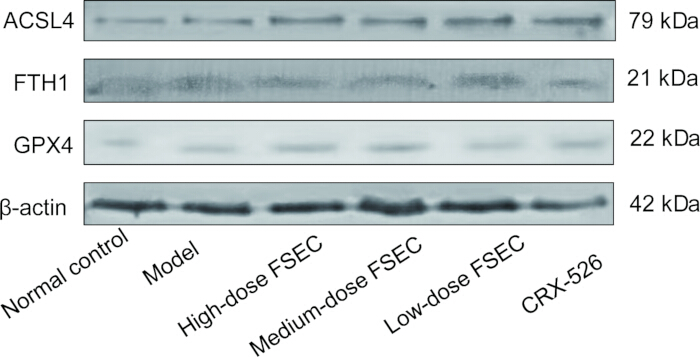
Figure 5: Western blot analysis of ferroptosis-related proteins in colon tissues. GPX4, FTH1, and ACSL4 protein expression was evaluated in the following groups: normal control, model, high-dose FSEC, medium-dose FSEC, low-dose FSEC, and CRX-526 positive control. Densitometric values were normalized to β-actin, and relative protein expression was used for statistical analysis. Compared with the model group, FSEC treatment was associated with increased GPX4 and FTH1 expression and decreased ACSL4 expression, consistent with improvement in ferroptosis-related marker profiles. Please click here to view a larger version of this figure.
Compared with the model group, high-dose FSEC and CRX-526 treatment reduced Fe2⁺ levels, whereas medium- and low-dose FSEC produced less pronounced reductions. GPX4 expression increased across all treatment groups. FTH1 expression increased in the high-dose and medium-dose FSEC groups and in the CRX-526 positive-control group, whereas the low-dose FSEC group showed a smaller change. ACSL4 expression decreased in all FSEC-treated groups and in the CRX-526 positive-control group relative to the model group. Collectively, these findings indicate that FSEC treatment was associated with improvement in ferroptosis-related molecular and biochemical marker profiles in experimental UC.
DATA AVAILABILITY:
All raw data supporting the findings of this study are provided as Supplementary File 1.
Supplementary File 1: Representative raw images supporting Figures 2–5, along with raw numerical dataset underlying Tables 1–3, including the individual measurements for SOD, CAT, GSH, MPO, Fe2⁺, cytokines, and densitometric analyses. Please click here to download this file.
Discussion
Loading...
$$\rightleftharpoonup{xx}$$
$$\longleftharp{xx}$$,
$$\longrightharp{xx}$$,
This study investigated the effects of five-flavor Sophora flavescens enteric-coated capsules (FSEC) in a mouse model of experimental ulcerative colitis (UC) and evaluated associated changes in oxidative-stress-related indices, inflammatory cytokines, JAK2/STAT3 signaling, and ferroptosis-related markers. The principal findings were that FSEC treatment alleviated colonic histopathological injury, improved antioxidant-related biochemical indices, reduced TNF-α and IL-1α levels, partially restored IL-13 levels, was associated with weaker JAK2 and STAT3 immunostaining, and improved ferroptosis-related marker profiles. Collectively, these observations indicate that FSEC exerts protective effects in experimental UC, associated with coordinated changes in oxidative stress, inflammatory signaling, and ferroptosis-related pathways.
Oxidative stress is closely involved in the development and persistence of intestinal mucosal injury in UC15. Iron-dependent oxidative injury has also been implicated in intestinal inflammation, and alterations in iron availability may contribute to mucosal oxidative stress and tissue damage21,22,23. Excessive reactive oxygen species can damage epithelial cells, disrupt mucosal barrier integrity, and amplify inflammatory-cell infiltration. In contrast, antioxidant systems, including superoxide dismutase (SOD), catalase (CAT), and glutathione (GSH), help maintain redox homeostasis and protect intestinal tissues from oxidative damage15,18. Myeloperoxidase (MPO), which is largely associated with neutrophil infiltration and inflammatory activity, is commonly increased in inflamed colonic mucosa19. In the present study, the UC model group showed reduced SOD, CAT, and GSH levels and increased MPO levels, indicating impaired antioxidant defenses and enhanced inflammatory oxidative activity. FSEC treatment partially reversed these changes, particularly in the high-dose group. Collectively, these observations indicate that restoration of antioxidant capacity and reduction of inflammatory oxidative activity may contribute to the protective effects associated with FSEC treatment in experimental UC.
Inflammatory cytokine imbalance is another important feature of UC. TNF-α and IL-1α are pro-inflammatory mediators that promote immune cell recruitment, epithelial injury, and the amplification of mucosal inflammation. In contrast, IL-13 plays context-dependent roles in intestinal inflammation and epithelial regulation, and its biological interpretation may vary across experimental models and disease stages. The JAK2/STAT3 pathway is an important cytokine-responsive signaling pathway involved in intestinal inflammation, epithelial injury, and immune regulation11,12,13,14. Aberrant JAK2/STAT3 signaling can promote transcriptional programs that sustain inflammatory responses and contribute to mucosal damage13,14. In this study, JAK2 and STAT3 immunostaining appeared stronger in the model group and weaker following FSEC treatment, suggesting that FSEC may attenuate inflammatory signaling associated with JAK2/STAT3 pathway activity. However, because the present analysis was based on immunohistochemical staining without quantitative assessment of phosphorylated JAK2 or phosphorylated STAT3, these findings should be interpreted as pathway-associated evidence rather than direct proof of pathway inhibition. Further studies evaluating p-JAK2 and p-STAT3, along with pathway-specific inhibition or rescue experiments, are needed to clarify the causal role of this pathway in the protective effects of FSEC treatment.
Ferroptosis is an iron-dependent form of regulated cell death associated with lipid peroxidation, iron accumulation, impaired antioxidant defenses, and dysregulated iron homeostasis4,5,20,24⁻31. In intestinal inflammation, ferroptosis-related epithelial injury may contribute to barrier dysfunction and disease progression24,25,26,27. GPX4 is a key antioxidant enzyme that suppresses lipid peroxidation, whereas FTH1 contributes to intracellular iron storage and maintenance of iron homeostasis18,28,31. ACSL4 promotes the incorporation of polyunsaturated fatty acids into membrane phospholipids and is commonly associated with susceptibility to ferroptosis29,30. In the present study, the UC model group showed increased Fe2⁺ and ACSL4 levels together with decreased GPX4 and FTH1 expression, consistent with ferroptosis-related molecular alterations. FSEC treatment increased GPX4 expression, partially restored FTH1 expression, and reduced ACSL4 expression. High-dose FSEC and CRX-526 also reduced Fe2⁺ levels compared with the model group. Together, these results are consistent with improvement in ferroptosis-related biochemical and molecular marker profiles in experimental UC.
It should be noted that the present study evaluated ferroptosis primarily through Fe2⁺ measurement and analysis of GPX4, FTH1, and ACSL4 expression. Although these markers are widely used to characterize ferroptosis-related changes, mitochondrial ultrastructural analysis was not performed. Therefore, conclusions regarding ferroptosis should be interpreted as marker-based evidence rather than as direct morphological confirmation. Future studies should incorporate transmission electron microscopy, lipid peroxidation assays, and ferroptosis-specific pharmacological rescue experiments to further validate ferroptosis's role in FSEC-associated protection.
FSEC is a multi-component traditional Chinese medicine formulation used clinically for mild to moderate active UC. Previous evidence suggests that FSEC may improve UC symptoms through multi-component, multi-target mechanisms10, 32. Because the formulation contains multiple botanical components, its effects are unlikely to be mediated by a single molecular target. The present findings support the possibility that FSEC acts through coordinated regulation of oxidative stress, inflammatory signaling, and ferroptosis-related injury responses. Compared with studies focusing on a single endpoint, the present work integrates histological assessment, biochemical oxidative-stress indices, cytokine measurements, JAK2/STAT3 immunohistochemistry, and ferroptosis-related western blot analysis within the same experimental model. This integrated design provides a more comprehensive framework for evaluating coordinated changes in oxidative stress, inflammatory signaling, and ferroptosis-related pathways in experimental UC and may facilitate future mechanistic studies of multi-component therapeutic interventions.
This study has several limitations. First, although the experimental results showed consistent improvements in histology, oxidative-stress indices, inflammatory cytokines, and ferroptosis-related markers, causal relationships among these pathways were not directly tested. Second, phosphorylated JAK2/STAT3 signaling was not assessed, and pathway-specific inhibitor or rescue experiments were not performed. Third, mitochondrial ultrastructural changes were not examined, limiting direct morphological confirmation of ferroptosis. Fourth, because FSEC is a complex multi-component formulation, the specific active constituents and their individual contributions remain to be identified. Future studies should combine standardized chemical profiling, component-level validation, pathway-specific interventions, and ferroptosis-specific morphological and functional assays to further clarify the interactions between inflammatory signaling pathways and ferroptosis-related mechanisms33.
In conclusion, FSEC treatment was associated with improved histopathological findings, oxidative-stress-related indices, inflammatory cytokine profiles, JAK2/STAT3 immunostaining patterns, and changes in ferroptosis-related markers in experimental UC. These findings suggest that FSEC may protect against experimental UC through coordinated modulation of oxidative stress, inflammatory signaling, and ferroptosis-associated molecular alterations. Further mechanistic studies are warranted to confirm the causal pathways and active components responsible for these effects.
Disclosures
Loading...
$$\rightleftharpoonup{xx}$$
$$\longleftharp{xx}$$,
$$\longrightharp{xx}$$,
The authors have no conflicts of interest to declare.
Acknowledgements
Loading...
$$\rightleftharpoonup{xx}$$
$$\longleftharp{xx}$$,
$$\longrightharp{xx}$$,
This study was supported by The Science and Technology Plan Project of Jiangxi Provincial Health Commission (grant no.202310195 and no.2023B0025).
Materials
| Name | Company | Catalog Number | Comments |
|---|---|---|---|
| 3,3′-Diaminobenzidine (DAB) substrate kit | ZSGB-BIO | ZLI-9018 | Chromogen substrate for HRP-based immunohistochemistry. |
| ACSL4 antibody (F-4) | Santa Cruz Biotechnology | sc-365230 | Mouse monoclonal primary antibody for western blot; used at 1:500; RRID: AB_10842002. |
| Antigen retrieval solution, citrate buffer, pH 6.0 | Beyotime Biotechnology | P0081 | Heat-induced epitope retrieval buffer for paraffin-section immunohistochemistry. |
| BCA protein assay kit | Beyotime Biotechnology | P0012 | Protein quantification before western blotting. |
| C57BL/6J mice | Fujian Anburui Biotechnology Co., Ltd. | N/A | Male SPF mice, 8 weeks old; animal source consistent with the submitted ethics approval materials. |
| Catalase (CAT) assay kit | Nanjing Jiancheng Bioengineering Institute | A007-1-1 | Colorimetric kit for serum CAT activity measurement. |
| ChemiDoc XRS+ imaging system | Bio-Rad Laboratories | 1708265 | Chemiluminescence imaging system for western blot detection. |
| CRX-526 | TargetMol | T27090 | TLR4 antagonist used as the positive-control intervention; CAS no. 245515-64-4. |
| Dextran sulfate sodium salt (DSS), colitis grade | MP Biomedicals | 160110 | DSS, colitis grade, molecular weight 36,000–50,000 Da; used at 2.5% in drinking water. |
| ECL chemiluminescent substrate | Bio-Rad Laboratories | 1705061 | Clarity Western ECL substrate for HRP-based western blot signal detection. |
| ELISA kit, mouse IL-13 | Abcam | ab219634 | Colorimetric sandwich ELISA kit for mouse IL-13 quantification; 450 nm readout. |
| ELISA kit, mouse IL-1α | Abcam | ab199076 | Colorimetric sandwich ELISA kit for mouse IL-1α quantification; 450 nm readout. |
| ELISA kit, mouse TNF-α | Abcam | ab208348 | Colorimetric sandwich ELISA kit for mouse TNF-α quantification; 450 nm readout. |
| Ethanol, absolute | Sinopharm Chemical Reagent Co., Ltd. | 10009218 | Used for tissue processing, dehydration, and reagent preparation. |
| Ferrous iron (Fe2+) assay kit | Nanjing Jiancheng Bioengineering Institute | A039-2-1 | Colorimetric kit for Fe2+ measurement in serum or tissue samples. |
| Five-flavor Sophora flavescens enteric-coated capsules | Beijing Zhonghui Pharmaceutical Co., Ltd. | NMPA approval no. Z20150002 | Chinese patent medicine; 0.4 g/capsule; formulation includes Sophora flavescens Aiton, Sanguisorba officinalis L., Indigo naturalis, Bletilla striata (Thunb.) Rchb.f., and Glycyrrhiza uralensis Fisch. ex DC.; pharmaceutical specification YBZ00152015 |
| Glutathione (GSH) assay kit | Nanjing Jiancheng Bioengineering Institute | A006-2-1 | Reduced glutathione assay kit for serum GSH measurement. |
| GPX4 antibody (E-12) | Santa Cruz Biotechnology | sc-166570 | Mouse monoclonal primary antibody for western blot; used at 1:500; RRID: not listed in the supplier datasheet. |
| Hematoxylin and eosin staining kit | Solarbio | G1120 | H&E staining of paraffin-embedded colon tissue sections. |
| Horseradish peroxidase-conjugated goat anti-mouse IgG | Santa Cruz Biotechnology | sc-2005 | Secondary antibody for western blot; used at 1:50,000; RRID: AB_631736. |
| ImageJ software | National Institutes of Health | Version 1.54 | Image-analysis and densitometry software used for western blot band quantification. |
| Immunohistochemistry detection kit | ZSGB-BIO | PV-9000 | Polymer-based HRP detection kit for paraffin-section immunohistochemistry. |
| JAK2 antibody (D2E12) | Cell Signaling Technology | 3230 | Rabbit monoclonal primary antibody for JAK2 immunohistochemistry on paraffin sections; RRID: AB_2128522. |
| Microplate reader | BioTek Instruments | Synergy H1 | Plate reader for ELISA absorbance measurement at 450 nm. |
| Myeloperoxidase (MPO) activity assay kit | Nanjing Jiancheng Bioengineering Institute | A044-1-1 | Colorimetric kit for serum MPO activity measurement. |
| Neutral buffered formalin, 10% | Sigma-Aldrich | HT501128 | Fixation of colon tissue before paraffin embedding. |
| Normal goat serum | Solarbio | SL038 | Blocking reagent for immunohistochemistry. |
| Paraffin | Leica Biosystems | 39601006 | Embedding medium for colon tissue processing. |
| Phosphate-buffered saline (PBS) | Solarbio | P1020 | Buffer for tissue homogenization, washing, and immunostaining procedures. |
| PVDF membrane | MilliporeSigma | IPVH00010 | Protein-transfer membrane for western blotting. |
| Recombinant mouse TNF-α protein | R&D Systems | 410-MT | Recombinant mouse TNF-α used for the final-week inflammatory challenge. |
| SDS-PAGE and transfer system | Bio-Rad Laboratories | 1658004 | Mini-PROTEAN Tetra system for SDS-PAGE and western blot transfer workflow. |
| SPSS Statistics software | IBM | Version 24.0 | Statistical analysis software for one-way ANOVA and Bonferroni post-hoc testing. |
| STAT3 antibody (124H6) | Cell Signaling Technology | 9139 | Mouse monoclonal primary antibody for STAT3 immunohistochemistry; RRID: AB_331757. |
| Superoxide dismutase (SOD) assay kit | Nanjing Jiancheng Bioengineering Institute | A001-3-2 | WST-1 method kit for serum SOD activity measurement. |
| Xylene | Sinopharm Chemical Reagent Co., Ltd. | 10023418 | Dewaxing reagent for paraffin-section processing. |
| β-actin antibody (C4) | Santa Cruz Biotechnology | sc-47778 | Mouse monoclonal loading-control antibody for western blot; used at 1:1,000; RRID: AB_626632. |
Reprints and Permissions
Request permission to reuse the text or figures of this JoVE article
Request Permission