We describe a replicable survey methodology designed to probe hierarchical asymmetries in artificial intelligence (AI) transformation (AX) perceptions. Both executives and practitioners complete a validated questionnaire hosted on Qualtrics; the analytical pipeline runs in SmartPLS 4.0, covering outer-model validation, path analysis, MICOM invariance testing, and permutation-based multi-group analysis (MGA).
A subscription to JoVE is required to view this content. Sign in or start your free trial.
Research Article
Uncovering Hierarchical Asymmetries in Artificial Intelligence Transformation: Navigating the Bright and Dark Sides Across Organizational Levels
In This Article
Summary
Abstract
Governance structures that align executive strategy with frontline implementation depend on understanding how organizational hierarchy shapes perceptions of artificial intelligence (AI) transformation (AX) success factors. We present a validated, replicable survey-based methodology coupling partial least squares structural equation modeling (PLS-SEM) with multi-group analysis (MGA) to detect and quantify hierarchical asymmetries in AX perceptions—going beyond aggregate analysis to expose structural divides that single-group methods leave hidden. Drawing on 293 professionals involved in AI projects, we assess four dynamic capability dimensions—operational agility, data readiness, customer proximity, and strategic process discipline—together with key enabling factors: technological support, AI-sensitive risk tolerance, environmental context, and proactive leadership. Compositional invariance is first verified through MICOM testing; only after confirming between-group comparability does the analysis move to permutation-based MGA significance tests. Both groups exhibit positive associations between dynamic capabilities and AX performance (executives: β = 0.637, R2 = 0.406; practitioners: β = 0.531, R2 = 0.282). Permutation-based MGA detects no statistically significant differences in structural path coefficients between the two groups (all p ≥ .178); the hypothesized moderating role of organizational position on path relationships (H5) therefore lacks support. Yet MICOM Step 3a shows executives rating all major constructs significantly higher than practitioners do (8 of 11 constructs, all p ≤ .045)—evidence that hierarchical asymmetry surfaces as a gap in perceptual levels, not in the structural relationships themselves. As a transferable methodological template, the protocol equips researchers studying perception gaps in organizational transformation with tools bearing directly on AI governance, change management strategy, and cross-level alignment in technology-intensive settings.
Introduction
Rapid advances in artificial intelligence have opened a dual landscape for business organizations—extraordinary value-creation opportunities on one side, significant risks and challenges on the other1,2. Generative AI and conventional AI technologies hold out the promise of higher productivity, faster innovation, and stronger competitive positioning3, yet they simultaneously invite concerns around bias, job displacement, inequality, and ethical dilemmas4,5. This bright-side/dark-side duality calls for careful scrutiny of how organizations steer through both opportunity and risk as they pursue transformation.
A growing body of work documents AI’s transformative reach—customer interaction optimization, operational efficiency gains, and sharper decision-making6,7. Those advances, however, carry substantial counterweights. Discrimination and bias embedded in AI systems can entrench existing inequalities8, automation threatens job stability9, and the opacity of many algorithms raises accountability questions10. The widening gap between AI-enabled firms and their less technologically advanced peers deepens economic disparity11, while transparency and trust deficits complicate stakeholder relationships12.
Although the digital transformation literature is extensive13, AI-driven transformation warrants separate treatment as a distinct phenomenon14,15. Black et al.16 identified critical enablers for AI-enabled business model transformation through a dynamic capabilities lens, yet their framework does not address how those factors are perceived and enacted differently across organizational hierarchies. That gap carries weight given mounting evidence of misalignment between executive strategy and practitioner implementation17.
Multilevel research has begun to show that AI adoption reverberates unevenly across organizational tiers, with pronounced variation in how executives and practitioners perceive and live AI transformation18. Productivity gains, sharper decision-making, and new value creation are widely acknowledged benefits of AI, yet many organizations still struggle to push AI initiatives past the pilot stage—particularly where perceptual and operational divides separate hierarchical levels.
In this study, AI transformation (AX) denotes the systematic, organization-wide process of weaving AI technologies into core operations, strategy, and value-creation processes. As operationalized here, AX spans three interrelated dimensions: (1) enterprise AI strategy formulation—the deliberate planning of AI investment, prioritization, and governance at the organizational level; (2) operational deployment of AI systems—the technical adoption, integration, and scaling of AI solutions within existing workflows; and (3) organizational change management—the human, cultural, and structural adjustments needed to realize AI’s value-creation potential at scale. This study targets this gap by asking: (1) whether the factors identified by Black et al.16 hold empirical validity across organizational contexts, and (2) how executives and practitioners diverge in their perceptions of these relationships—especially with regard to the bright and dark sides of AI transformation. By introducing organizational hierarchy as a structural moderator, we examine whether systematic asymmetries exist in how different levels perceive AI’s promises and perils. The findings indicate that both enabling factors and obstacles in AI transformation may be perceived differently across hierarchical levels, carrying implications for alignment and governance strategies.
Scholarship increasingly recognizes the dual character of AX. Grewal et al.19 dissect AI’s “light and darkness,” while Belanche et al.20 probe bright and dark sides in services. Belanche et al.20 trace algorithmic management’s contrasting effects, and Barari et al.1 supply meta-analytic evidence of AI’s dark side in marketing. Taken together, these studies make clear that AI transformation cannot be grasped through a purely optimistic lens; organizations must manage opportunities and mitigate risks at the same time.
Building on Black et al.16, four dynamic capabilities central to navigating this duality were examined: (1) Ability to run and change, which enables simultaneous exploitation and exploration21; (2) AI-oriented data/IS readiness, which provides infrastructure for AI deployment while handling data quality and integration challenges22; (3) Market/customer awareness, which balances personalization opportunities with privacy concerns23; and (4) Strategic process discipline, which safeguards governance without sacrificing agility24. In this framework, environmental context, proactive leadership, and enablers (AI-sensitive risk tolerance and tech-sensitive innovation culture) function as antecedents that jointly shape these four capability dimensions. The capabilities, in turn, collectively drive AI transformation performance. This causal chain—from antecedents through capabilities to performance outcomes—forms the core theoretical logic of the model, with organizational position (executive vs. practitioner) entering as a moderating lens through which perceptual asymmetries are examined.
Dynamic capabilities theory accounts for how firms sustain competitive advantage in volatile environments by sensing, seizing, and transforming25. Applied to AI, these capabilities let organizations tap technological opportunities while keeping the associated risks in check.
The ability to run and change captures an organization’s agility in balancing ongoing operations with innovation. Agility facilitates rapid AI adoption26, but it also raises the hazard of premature deployment and insufficient testing. Nguyen et al.27 demonstrate that AI disrupts traditional linear change models, demanding iterative, feedback-driven systems instead. Without careful management, the resulting constant adaptation can destabilize the organization28.
AI-oriented data/IS readiness functions as foundational infrastructure, yet true readiness spans both technical capabilities and organizational challenges. Robust data systems can unlock AI value creation22, but fragmented architectures and poor data quality can cap effectiveness29. Ghosh30 frames readiness as an interdependent system requiring continuous adaptation—spotlighting both its enabling potential and its implementation complexity.
Market/customer awareness equips organizations to sense customer needs and craft personalized experiences23. At the same time, it triggers privacy concerns and the risk of over-personalization. Striking the right balance between insight generation and privacy protection stands as a core tension in AI transformation31.
Strategic process discipline supplies governance structures for AI initiatives, promoting alignment and accountability16. Excessive discipline, however, can stifle innovation and slow adaptation. The challenge is to maintain enough structure without erecting bureaucratic barriers32.
H1: Capabilities are positively associated with performance.
Black et al.16 set proactive leadership apart from passive “top management support,” emphasizing leaders who actively shape strategic agendas, tolerate uncertainty, and monitor AI implementation33. Yet leadership effectiveness in AX hinges on bridging the executive-practitioner divide. Executives crystallize AI vision and weave in ethical governance34,35, whereas practitioners supply essential experiential feedback through daily tool interaction, surfacing real-world requirements that executives may miss36. This hierarchical gap often shows up as strategic enthusiasm at the top, proceeding without adequate attention to workflow integration challenges and usability constraints on the ground. Proactive leadership, therefore, calls for bidirectional engagement—executives setting strategic direction while actively folding in practitioner insights so that AI capabilities match operational realities. This interdependence leads to:
H2. Proactive Leadership is positively associated with Capabilities.
Environmental context covers the external forces that shape an organization’s strategic landscape. Industry dynamism—defined by Black et al.16 as the speed and intensity of change and competition—is marked by technological sophistication, relentless disruption, and a steady influx of new competitors, all of which demand organizational nimbleness. High dynamism amplifies the urgency of adopting transformative technologies like AI, making adoption speed a critical differentiator37. Singh et al.38 show how dynamism enables reconfigurable resource-based capabilities to form, pointing to the way dynamic capabilities embed in organizational structures either to support or to constrain innovation and adaptability. Recent findings underscore environmental dynamism’s complex, double-edged character39, report that it both positively and negatively moderates digitalization effects on business model innovation in Chinese manufacturing, while Binsar et al.40 identify a significant moderating effect on digital adoption capabilities and hospital performance in Indonesia. Environmental responsiveness, then, goes beyond mere external adaptation; it demands alignment among organizational systems, culture, and leadership. Accordingly, we hypothesize:
H3. Environmental context is positively associated with capabilities.
Two critical enablers bear on how organizations handle AI’s dual nature: AI risk tolerance and Tech-sensitive innovation culture. AI risk tolerance captures the willingness to accept uncertainty in AI experimentation. While such tolerance fuels innovation, it also exposes organizations to potential failures41. Zhao et al.42 show that error management culture enhances service innovation, though the benefits fade without proper management systems. Barrett et al.43 stress the need for risk governance practices balancing experimentation with safeguards. Tech-Sensitive Innovation Culture encourages AI adoption and experimentation while recognizing technological limitations. Such cultures promote continuous learning and cross-functional collaboration44 yet they can also pressure organizations into premature adoption or inadequate risk assessment. Striking the right balance between encouraging innovation and ensuring responsible implementation remains a key organizational challenge45.
H4: Enablers are positively associated with capabilities.
Organizational hierarchy exerts a strong influence on how AI’s opportunities and risks are perceived. Executives tend to concentrate on strategic benefits—competitive advantage, market positioning, and long-term value creation35, viewing AI through a largely optimistic lens that highlights its transformative potential. That vantage point, however, can underplay implementation challenges and operational complexities. Practitioners encounter AI’s dual nature more directly. While they recognize efficiency gains, they also grapple daily with data quality problems, integration hurdles, and workflow disruptions46, leaving them more attuned to AI’s limitations, risks, and unintended consequences47. Research on employee perceptions confirms that practitioners navigate a complex interplay of automation anxiety and efficiency gains, shaped by hands-on exposure to AI-driven workflow changes48. Cognitive research illuminates these differences. Managers rely more on intuitive, strategic processing suited for handling ambiguity, while practitioners employ analytical reasoning for operational problem-solving49,50. These cognitive styles affect each group’s reading of AI’s bright and dark sides. Cultural perceptions diverge as well. Executives are inclined to view organizational culture as innovation-enabling and cohesive34, while practitioners report structural impediments and limited influence51. Such contrasting outlooks feed misalignments in AI adoption strategies, ethical frameworks, and risk management52. Middle managers occupy a critical bridging role between strategic vision and operational reality. How effectively they balance optimism with pragmatism may be associated with transformation outcomes53. When that mediation falters, disconnects can widen, sapping organizational adaptability.
H5: Position in Organization (Executives vs. Practitioners) is associated with systematic differences in the perceptual level at which AX-related constructs are evaluated, with executives expected to report higher assessments of capabilities, enablers, and performance outcomes—reflecting their greater emphasis on the "bright side" of AI transformation—relative to practitioners, who are more proximate to operational risks and implementation challenges. It is important to note that H5 concerns perceptual differences (i.e., differences in how organizational hierarchy shapes the level of construct scores), not differences in underlying causal mechanisms. The cross-sectional survey design of this study supports inference about perceptual patterns and associative relationships; causal claims regarding structural moderation require longitudinal or experimental designs and are not asserted here.
Access restricted. Please log in or start a trial to view this content.
Protocol
All procedures complied with the ethical standards for human-participant research at aSSIST University, the University of Suwon, Sungkyunwakn University, and Dong-A University. Because every response was anonymized at the point of collection and no personally identifiable data was gathered at any stage, the Institutional Review Board at aSSIST University granted the study an exemption from full review. Co-author institutions relied on this lead-institution approval rather than pursuing independent IRB reviews; aSSIST University had sanctioned both the study design and the data-collection protocol. Within the Qualtrics platform, each participant encountered a digital informed-consent statement before the questionnaire became accessible. That statement outlined the study’s academic purpose, confirmed the handling of anonymous data, noted that data would serve research purposes only, and flagged the absence of foreseeable risks; anyone who did not actively consent was automatically routed out of the survey.
Research model
In our research model (Figure 1), capabilities serve as mediators between three antecedents—proactive leadership, environmental context, and enablers—and performance, while organizational position enters as a moderating variable. Capabilities encompass four dimensions: Ability to Run & Change (RC), AI-Oriented Data/IS Readiness (DR), Market/Customer Awareness (MC), and Strategic Process Discipline (SP). Enablers comprise Tech-Sensitive Innovation Culture (TS) and AI Risk Tolerance (AS).
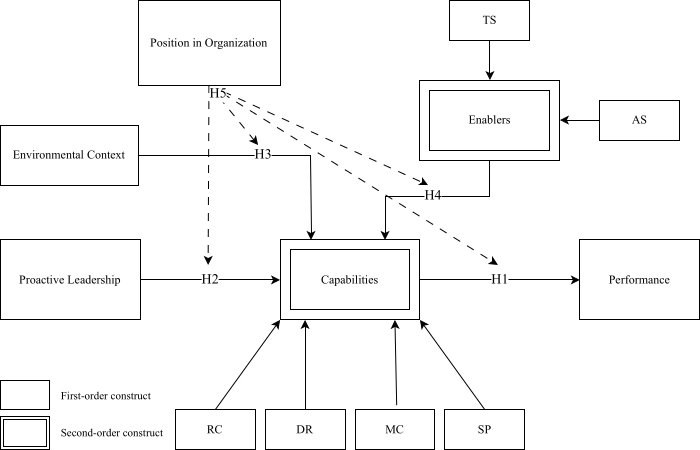
Figure 1: Research model. Conceptual research model depicting the hypothesized relationships among proactive leadership, environmental context, and enablers (antecedents); four dynamic capability dimensions (ability to run & change, AI-oriented data/IS readiness, market/customer awareness, strategic process discipline); and AI transformation performance, with organizational position (Executive vs. Practitioner) entering as a moderating variable. Please click here to view a larger version of this figure.
Research data
Data collection relied on an online survey administered through Prolific (https://www.prolific.co) for participant recruitment and Qualtrics (https://www.qualtrics.com) for survey hosting and administration, spanning two consecutive days (November 24–25, 2024). Eligibility was limited to individuals currently employed and actively involved in AI-related projects within their organizations. Prolific’s pre-screening filters enforced this criterion, and a Qualtrics screening question confirmed it: “Which of the following best describes your current situation?”—only respondents selecting “I am currently employed and have been involved in AI-related work” were allowed to continue. Participants also had to confirm they were at least 20 years of age via the digital consent form at the survey’s outset; those who did not consent were automatically excluded. An embedded attention-check item (“Is AI an abbreviation for Artichoke Information?”; correct answer: No) flagged inattentive respondents; the survey terminated automatically upon an incorrect response. The final sample comprised 293 professionals (female 50.51%, male 49.49%). Respondents were sorted into two groups on the basis of their answer to a dedicated survey item: “What’s your role in your company’s AI projects?” with five options: Executive/Senior Management, Middle Management, Technical Staff/Engineer, Researcher/Scientist, and Consultant. Those selecting Executive/Senior Management were placed in the Executives group; those selecting Technical Staff/Engineer, Researcher/Scientist, or Consultant were placed in the Practitioners group. Middle Management respondents (n = 81) joined the Executives group, on the reasoning that middle management roles involve direct oversight of operational teams and participation in strategic planning, situating them closer to executive function than to frontline practice. The final grouping yielded 112 Executives and 181 Practitioners. Table 1 summarizes the demographic profile.
Table 1: Demographic characteristics. Demographic profile of the 293 survey respondents, including gender, age, industry, and organizational role, disaggregated by the two hierarchical groups used for multi-group analysis (Executives, n = 112; Practitioners, n = 181). Please click here to download this Table.
Measures
All survey items were measured using a seven-point Likert scale ranging from “strongly disagree (1)” to “strongly agree (7).” To verify conceptual clarity and appropriateness for the target professional population, a 30-respondent pretest was run using Prolific participants who reported active engagement in AI-related projects at their organizations. Pretest responses led to minor wording revisions for two items that participants found ambiguous, with no structural changes to the scale. Hypotheses were tested via Partial Least Squares Structural Equation Modeling (PLS-SEM) estimated in SmartPLS 4.0. Three features of the present study guided this choice. First, both Capabilities and Enablers are operationalized as formative second-order constructs—a configuration for which variance-based estimation is more directly suited than covariance-based SEM. Second, perceptual asymmetries in AI transformation represent an emerging research domain where mature measurement conventions are still developing; under these conditions, a predictive emphasis is more appropriate than optimization of confirmatory fit indices. Third, the Executive and Practitioner subgroups differ substantially in size (Executives n = 112; Practitioners n = 181), and variance-based estimation is not subject to the minimum cell-size requirements that constrain covariance-based approaches. Prior empirical work on digital transformation has adopted this analytical approach.
In SmartPLS 4.0, the PLS algorithm was configured with path weighting, a maximum of 300 iterations, and a stop criterion of 10⁻7. Bootstrapping used 5,000 subsamples with bias-corrected and accelerated (BCa) confidence intervals, no sign changes, and complete bootstrapping. For the two-stage approach, Stage 1 latent variable scores were obtained by running the PLS algorithm on the first-order measurement model (Calculate → PLS Algorithm); these scores were then exported (Results → Latent Variable Scores) and used as manifest indicators for the second-order constructs in Stage 2. Permutation-based MGA was executed via Calculate → Multi-Group Analysis → Permutation, with 1,000 permutations and a two-tailed significance level of 0.05. MICOM testing was conducted through Calculate → Permutation → MICOM, also with 1,000 permutations. FIMIX-PLS segmentation was performed via Calculate → FIMIX-PLS with 10 repetitions and a fixed seed for reproducibility46,54,55,56,57,58,59. In the context of this study, PLS-SEM served a dual function: evaluating construct-level path relationships across the full sample and supporting between-group comparisons through MGA. Path-level results also pointed toward patterns warranting further theoretical examination60.
Capabilities and Enablers are each operationalized as formative second-order constructs in this study. Capabilities aggregates four first-order dimensions: reconfiguration capability, AI-oriented data and system readiness, market and customer proximity, and strategic process discipline. Enablers combines two first-order dimensions: AI-sensitive risk tolerance and tech-sensitive innovation culture. Estimation of the second-order formative constructs followed the two-stage approach recommended for higher-order models in PLS-SEM61. This approach is distinct from the repeated indicator approach: rather than duplicating all first-order indicators at the second-order level in a single estimation step, the two-stage procedure first generates latent variable scores for each first-order construct from its respective indicator set (Stage 1), then uses these scores as manifest inputs to the corresponding second-order construct in Stage 2. This sequential estimation prevents cross-construct indicator inflation that can arise when all items appear simultaneously within a single-stage higher-order model62,63,64. The two-stage procedure thereby avoids the parameter inflation and biased estimates that can result from the repeated indicator approach in a single-stage estimation64. To examine H5, permutation-based multi-group analysis (PLS-MGA) was applied65,66 to examine whether the structural relationships, namely the associations between Capabilities and Performance (H1), Proactive Leadership and Capabilities (H2), Environmental Context and Capabilities (H3), and Enablers and Capabilities (H4), differ across groups categorized by organizational position (H5) (Figure 2). The PLS-MGA function embedded within SmartPLS was used for this analysis. The content of the questionnaire is presented in Table 2.
Table 2: Questionnaire. Complete measurement instrument listing all reflective items for the eleven first-order constructs, their source references, and the seven-point Likert response scale used for every item. Please click here to download this Table.
Two attention check items were inserted into the final survey, and these acted as filters to screen out participants not answering in a correct manner (i.e., “Which of these questions best describes your current situation?”) and if the participant answered one of these questions incorrectly, then the survey terminated immediately.
Access restricted. Please log in or start a trial to view this content.
Results
As a preliminary assessment of common method bias (CMB), Harman’s single-factor test was conducted, with the first unrotated factor accounting for 30.21% of variance (below the 50% threshold). While this result provides initial evidence that CMB does not dominate the data, it is acknowledged that Harman’s test has limited sensitivity and specificity as a diagnostic tool. As additional procedural safeguards, the survey employed randomized item ordering, included reverse-coded items, and guaranteed respondent anonymity to ...
Access restricted. Please log in or start a trial to view this content.
Discussion
The findings reveal that organizational hierarchy is associated with systematic differences in the level at which executives and practitioners perceive AI transformation constructs, rather than in the structure of relationships among them. Three independent MGA approaches—permutation-based MGA (1,000 permutations), Bootstrap MGA (5,000 subsamples)74, and Parametric and Welch-Satterthwaite tests66—consistently found no statistically significant differences in str...
Access restricted. Please log in or start a trial to view this content.
Disclosures
The authors declare no conflicts of interest. During manuscript preparation, the authors used generative AI in a limited capacity—specifically to reword drafts of selected methodological passages and to flag grammatical issues in technical descriptions. Each AI-generated passage was then cross-checked against the source data and substantially rewritten by the authors. The authors bear full responsibility for the accuracy, integrity, and originality of every part of the manuscript. All authors contributed equally to the article.
Acknowledgements
This work is supported by research funding from aSSIST University.
Access restricted. Please log in or start a trial to view this content.
Materials
| Name | Company | Catalog Number | Comments |
|---|---|---|---|
| Prolific (Online Participant Recruitment Platform) | Prolific Academic Ltd | https://www.prolific.com/ | Online platform used to recruit survey participants. Participants were screened based on eligibility criteria (e.g., current employment in an organization with AI adoption experience) and compensated according to Prolific's fair-pay guidelines. |
| Qualtrics (Online Survey Platform) | Qualtrics, LLC | https://www.qualtrics.com/ | Web-based survey platform used for questionnaire design, distribution, and response data collection. All measurement items were administered via Qualtrics using a 7-point Likert scale (1 = strongly disagree, 7 = strongly agree). |
| SmartPLS 4.0 (PLS-SEM Software) | SmartPLS GmbH | https://smartpls.com/ | Used for all Partial Least Squares Structural Equation Modeling (PLS-SEM) analyses, including outer model assessment (composite reliability, AVE, HTMT), inner model path analysis (bootstrapping, 5,000 samples), MICOM 3-step compositional invariance testing (permutation, 1,000 draws), and PLS-MGA between-group difference tests. |
References
- Barari, M., Casper Ferm, L. -E., Quach, S., Thaichon, P., Ngo, L. The dark side of artificial intelligence in marketing: Meta-analytics review. Mark Intell Plan. 42 (7), 1234-1256 (2024).
- Benlian, A., et al. Algorithmic management: Bright and dark sides, practical implications, and research opportunities. Bus Inf Syst Eng. 64 (6), 825-839 (2022).
- Maslej, N., et al. Artificial intelligence index report 2025. , Stanford University. (2025).
- Ntoutsi, E., et al. Bias in data-driven artificial intelligence systems—an introductory survey. WIREs Data Min Knowl Discov. 10 (3), e1356(2020).
- Ivanov, S. The dark side of artificial intelligence in higher education. Serv Ind J. 43 (15–16), 1055-1082 (2023).
- Akerkar, R. Artificial intelligence for business. , Springer. (2019).
- Huang, M. -H., Rust, R. T. A strategic framework for artificial intelligence in marketing. J Acad Mark Sci. 49 (1), 30-50 (2021).
- Zajko, M. Conservative AI and social inequality: Conceptualizing alternatives to bias through social theory. AI Soc. 36 (3), 1047-1056 (2021).
- Mcclure, P. K. “You’re fired,” says the robot: The rise of automation in the workplace, technophobes, and fears of unemployment. Soc Sci Comput Rev. 36 (2), 139-156 (2018).
- Gigerenzer, G. How to stay smart in a smart world: Why human intelligence still beats algorithms. , MIT Press. (2022).
- Zhang, S., Mehta, N., Singh, P. V., Srinivasan, K. Frontiers: Can an artificial intelligence algorithm mitigate racial economic inequality? An analysis in the context of airbnb. Mark Sci. 40 (5), 813-820 (2021).
- Guercini, S. Marketing automation and decision making: The role of heuristics and AI in marketing. , Edward Elgar Publishing. (2023).
- Aldoseri, A., Al-Khalifa, K. N., Hamouda, A. M. Ai-powered innovation in digital transformation: Key pillars and industry impact. Sustainability. 16 (5), 1790(2024).
- Allen, D., et al. A roadmap for governing ai: Technology governance and power-sharing liberalism. AI Ethics. 5 (3), 3355-3377 (2025).
- Smuha, N. A. From a ‘race to ai’to a ‘race to AI regulation’: Regulatory competition for artificial intelligence. Law Innov Technol. 13 (1), 57-84 (2021).
- Black, S., Samson, D., Ellis, A. Moving beyond ‘proof points’: Factors underpinning AI-enabled business model transformation. Int J Inf Manag. 77, (2024).
- Soulami, M., Benchekroun, S., Galiulina, A. Exploring how AI adoption in the workplace affects employees: A bibliometric and systematic review. Front Artif Intell. 7, 1473872(2024).
- Bankins, S., Ocampo, A. C., Marrone, M., Restubog, S. L. D., Woo, S. E. A multilevel review of artificial intelligence in organizations: Implications for organizational behavior research and practice. J Organ Behav. 45 (2), 159-182 (2024).
- Grewal, D., Guha, A., Satornino, C. B., Schweiger, E. B. Artificial intelligence: The light and the darkness. J Bus Res. 136, 229-236 (2021).
- Belanche, D., Belk, R. W., Casaló, L. V., Flavián, C. The dark side of artificial intelligence in services. Serv Ind J. 44 (3–4), 149-172 (2024).
- March, J. G. Exploration and exploitation in organizational learning. Organ Sci. 2 (1), 71-87 (1991).
- Wamba, S. F., Akter, S., Edwards, A., Chopin, G., Gnanzou, D. How ‘big data’can make big impact: Findings from a systematic review and a longitudinal case study. Int J Prod Econ. 165, 234-246 (2015).
- Rane, N. Enhancing customer loyalty through artificial intelligence (AI), internet of things (IoT), and big data technologies: Improving customer satisfaction, engagement, relationship, and experience. , (2023).
- Finkelstein, S., Hambrick, D. C., Cannella, A. A. Strategic leadership: Theory and research on executives, top management teams, and boards. , Oxford University Press. (2009).
- Teece, D., Peteraf, M., Leih, S. Dynamic capabilities and organizational agility: Risk, uncertainty, and strategy in the innovation economy. Calif Manage Rev. 58 (4), 13-35 (2016).
- Grover, V. Digital agility: Responding to digital opportunities. Eur J Inf Syst. 31 (6), 709-715 (2022).
- Nguyen, T., et al. The organisational impact of agility: A systematic literature review. Manag Rev Q. , 1-49 (2024).
- Atienza-Barba, M., Del Río, M. D. L. C., Meseguer-Martínez, Ã, Barba-Sanchez, V. Artificial intelligence and organizational agility: An analysis of scientific production and future trends. Eur Res Manag Bus Econ. 30 (2), 100253(2024).
- Hiniduma, K., Byna, S., Bez, J. L. Data readiness for ai: A 360-degree survey. ACM Comput Surv. 57 (9), 1-39 (2025).
- Ghosh, S. Developing artificial intelligence (AI) capabilities for data-driven business model innovation: Roles of organizational adaptability and leadership. J Eng Technol Manag. 75, 101851(2025).
- Cheng, X., Lin, X., Shen, X. -L., Zarifis, A., Mou, J. The dark sides of ai. Electron Mark. 32 (1), 11-15 (2022).
- Sinnaiah, T., Adam, S., Mahadi, B. A strategic management process: The role of decision-making style and organisational performance. J Work-Appl Manag. 15 (1), 37-50 (2023).
- Augier, M., Teece, D. J. Dynamic capabilities and the role of managers in business strategy and economic performance. Organ Sci. 20 (2), 410-421 (2009).
- Sposato, M. Leadership training and development in the age of artificial intelligence. Dev Learn Organ. 38 (4), 4-7 (2024).
- Abonamah, A. A., Abdelhamid, N. Managerial insights for ai/ml implementation: A playbook for successful organizational integration. Discover Artif Intell. 4 (1), 22(2024).
- Biswas, M. I., Talukder, M. S., Khan, A. R. Who do you choose? Employees' perceptions of artificial intelligence versus humans in performance feedback. China Account Finance Rev. 26 (4), 512-532 (2024).
- Porter, M. E. Towards a dynamic theory of strategy. Strategic Manag J. 12 (S2), 95-117 (1991).
- Singh, R., Charan, P., Chattopadhyay, M. Dynamic capabilities and responsiveness: Moderating effect of organization structures and environmental dynamism. Decision. 46 (4), 301-319 (2019).
- Li, Y., et al. Digitalization and network capability as enablers of business model innovation and sustainability performance: The moderating effect of environmental dynamism. J Inf Technol. 39 (4), 687-715 (2024).
- Binsar, F., Mursitama, T. N., Hamsal, M., Rahim, R. K. The role of digital adoption capability on hospital performance in indonesia moderated by environmental dynamism. J Health Organ Manag. 39 (1), 1-21 (2025).
- Wu, L., Yang, J. How does tolerance culture affect organizational agility? The moderating effect of top management team diversity. Total Quality Management & Business Excellence. 36 (3–4), 324-344 (2025).
- Zhao, B., Lu, Y., Wang, X., Pang, L. Challenge stressors and learning from failure: The moderating roles of emotional intelligence and error management culture. Technol Anal Strateg Manag. 36 (2), 238-251 (2024).
- Barrett, A. M., et al. AI Risk-Management Standards Profile for General-Purpose AI Systems (GPAIS) and Foundation Models. , Center for Long-Term Cybersecurity, UC Berkeley. (2023).
- Kanski, L., Pizon, J. The impact of selected components of Industry 4.0 on project management. J Innov Knowl. 8 (1), 100336(2023).
- Ali, M., Khan, T. I., Khattak, M. N., Şener, İ Synergizing AI and business: Maximizing innovation, creativity, decision precision, and operational efficiency in high-tech enterprises. J Open Innov Technol Mark Complex. 10 (3), 100352(2024).
- Rana, J., Daultani, Y., Goswami, M., Kumar, S. Exploring the impact of supply chain digital transformation on supply chain performance: An empirical investigation. Bus Strateg Environ. 34 (3), 3497-3521 (2025).
- Koponen, J., Julkunen, S., Laajalahti, A., Turunen, M., Spitzberg, B. Work characteristics needed by middle managers when leading AI-integrated service teams. J Serv Res. 28 (1), 168-185 (2025).
- Kelley, S. Employee perceptions of the effective adoption of AI principles. J Bus Ethics. 178 (4), 871-893 (2022).
- Caspers, S., et al. Dissociated neural processing for decisions in managers and non-managers. PLoS One. 7 (8), e43537(2012).
- Yamazaki, Y., Toyama, M., Putranto, A. J. Comparing managers’ and non-managers’ learning and competencies. J Workplace Learn. 30 (4), 274-290 (2018).
- Perry, C. R. D., Lieb, J., Wild, R., Sussman, J. Your AI transformation needs a different leadership approach. , L.E.K. Consulting. (2025).
- Rakova, B., Yang, J., Cramer, H., Chowdhury, R. Where responsible AI meets reality: Practitioner perspectives on enablers for shifting organizational practices. Proc ACM Hum-Comput Interact. 5 (CSCW1), 1-23 (2021).
- Koloski, D., Porter, C., Almand-Hunter, B., Gatchell, S., Logan, V. Data literacy in industry: High time to focus on operationalization through middle managers. Harv Data Sci Rev. 7 (1), (2025).
- Abdelwahed, naA., et al. Enabling sustainable futures: Examining organizational dynamics and technology platforms in digital transformation to achieve firm sustainability. Int J Innov Sci. , (2025).
- Depino-Besada, N. I., Sartal, A., León-Mateos, F., Llach, J. Exploring the relationships between digital transformation, organizational slack and business performance: A configurational approach. Bus Process Manag J. 31 (2), 416-442 (2025).
- Hongyun, T., et al. Navigating the digital landscape: Examining the interdependencies of digital transformation and big data in driving SMEs' innovation performance. Kybernetes. 54 (3), 1797-1825 (2025).
- Mamakou, X. J., Nakos, A. Navigating the digital future: Impact and opportunities of digital transformation and the metaverse. Procedia Comput Sci. 256, 12-19 (2025).
- Singh, K., Chaudhuri, R., Chatterjee, S. Assessing the impact of digital transformation on green supply chain for achieving carbon neutrality and accelerating circular economy initiatives. Comput Ind Eng. 201, 110943(2025).
- Takagi, N., Menezes, R., Varajao, J., Faria, S. Harnessing information processing theory: Key organizational initiatives for digital transformation projects success. Int J Manag Proj Bus. 18 (2), 410-433 (2025).
- Fornell, C., Larcker, D. F. Evaluating structural equation models with unobservable variables and measurement error. J Mark Res. 18 (1), 39-50 (1981).
- Hair, J. F., Hult, G. T. M., Ringle, C. M., Sarstedt, M., Thiele, K. O. Mirror, mirror on the wall: A comparative evaluation of composite-based structural equation modeling methods. J Acad Mark Sci. 45 (5), 616-632 (2017).
- Loch, K. D., Straub, D. W., Kamel, S. Global information systems. , Routledge. (2008).
- Marakas, G., Johnson, R., Clay, P. F. The evolving nature of the computer self-efficacy construct: An empirical investigation of measurement construction, validity, reliability and stability over time. J Assoc Inf Syst. 8 (1), 2(2007).
- Gaskin, J., Godfrey, S., Vance, A. Successful system use: It’s not just who you are, but what you do. AIS Trans Hum-Comput Interact. 10 (2), 57-81 (2018).
- Henseler, J. PLS-MGA: A Non-Parametric Approach to Partial Least Squares-Based Multi-Group Analysis. Challenges at the Interface of Data Analysis, Computer Science, and Optimization. , Springer. (2012).
- Cheah, J. -H., Amaro, S., Roldán, J. L. Multi-group analysis of more than two groups in PLS-SEM: A review, illustration, and recommendations. J Bus Res. 156, 113539(2023).
- Podsakoff, P. M., Mackenzie, S. B., Lee, J. -Y., Podsakoff, N. P. Common method biases in behavioral research: A critical review of the literature and recommended remedies. J Appl Psychol. 88 (5), 879(2003).
- Henseler, J., Ringle, C. M., Sarstedt, M. A new criterion for assessing discriminant validity in variance-based structural equation modeling. J Acad Mark Sci. 43 (1), 115-135 (2015).
- Teece, D. J. Explicating dynamic capabilities: The nature and microfoundations of (sustainable) enterprise performance. Strategic Manag J. 28 (13), 1319-1350 (2007).
- Henseler, J., Ringle, C. M., Sarstedt, M. Testing measurement invariance of composites using partial least squares. Int Mark Rev. 33 (3), 405-431 (2016).
- Zhu, C., Li, N., Ma, J., Qi, X. CEOs' digital technology backgrounds and enterprise digital transformation: The mediating effect of R&D investment and corporate social responsibility. Corp Soc Responsib Environ Manag. 31 (3), 2557-2573 (2024).
- Packmohr, S., Paul, F. -H., Brink, H. Considering company size, level of responsibility, and employee age for analysing countermeasures against barriers to digital transformation. J Telecommun Digit Econ. 12 (1), 172-195 (2024).
- Ringle, C. M., Sarstedt, M. Gain more insight from your PLS-SEM results: The importance-performance map analysis. Ind Manag Data Syst. 116 (9), 1865-1886 (2016).
- Henseler, J., Ringle, C. M., Sinkovics, R. R. The use of partial least squares path modeling in international marketing. Advances in International Marketing. 20, 277-319 (2009).
- Hahn, C., Johnson, M. D., Herrmann, A., Huber, F. Capturing customer heterogeneity using a finite mixture pls approach. Schmalenbach Bus Rev. 54 (3), 243-269 (2002).
- Ringle, C. M., Sarstedt, M., Mooi, E. A. Response-based segmentation using finite mixture partial least squares: Theoretical foundations and an application to American Customer Satisfaction Index data. Data Mining: Special Issue in Annals of Information Systems. 8, 19-49 (2009).
- Sjödin, D., Parida, V., Palmié, M., Wincent, J. How AI capabilities enable business model innovation: Scaling AI through co-evolutionary processes and feedback loops. J Bus Res. 134, 574-587 (2021).
- Höhener, D. Dynamic capabilities to manage generative artificial intelligence in digital transformation efforts. Wirtschaftsinformatik 2024 Proceedings. 1, (2024).
- Teece, D. J. Business models and dynamic capabilities. Long Range Plann. 51 (1), 40-49 (2018).
- Hambrick, D. C., Mason, P. A. Upper echelons: The organization as a reflection of its top managers. Acad Manage Rev. 9 (2), 193-206 (1984).
- Pinski, M., Hofmann, T., Benlian, A. AI literacy for the top management: An upper echelons perspective on corporate AI orientation and implementation ability. Electron Mark. 34 (1), 1-23 (2024).
Access restricted. Please log in or start a trial to view this content.
Reprints and Permissions
This article has been published
Video Coming Soon