This study presents a ROS–Gazebo-based monocular vision framework for pose estimation of autonomous underwater vehicles using ArUco markers. Estimated poses are compared with simulated odometry, demonstrating stable tracking and strong agreement with ground truth under controlled conditions.
A subscription to JoVE is required to view this content. Sign in or start your free trial.
Research Article
Pose Estimation of Unmanned Underwater Vehicles Using Augmented Reality Marker-Based Simulations
In This Article
Summary
Abstract
This study presents a simulation-based framework for pose estimation of Unmanned Underwater Vehicles (UUVs) using a monocular vision system within a ROS–Gazebo environment. The RexRov2 UUV model, integrated with ArUco_ROS, is used to detect virtual markers and estimate position and orientation in a simulated underwater setting. A Perspective-n-Point (PnP) method is applied for pose estimation, and a proportional-integral-derivative (PID) controller regulates vehicle motion based on marker-derived features. The system is evaluated by comparing estimated poses with ground-truth odometry obtained from the simulator. Under nominal conditions, the results demonstrate stable pose estimation with close agreement between estimated and true positions and orientations. The system maintains smooth trajectory tracking with minimal fluctuations, indicating reliable performance in controlled environments. Under increased hydrodynamic disturbances, however, the system exhibits deviations in position and orientation, leading to instability in tracking performance. These results highlight the limitations of classical PID control in nonlinear underwater environments and suggest the need for more robust control strategies. Overall, the proposed framework provides a safe, flexible, and cost-effective platform for testing underwater navigation algorithms and evaluating perception–control integration in simulated environments.
Introduction
Unmanned Underwater Vehicles (UUVs) are commonly used in scenarios where human presence is limited, such as ocean monitoring, exploration, and the petroleum industry. They are equipped with advanced sensors to gather data from complex underwater environments, which necessitates robust and cost-effective testing platforms. Simulation techniques, including vision-based methods using ArUco markers, provide an effective means to reduce risks associated with real-world deployment of UUVs.
The history of UUVs, from the first Special Purpose Underwater Research Vehicle to modern autonomous underwater vehicles, highlights their importance in research, defense, and industry1. The evolution of autonomous underwater vehicles further emphasizes the need for accurate positioning, navigation, and testing within simulated environments2,3.
Figure 1 illustrates the conventional architecture of a UUV simulation system. The combination of the Robot Operating System (ROS) and the Gazebo simulator offers a versatile platform for modeling, control, and real-time communication. ROS facilitates efficient communication among sensors, actuators, and control modules, while Gazebo provides a realistic 3D simulation environment for testing navigation and control algorithms4,5. In this context, ArUco marker-based methods enhance pose estimation by enabling precise detection and tracking of reference points6.
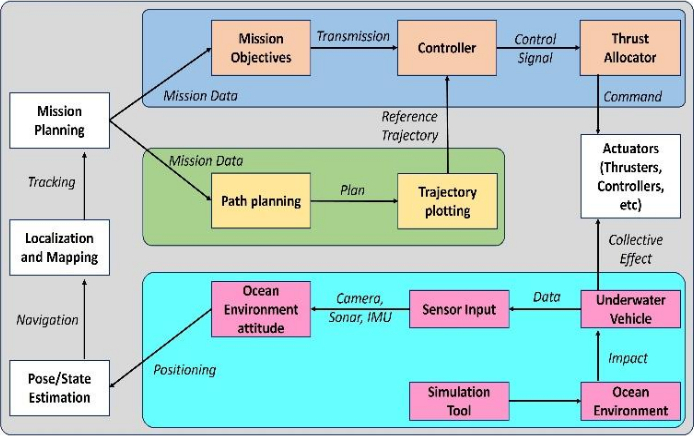
Figure 1: Conventional architecture of a UUV simulation system.The diagram illustrates the interaction between simulation, perception, and control components within the ROS–Gazebo framework.Please click here to view a larger version of this figure.
Several studies have advanced UUV simulation, navigation, and perception technologies7. The suitability of the ROS–Gazebo framework for robot modeling has been demonstrated4, and this approach has been extended to underwater applications through the UUV Simulator for multi-robot and intervention tasks5. Vision-based positioning has also been improved by combining ArUco markers with tracking algorithms6. Similarly, high-fidelity simulation and supervision of underwater missions have been enabled through advanced simulation platforms8, while robust positioning in confined environments using fiducial markers has also been demonstrated9.
These technological developments are complemented by survey studies. Advances in underwater navigation and localization challenges have been comprehensively reviewed10,11, and commercial and open-source simulation platforms have been systematically evaluated12. Additional reviews have examined the state of the art in autonomous underwater vehicles13,14, as well as formation control and communication strategies for multi-vehicle systems14. Furthermore, advances in robust tracking control15 and state estimation using deep learning approaches, such as Gated Recurrent Units16, have further improved the reliability of autonomous underwater missions. Collectively, these studies demonstrate significant progress in the realism of simulations, navigation, and the intelligent control of UUVs.
Despite these advancements, several research challenges remain. Current simulators lack accurate sensor models, particularly for forward-looking and side-scan sonar systems. Most platforms support only single AUV operations, with limited capability for multi-AUV coordination and formations. Sensor and dynamic model inaccuracies can result in suboptimal performance, and environmental disturbances such as currents and noise are not consistently modeled across simulators. To address these limitations, the present study introduces a ROS–Gazebo simulation framework incorporating ArUco marker-based pose estimation to enable more accurate state estimation and rigorous evaluation of UUV navigation algorithms.
This work provides three main contributions. First, it presents an ArUco-based monocular pose estimation approach within an underwater ROS–Gazebo simulation environment using the RexRov2 model. Second, it analyzes pose stability under varying disturbance conditions and control scenarios. Third, it identifies limitations of classical PID control in nonlinear underwater environments under dynamic disturbances. In addition, this work integrates perception, control, and simulation into a unified framework, bridging gaps in prior studies that treat these components independently.
Access restricted. Please log in or start a trial to view this content.
Protocol
1. Software environment setup
A Linux-based workstation running Ubuntu 20.04 and the Robot Operating System (ROS) Noetic was used as the primary development platform for implementing underwater self-localization systems17. The system was initialized by creating a catkin workspace with mkdir -p ~/catkin_ws/src and then initializing it with catkin_init_workspace. The uuv_simulator and aruco_ros packages were cloned into the source directory and compiled using the catkin_make command to support underwater intervention modeling.
Connectivity between the ROS middleware and the Gazebo 9 simulator was verified by launching a default underwater world and confirming active communication through the rostopic list command. The image processing and pose estimation nodes were implemented using Python 3.8 and integrated ArUco libraries to calculate relative pose using OpenCV. The ROS environment was configured to manage dependencies and enable real-time data communication, enabling the robot to localize itself relative to multiple artificial markers18. This setup also enabled evaluation of marker detection performance under varying conditions. Figure 1 illustrates communication among the simulation, perception, and visualization nodes in the ROS–Gazebo environment.
2. UUV model and hydrodynamic parameterization
The RexRov2 vehicle model was obtained from the uuv_descriptions package and launched in Gazebo using its Unified Robot Description Format (URDF) file5. The vehicle model consisted of links and joints, with a dry mass of 1,863 kg and a volume displacement of 1.838 m3, corresponding to near-neutral buoyancy in water with a density of 1,000 kg/m3.
Hydrodynamic effects were modeled using the uuv_underwater_object_plugin, including linear and quadratic damping forces. The added mass surge coefficient was set to 779.79, and damping parameters were calibrated based on reported RexRov2 characteristics to simulate realistic vehicle motion19. Figure 2 shows the overall simulation architecture.
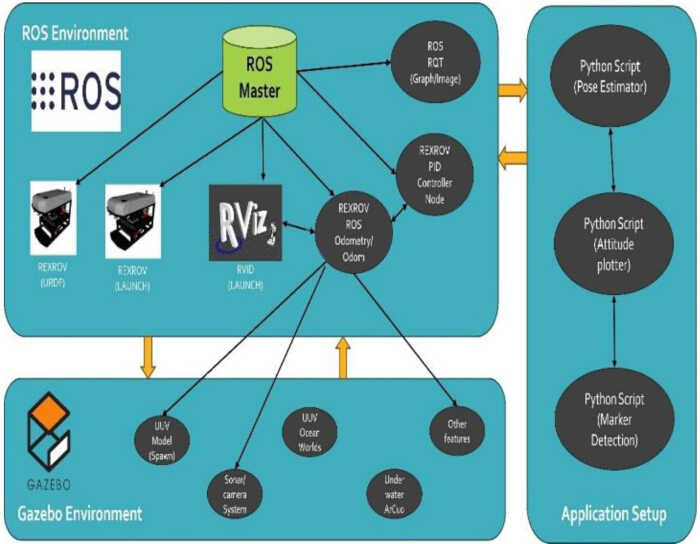
Figure 2: Overall architecture of the simulation environment. The figure shows the integration of the UUV model, sensor inputs, perception pipeline, and control modules used for pose estimation and navigation. Please click here to view a larger version of this figure.
3. Camera, marker, and environmental setup
A monocular camera was attached to the rexrov2/camera_link frame. The camera parameters were set to 1280 × 720 pixels and 30 Hz. Intrinsic parameters were defined in the camera configuration file with a focal length of 554.25 pixels and a principal point at (640.5, 360.5).
A fixed vertical ArUco marker with a side length of 0.5 m, selected from the 6×6_250 dictionary (ID: 582), was positioned at coordinates (20.0, 0.0, -10.0). The simulated environment was configured with a water depth of 10 m and a constant current velocity of 0.1 m/s in the X-direction using the /uuv_simulation_app/set_current_velocity ROS service. A light intensity of 0.8 was used to ensure marker visibility9. Figure 3 shows the simulated underwater environment.
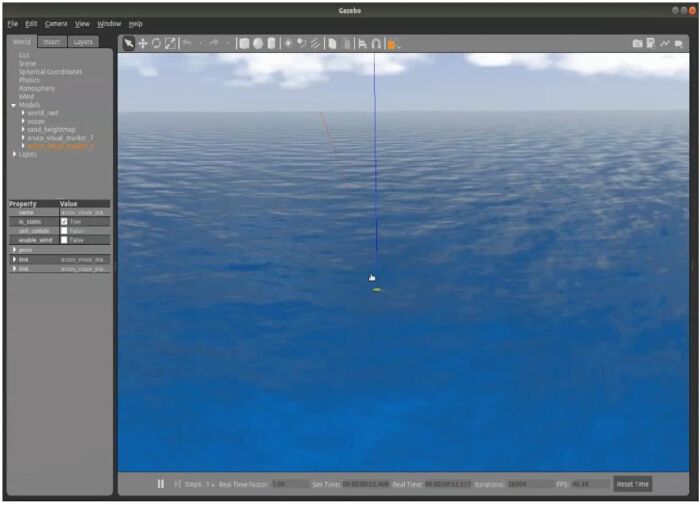
Figure 3: Simulated underwater environment in Gazebo 9. The environment includes the RexRov2 UUV, virtual ArUco markers, and controlled environmental conditions such as water depth, lighting, and current. Please click here to view a larger version of this figure.
4. Pose estimation and navigation control
The marker detection pipeline was initiated using the ArUco ROS node, which subscribed to the /rexrov2/forward_camera/image_raw topic. The pose of the vehicle was estimated using the Perspective-n-Point (PnP) method to compute the rotation matrix (R) and translation vector (t) relative to the known 3D marker geometry.
The estimated pose was transformed from the camera frame to the global reference frame using a static transform publisher. A PID controller was used to regulate vehicle motion by sending velocity commands to the /rexrov2/thruster_manager/input topic. The proportional gains (Kp) for the surge and heave axes were set to 1500 and 2000, respectively, to ensure stable tracking performance20.
5. Evaluation and ground-truth comparison
The agreement between the vision-based pose estimates and the simulated trajectory was evaluated using the /rexrov2/pose_gt topic provided by the uuv_gazebo_ros_p3d plugin. The estimated pose from the ArUco-based pipeline was compared with ground-truth odometry data to assess system stability and consistency.
Evaluation was performed through trajectory comparison and real-time visualization, where position (X, Y, Z) and orientation (roll, pitch, yaw) were monitored using Rviz and rqt_plot. This enabled observation of deviations under both nominal and disturbance-induced conditions.
The study focuses on qualitative and comparative evaluation. Quantitative evaluation using Root Mean Square Error (RMSE) is identified as future work, where multiple simulation runs will be used to assess position and orientation error.
6. Result generation and visualization
Rviz was used as a 3D visualization tool to monitor the UUV trajectory and attitude. The /rexrov2/camera_link and /aruco_marker_frame coordinate frames were visualized to assess the spatial relationship between the vehicle and the marker2.
The rqt_plot tool was used to generate real-time plots of vehicle attitude (roll, pitch, yaw) using the /rexrov2/pose_gt and /aruco_pose topics. The rosbag record command was used to capture simulation data, including video streams and control inputs, for qualitative analysis.
The simulation was conducted under ideal visual conditions, assuming good lighting and low turbidity. The ArUco marker was assumed to remain unobstructed. Hydrodynamic damping effects were modeled using simplified coefficients, and sensor noise was not included.
Access restricted. Please log in or start a trial to view this content.
Results
A simulated underwater environment was used to assess the proposed ROS–Gazebo-based system using the RexRov2 UUV. The wave simulation environment (Figure 3) provided a dynamic yet controlled setting for evaluating the marker-based pose estimation system.
Figure 4 illustrates the relationship between detected ArUco markers and the resulting UUV trajectory. The perception pipeline, based on ArUco marker detection, successfully detected ...
Access restricted. Please log in or start a trial to view this content.
Discussion
The numerical observations support the effectiveness of the proposed framework under controlled conditions. The small variations in position (on the order of 10⁻2 m) and orientation (on the order of 10⁻2 rad) indicate stable pose tracking. These results demonstrate that ArUco markers provide a reliable reference for short-range localization6. In addition, simulation platforms enable the generation of specialized datasets for robust SLAM, supporting localization in...
Access restricted. Please log in or start a trial to view this content.
Disclosures
The authors declare no conflicts of interest regarding the publication of this article.
Author contribution:
Dr. Nirmalajyothi Narisetty conceptualized the study and developed the methodology. Dr. Sirisha Potluri created and implemented the simulation model. Dr. P. Aurchana contributed to the interpretation of results and revised and edited the manuscript. Dr. Debnath Bhattacharyya contributed to the experimental design, technical discussions, methodological refinement, and manuscript review. Dr. Tai-hoon Kim provided senior academic guidance, technical supervision, and advisory support throughout the study. The overall technical development and refinement of the research work were carried out under his supervision. All authors read and approved the final version of the manuscript.
Acknowledgements
This study was financially supported by Chonnam National University (Grant number: 2026-1109-01).
Access restricted. Please log in or start a trial to view this content.
Materials
| Name | Company | Catalog Number | Comments |
|---|---|---|---|
| ArUco Marker Detection Library | OpenCV | N/A (open-source) | Vision-based marker detection for pose estimation |
| Gazebo Simulator | Open Robotics | N/A (open-source) | 3D simulation environment for UUV testing |
| REXROV2 UUV Model | UUV Simulator Project | N/A (open-source) | Predefined UUV model used for pose estimation experiments |
| Robot Operating System (ROS) | Open Robotics | N/A (open-source) | Middleware for communication and control |
| RViz | Open Robotics | N/A (open-source) | Visualization tool for UUV model and sensor data |
| Ubuntu Linux (20.04 LTS) | Canonical Ltd. | N/A | Operating system supporting ROS and Gazebo |
| UUV Simulator Package | Norwegian University of Science and Technology (NTNU) | N/A (open-source) | ROS–Gazebo underwater simulation framework |