This article describes a method of electrochemical polystyrene (micro- and nano-sized) sensing using a molecularly imprinted polymer (MIP)-based sensing approach.
Method Article
Molecular Imprinted Polymers (MIP)-Based Electrochemical Sensing of Micro/Nano Polystyrene
In This Article
Summary
Abstract
This article is based on the electrochemical sensing of micro- and/or nano-sized polystyrene (m/n-PS). A molecularly imprinted polymer (MIP)-based electrochemical sensing of nano polystyrene (nPS) of 100 nm and 500 nm sizes is demonstrated in this article. Poly-o-phenylenediamine (PoPD) is adopted as the MIP material and fabricated electrochemically (i.e., electro-polymerization) on the surface of the screen-printed carbon electrode (SPCE), using o-phenylenediamine (oPD) as the monomer. To fabricate MIP selective to m/n-PS, PS of 100 and 500 nm were utilized as template material. Fabrication of the PoPD@MIP@SPCE system targeting m/n-PS was characterized using electrochemical techniques to understand the electrochemical properties and electrochemical sensing. Finally, such optimized MIPs@PoPD/SPCE sensing chips were utilized to demonstrate electrochemical sensing of a range of concentrations of nPS solutions (100 and 500 nm-sized PS), ranging from 4.2 x 10⁻⁹ to 2.1 x 10⁻⁴ g/L in water. The lowest concentration detected by the developed sensing chip is as low as 4.2 x 10⁻⁹ g/L, and the related operation time is 11 min. These sensors were also utilized to detect nPS in water samples that were collected from the Florida Polytechnic University lake. Such a proposed sensing method can be utilized for nPS sensing in point-of-care (POC) sensing, which is of great importance for environmental surveillance applications.
Introduction
Micro/nano plastics, i.e., degraded or etched plastic, production and further incorporation into the human cycle are increasing every day. At the same time, the effect of micro/nano plastics on the environment, water, and human health is alarming and affects ecosystems1. Therefore, the need to manage the associated severe consequences has received global attention from agencies1. This situation is serious because plastic production is increasing (390 million metric tons in 2023 alone) to meet demand for economic growth (a market size of 700 billion dollars in 2023) and to further their applications under various operational conditions (heat, humidity, and interactions with other chemicals). Furthermore, the situation is exacerbated by the inadequate disposal of used plastics due to a lack of consistent global regulations. All these circumstances are responsible for the higher production of micro- and/or nano-plastics, which have been integrated into the human cycle and are adversely affecting health. In such situations, there is a need for strategies for trapping, sensing, and degradation of micro/nano plastic1,2,3.
Among several micro/nano plastics (size ranging from µm to nm), micro- and/or nano-sized polystyrene (m/n-PS) is one of the pollutants of concern, which is a degraded product of polystyrene that is involved in various applications, such as packaging, food services, appliances, insulation, and other product developments. These m/n-PS need thousands of years for complete degradation, but in this timeline, m/n-PS can interact with food, water, and air to get into the human cycle and enter the human body. Recently, various reports have confirmed that m/n-PS (at ppb level) is associated with (1) cellular toxicity1,2, (2) thyroid dysfunction, (3) crossing the blood-brain barrier (BBB)2, (4) altering the function of brain cells2, (5) neurotoxicity2, and (6) neurodegenerative diseases1,4. Therefore, it is crucial to investigate the methodologies for selective sensing of m/n-PS at a very low level. Considering the association of m/n-PS with environmental and health factors, it is recommended to achieve sensing in the setting of point-of-care (PoC) and point-of-use (PoU)3. Such an approach can be explored and adopted for surveillance applications. At the same time, these PoC and PoU sensing approaches can be integrated with artificial intelligence (AI) approaches for rapid analysis and decision-making4. To achieve these tasks, it is technologically suggested to develop a miniaturized sensor for selective sensing of m/n-PS. Selectivity is a crucial parameter because m/n-PS can have affinity with other water pollutants like per- and polyfluoroalkyl substances (PFAS), natural organic waste, etc.4
Currently, there are many approaches for the detection of m/n-PS, including Fourier Transform Infrared (FTIR) spectroscopy, scanning electron microscopy (SEM), and high-resolution fluorescence microscopy3. These techniques are effective, but they are not cost-effective, and they show limitations in performing sensing at the ppb and ppt levels. Other methods, such as pyrolysis-gas chromatography/mass spectrometry (Py-GC/MS), are also highly efficient, but have limitations of high cost, need for sophisticated instrumentation, and expertise-based, labor-intensive operation1,3. The detection of PS requires matching the right analytical method to the target particle size and structural properties. While traditional benchtop methods provide unparalleled analytical depth, electrochemical polystyrene sensing offers a distinct paradigm shift by delivering rapid, cost-effective, and field-portable monitoring of sub-micron and nanoscale plastic particles directly in liquid matrices. Standard laboratory techniques, including FTIR and Raman spectroscopy, rely on unique fingerprinting (chemical or vibrational) for accurate identification and visualizing unknown particle shapes and sizes down to roughly 1 µm. However, these spectroscopic tools are expensive, have slow scanning speeds, and require intensive sample drying3. For legal or regulatory compliance, Py-GC/MS is considered the gold standard for calculating total mass fractions of PS within highly complex matrices like soil and sludge, though it destroys the sample and strips away all morphological data3. In contrast, electrochemical sensing approaches that utilize specifically modified electrode interfacing, for example, molecularly imprinted polymers (MIPs) or peptide-functionalized graphene, can capture PS via physical adsorption or electrostatic affinity and cause instantaneous variations in electrical current or resistance1,3. A comparative sensing performance of electrochemical polystyrene sensing in comparison with the other techniques adopted for polystyrene detection is summarized in Table 1.
At the same time, these sensing approaches are more selective for micro- and sub-micro-sized PS at a bit higher concentration (mM). However, these techniques are not suitable for nano-sized PS (below 100 nm) and low concentrations of nPS. This limitation is related to (1) the properties and nature of the selected materials, which cannot amplify the response signal, and (2) the microelectronics, which may not be able to process a low response signal. Moreover, most of the PS sensing tools are not suitable for PoC and PoU sensing of m/n-PS. Recently, efforts were made to develop electrochemical sensing of m/n-PS, wherein a sensing material is needed to perform sensing4,5,6,7,8,9. It is known that electrochemical sensors are low-cost handheld device systems to detect sub-nanomolar detection limits rapidly (within minutes). These systems can be an ideal solution for high-throughput, point-of-need (PoN) environmental screening where conventional analytical tools and laboratory infrastructure are not accessible. Therefore, a portable electrochemical system for PS sensing can be developed by selecting an appropriate transducer, sensing materials, and data processing and analytical approaches1,2,3. Such an optimized sensor of high sensitivity can detect m/n-PS in a PoU and PoN setting by measuring electrical signals and bypasses the need for sophisticated instrumentation and laboratories.
There are a few such types of sensors, and the demonstrated sensing meets the demand of surveillance applications1,4. However, the sensing mechanism and reason for selectivity are not well discussed due to a lack of selective recognition or affinity elements. Therefore, there is a pressing need to explore miniaturized electrochemical sensors for the selective detection of m/n-PS. In this regard, this report proposes a MIP-based electrochemical sensor that can selectively detect m/n-PS. MIPs are known for the selective trapping of a targeted analyte, which is utilized as a template material10,11,12,13. This template is defined by an analyte’s size, orientation, and shape, which generates cavities where the targeted analyte can selectively bind on the surface of the sensing electrode. Due to these specificities, MIPs have been considered artificial antibodies needed for advanced biomedical applications and have been adopted in various types of selective sensing applications. Due to mass production, control over electrical properties, and ease of surface modification, MIP-based approaches have translational aspects1,14.
To integrate the capabilities of MIP-based sensing with the features of electrochemical sensing, this article presents a method for m/n-PS sensing using a poly-o-phenylenediamine (PoPD)- based MIP. The features of PoPD as an MIP for sensing applications have been discussed in previous research publications. The MIP of PoPD was fabricated electrochemically on a screen-printed carbon electrode (SPCE), a customized three-electrode system suitable for performing electrochemistry. The MIP fabrication process was performed using both 100 nm and 500 nm m/n-PS particles (two separate chips) as template materials. Both MIP@PoPD (100 nm-sized template)@SPCE and MIP@PoPD (500 nm-sized template)@SPCE chips can detect m/n-PS using chronoamperometry (CA) and differential pulse voltammetry (DPV) within the concentration range of 4.2 x 10⁻⁹ to 2.1 x 10⁻⁴ g/L. The outcome of this research suggests that MIP-PoPD (fabricated using a 500 nm template) exhibits a better mathematical model related to nPS (500 nm) sensing, in comparison to nPS of 100 nm, in water samples. The detailed description of this method-related article has been published by Sanchez-Almirola et al.1 and granted a USA Patent15.
Protocol
The authors declare that this research was conducted in compliance with regulatory standards and institutional oversight. The waste associated with this research was stored according to the university's environmental and health safety (EHS) department guidelines. Later, the waste was collected and disposed of by the experts at regular intervals. The authors completed all the lab safety training suggested by the EHS department of the university and followed all the regulations while conducting the proposed research. The reagents and the equipment used are listed in the Table of Materials.
1. Materials
- Obtain screen-printed Carbon Electrodes (SPCEs) utilized for MIP fabrication from commercial sources.
NOTE: SPCEs are electrochemical systems consisting of three electrodes: a working electrode (WE), a counter electrode (CE), and a reference electrode (RE). The WE of the SPCE (3 mm diameter) is composed of graphite, the CE of the SPCE is composed of carbon, and the RE of the SPCE is composed of silver. - Prepare a stock solution of PS (both 100 nm and 500 nm) using deionized (DI) water as the solvent.
2. Electrochemistry and characterization
- Prepare a polymerization solution of PS particles (100 nm and 500 nm-sized particles of nPS, separately) and o-phenylenediamine suspended in DI water.
- After electro-polymerization, perform elution by submerging the SPCE in a solution of equal parts of DI water and methanol.
NOTE: All the electrochemical experiments and characterizations were performed using a potentiostat. - Perform electrochemical studies using phosphate-buffered saline (PBS) as the redox electrolyte, containing 5 mM potassium ferricyanide K3[Fe(CN)6]) and potassium ferrocyanide K4[Fe(CN)6]. Prepare the PBS solution by dissolving one buffer tablet (for pH = 7) in 200 mL of DI water, then mix until the tablet has dissolved. The operational parameters of cyclic voltammetry (CV) studies are discussed later.
- Investigate the fabrication, characterization, and sensing features of MIP@PoPD using electrochemical techniques like CV and differential pulse voltammetry (DPV). The operational parameters of CV and DPV studies are discussed later.
- Perform electrochemistry using electrochemical analyzers, and operate the analyzer with PSTrace 5.9 software.
NOTE: The details of the fabrication of MIP@PoPD are discussed in related previous publications1,13.
3. Cleaning of the electrode
- Submerge the SPCE in a 1 M solution of hydrochloric acid (HCl) to ensure a clean surface for polymerization. The HCl was stored and handled according to the guidelines1.
- To clean the electrode, connect the SPCE to the potentiostat and run CV with a potential range of -1 V to 1 V at a 100 mV/s scan rate for 10 cycles.
- Afterwards, wash the SPCE surface using DI water and keep it for air drying.
- Characterize the SPCE system by running CV from -1 V to 1 V at a 50 mV/s scan rate for 3 cycles, and DPV from -1 V to 1 V with a pulse potential of 0.01 V and a pulse time of 0.01 s.
4. Fabrication of MIP@PoPD
- To create the polymerization solution, combine 1 mM o-phenylenediamine (oPD) and 10 µL of the target analyte [500 nm (2.1 × 10⁻⁴ g/L) or 100 nm (2.1 × 10⁻⁴ g/L)] sized particles of nPS in 15 mL of DI water. Here, two different types of polymerization solutions are mentioned.
- Using a micropipette, add 100 µL of the polymerization solution to the working electrode of the SPCE system.
- To fabricate the PoPD-based MIP, after connecting the SPCE to the potentiostat, run CV with a potential range of 0 V to 1 V, a scan rate of 50 mV/s, for 30 cycles. Here, the fabrication of two different types of MIPs is considered, one specific to a 100 nm-sized template and another specific to a 500 nm-sized template.
- As before, wash the SPCE using DI water, and allow it to dry in the air.
- As before, characterize the SPCE system by running CV from -1 V to 1 V at a 50 mV/s scan rate for 3 cycles, and DPV from -1 V to 1 V with a pulse potential of 0.01 V and pulse time of 0.01 s.
- Elute (at 25 °C) the PoPD@SPCE system by suspending the electrode in a 50/50 solution of methanol and DI water for 30 min.
- Again, rinse the eluted SPCE with DI water and air dry.
- As before, characterize the SPCE system by running CV from -1 V to 1 V at a 50 mV/s scan rate for three cycles, and DPV from -1 V to 1 V with a pulse potential of 0.01 V and a pulse time of 0.01 s.
5. Electrochemical nPS sensing
- Using a micropipette, drop 100 µL of the desired analyte solution (referring to 100 nm-sized and 500 nm-sized nPS) on the working electrode, allowing 10 min of incubation time (at 25 °C) for the analyte to bind to the MIP layer.
NOTE: The solutions selected for performing sensing were as follows: 2.1 × 10⁻⁴ g/L, 4.2 × 10⁻⁶ g/L, 2.1 × 10⁻⁷ g/L, 4.2 × 10⁻⁸ g/L, 4.2 × 10⁻⁹ g/L, and 0 g/L. - After the incubation period has elapsed, rinse the SPCE system with DI water to remove any unbonded nPS from the MIP layer.
- After reconnecting the SPCE system to the potentiostat, characterize the electrode with CV from -1 V to 1 V at 50 mV/s for three cycles, DPV from -1 V to 1 V with pulse potential 0.01 V and pulse time 0.01 s for three cycles, and perform three cycles of chronoamperometry (CA) at 10 V for 30 min. The CA studies were conducted at various voltages, but the amplified signal was achieved at 10 V.
NOTE: All the electrochemical measurements were performed in triplicate (n=3), and graphs of identical magnitude were used for the analysis.
6. Data analysis
- Analyze all the data generated in MATLAB (version R2022b).
NOTE: In DPV, electrodes generate electrochemical signals at different baselines. Therefore, prominence is selected to analyze the electrochemical behavior and plot the calibration curve. The prominence calculation is performed directly using the PSTrace 5.9 software, which is an automatic process. The DPV data collected using PSTrace 5.9 software were further plotted using MATLAB. PSTrace 5.9 is user-friendly software that operates the electrochemical potentiostat to perform electrochemical experiments, including CV and DPV studies. The parameters for performing CV and DPV studies have been reported at appropriate places above. The data generated using PSTrace 5.9 were used to plot graphs using MATLAB for a better presentation.
Results
The MIP@PoPD@SPCE is a sensing electrode system, which is discussed in this article, wherein the two MIPs of PoPD were fabricated on SPCE using 100 nm and 500 nm-sized nPS as a template material. Regarding this study, two types of MIP@PoPD@SPCE sensing chips were developed: one fabricated using nPS of 100 nm as the template material, and the other with reference to nPS of 500 nm as the template material. These MIP@PoPD@SPCE systems were used to detect specific sizes of nPS (for example, 100 nm and 500 nm nPS, separately) in representative water samples, using the proposed method.
During the process of sensing, it is important to know the electrochemical behavior of the sensing electrode, electrolyte, and the nPS at various stages and conditions. Therefore, the nature of SPCE and nPS is investigated using electrochemical studies, including CV and DPV. To understand the influence of nPS on the electrochemical outcomes, we performed CV and DPV of SPCE using PBS as the electrolyte, as well as in a combination of PBS and nPS. The understanding of the surface properties of SPCE and MIP@SPCE is also very important, which was evaluated using Raman spectroscopy.
Cleaned and optimized SPCEs were utilized for both MIP@PoPD@SPCE systems fabrication, using both 100 nm and 500 nm-sized nPS as template materials. Surface functional characteristics of SPCEs were well explored; all SPCEs were processed for MIP@PoPD fabrication using electrochemical techniques. All the MIP@PoPD/SPCE sensing chips were fabricated using an identical polymerization solution, diluted samples, cleaning solution, and electrolyte solution. The CV technique was utilized for the electrochemical cleaning of the SPCE electrode, as presented in Figure 1A. Once cleaned, these SPCE electrodes were utilized for the fabrication of MIP on the WE of SPCE via electro-polymerization of PoPD using CV techniques, as presented in Figure 1B. The CV (Figure 1C) and DPV (Figure 1D) techniques were also utilized to understand the electrochemical behavior of SPCE at various stages, for example, post-cleaning, post-polymerization, and post-elution.
MIP@PoPD@SPCE chips were fabricated using 500 nm-sized nPS as template material for the electrochemical sensing of nPS (500 nm-sized nPS) concentrations (ranging from 4.2 x 10⁻⁹ to 2.1 x 10⁻⁴ g/L). In this approach, electrochemical techniques, including DPV (Figure 2) and CA (Figure 3), were utilized for performing the selective sensing of nPS. In this process, several MIP@PoPD@SPCE sensing chips, specific to 500 nm-sized nPS, were utilized for a single use. This means a new sensing electrode should be utilized for the sensing of each concentration of nPS (500 nm-sized) using the DPV technique (Figure 2A). As expected, the DPV-based electrochemical signal was found to increase as a function of nPS concentration. The magnitude of the electrochemical signal as a function of each concentration was utilized to establish a calibration graph plotted between the nPS concentrations and peak current response, in terms of prominence (Figure 2B). Thus, the plotted calibration graph seems acceptable mathematically and exhibited a sensitivity of 0.037169 µA/log(g/L), a regression coefficient (R2) of 0.902, a limit of detection of 4.2 × 10⁻⁹ g/L, and a significance p-value of < 0.015
To explore multi-mode electrochemical sensing of nPS (500 nm), these MIP@PoPD@SPCE sensing chips were utilized for sensing of nPS (500 nm, ranging from 4.2 x 10⁻⁹ to 2.1 x 10⁻⁴ g/L) using the CA technique (Figure 3), at a constant 10 V for 30 min. The magnitude of the current response of each sensor stabilized after approximately 3 min. Therefore, the first 180 s of each recording were plotted and used for sensing-data analysis. Therefore, only the first 180 s were plotted and selected for sensing data analysis (Figure 3A). The results of CA studies also showed that the current flowing through each sensing chip steadily drops for the first 70 s, followed by a steep decline before the current stagnates. The rate of current change (Figure 3B) was processed through a low-pass filter. Further, the rates of current change for each concentration tested were averaged and plotted against the logarithm of each concentration. These outcomes were utilized to plot a calibration curve (Figure 3C). The outcomes of the CA-based electrochemical signal as a function of nPS concentrations exhibited a very promising method. This is reflected by a very well-fitted calibration curve that exhibited an R2 of 0.994 and a very high correlation between the average rate of current change and nPS concentration. Additionally, a wide detection range from 4.2 x 10⁻⁹ to 2.1 x 10⁻⁴ g/L, the lowest concentration detected at 4.2 × 10⁻⁹ g/L, and a statistically significant result at the p < 0.001 level were also observed.
Following the same process, the MIP@PoPD@SPCE sensing electrode, fabricated using 100 nm nPS as template material, has been utilized for the electrochemical sensing of nPS (100 nm-sized) using DPV (Figure 4) and CA (Figure 5) techniques in the concentration range from 4.2 x 10⁻⁹ to 2.1 x 10⁻⁴ g/L. An increase in the magnitude of MIP@PoPD@SPCE chip was observed as the concentration of 100 nm-sized nPS increases, as illustrated in Figure 4A. The outcomes of this study (Figure 4A) were utilized to plot a calibration curve (Figure 4B), the magnitude of the electrical signal with reference to a specific concentration. Thus, the plotted calibration curve exhibited a linear regression R2 of 0.738, a sensitivity of 0.0533 µA/log(g/L), a wide detection range (from 4.2 x 10⁻⁹ to 2.1 x 10⁻⁴ g/L), a limit of detection of 4.2 × 10⁻⁹ g/L, and statistical significance (p < 0.05). A CA-based electrochemical approach was also explored for multi-mode electrochemical sensing of nPS (100 nm-sized) using the MIP@PoPD@SPCE sensing electrode chip, as illustrated in Figure 5. To perform CA studies here, the identical parameters were adopted as applied in the case of nPS (500 nm-sized particle of nPS) sensing using the CA approach.
Figure 5A,B represent the sensing outcomes related to CA-based sensing of nPS (100 nm-sized particle of nPS) using MIP@PoPD@SPCE sensing electrode specific to 100 nm-sized nPS. Further, the outcomes of these experiments were utilized to establish a calibration curve (Figure 5C) between the rate of change of current and the varied concentration of nPS (100 nm). This calibration plot showed a good fit of the CA-based calibration curve (i.e., R2 = 0.746) and correlation (p-value < 0.05). This calibration curve also exhibited a sensitivity of 5.09 × 10⁻⁴ dA/dt /log(g/L), a wide detection range from 4.2 x 10⁻⁹ to 2.1 x 10⁻⁴ g/L, and a limit of detection of 4.2 × 10⁻⁹ g/L. Both DPV and CA studies related to the sensing of 100-nm-sized nPS are not acceptable due to a poor r2 value. But the MIP@PoPD@SPCE chips, fabricated using nPS of 100 nm as template material, can be utilized for the screening of 100 nm nPS in water samples.
To evaluate the selectivity of sensing electrodes, DPV studies were performed using a specific MIP@PoPD@SPCE sensing chip with reference to 100 nm and 500 nm-sized particles of nPS. In this process, two MIP@PoPD matrices were fabricated using 100 nm and 500 nm-sized nPS as template material to generate specific cavities. These chips were utilized for DPV-based sensing of nPS with reference to nPS (2.1 × 10⁻⁴ g/L) of both 100 nm and 500 nm PS in water (data not shown). In this cross-reactivity study, MIP@PoPD (fabricated using 500 nm PS) exhibited a difference in prominence when incubated with 100 nm and 500 nm nPS. It is observed that the MIP@PoPD@SPCE, fabricated using the 500 nm template, is responsive to 500 nm. In this case, the signal change, i.e., the difference in prominence between the sensing electrode and the sensing electrode with the targeted sample, was observed to be significantly higher. At the same time, the selectivity of MIP@PoPD-based sensing chips was also evaluated when a non-imprinted polymer (NIP) of PoPD was selected as the sensing chip. The NIP@PoPD@SPCE electrodes were fabricated using identical experimental conditions as optimized for the fabrication of MIP@PoPD@SPCE sensing electrodes. For the DPV-based sensing experiment, a 2.1 x 10⁻⁴ g/L concentration of 500 nm-sized nPS was selected to incubate in NIP@PoPD@SPCE and MIP@PoPD@SPCE sensing electrode systems (data not shown). The outcomes of this study suggest that the NIP@PoPD@SPCE system did not show any significant electrochemical change (in terms of prominence) at a low concentration of the 500 nm-sized nPS particles. However, the MIP@PoPD@SPCE-based sensing electrode showed a significant change in response current (in terms of prominence, from 4.155–4.492 µA).
To explore the aspects of real applications, the proposed MIP@PoPD@SPCE sensing electrodes (specific to 100 nm-sized particles of nPS) were utilized to detect 100 nm-sized nPS particles in the artificially prepared water samples. To prepare testing samples, lake water from Florida Polytechnic University in Lakeland, Florida, USA, was utilized. This test was performed using CV and DPV techniques and lake water samples containing 2.1 × 10⁻⁴ g/L of 100 nm-sized nPS and sensing chips that were specific to 100 nm-sized nPS particles (data not shown). These experiments were performed in PBS (pH = 7) only and PBS containing 5 mM of ferricyanide/ferrocyanide mixture (Fe (II)/Fe (III)) (data not shown). Such a performance, mediator-free and with mediator sensing, presents the broad applicability of the proposed sensors. An observed specific signal spike only in the case of adding nPS suggested the selectivity of the sensing chip. The magnitude of the current increase in both PBS and Fe (II)/Fe (III) is nearly identical, which suggests that either solution could be used for sensing applications. In summary, the proposed MIP@PoPD@SPCE chips can be transformed for the sensing of nPS in water samples in the POC setting.
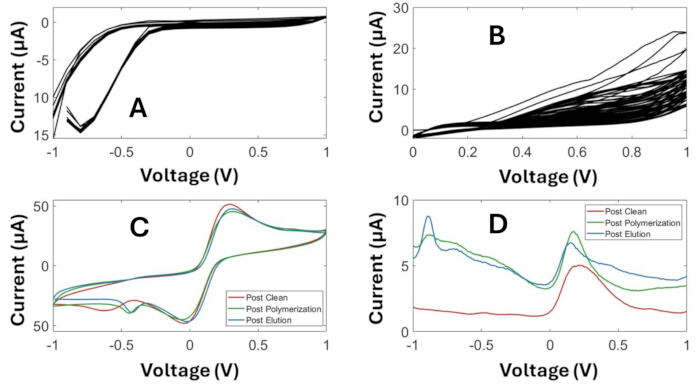
Figure 1: Electrochemical fabrication of MIP@PoPD@SPCE sensing electrode chip. (A) CV-based cleaning process, (B) CV-based electro-polymerization of oPD to PoPD, in the presence of nPS, onto SPCE, (C) CV-based characterization of PoPD@SPCE at various stages, including post-cleaning, post-polymerization, and post-elution, and (D) DPV-based characterization of the chip, including post-elution, polymerization, and cleaning stages. All the measurements were performed in triplicate (n = 3), and the graphs of identical signals were utilized in the analysis. Please click here to view a larger version of this figure.
This figure is adapted from Sanchez-Almirola et al.1.
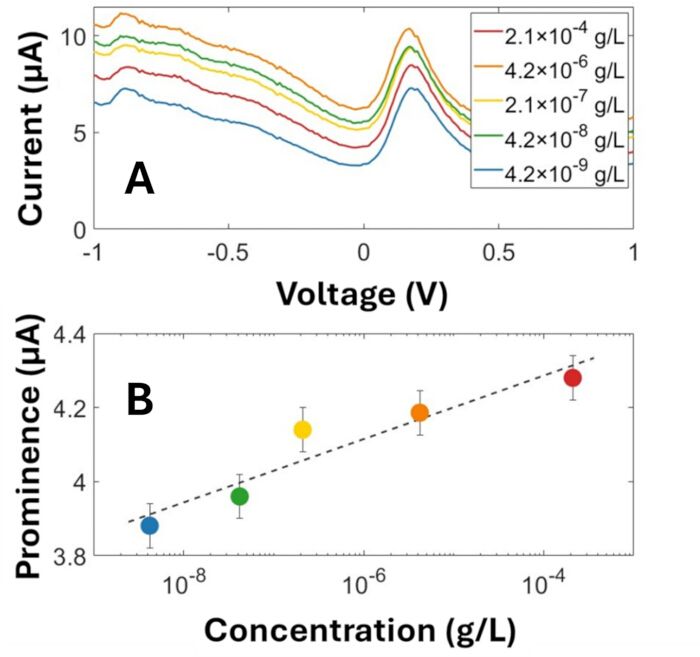
Figure 2: DPV-based electrochemical sensing of nPS (with reference to a 500 nm-sized template). (A) DPV-based electrochemical studies as a function of 500 nm concentrations in the presence of PBS containing 5 mM redox moieties, i.e., Fe(II)/Fe(III). (B) A calibration curve plotted between peak response current (prominence) and the log of nPS concentration. All the measurements were performed in triplicate (n = 3), and the graphs of identical signals were utilized in the analysis. The DPV scan peak prominence is plotted against the log of concentration with a linear regression fit (R2 = 0.902, p-value = 0.0135, RMSE = 0.0596). The data display a sensitivity of 0.037169 µA/log(g/L), a detection range from 4.2 × 10⁻⁹ to 2.1 × 10⁻⁴ g/L, a 5% error bar, and a limit of detection of 4.2 × 10⁻⁹ g/L. This figure is adapted from Sanchez-Almirola et al.1. Please click here to view a larger version of this figure.
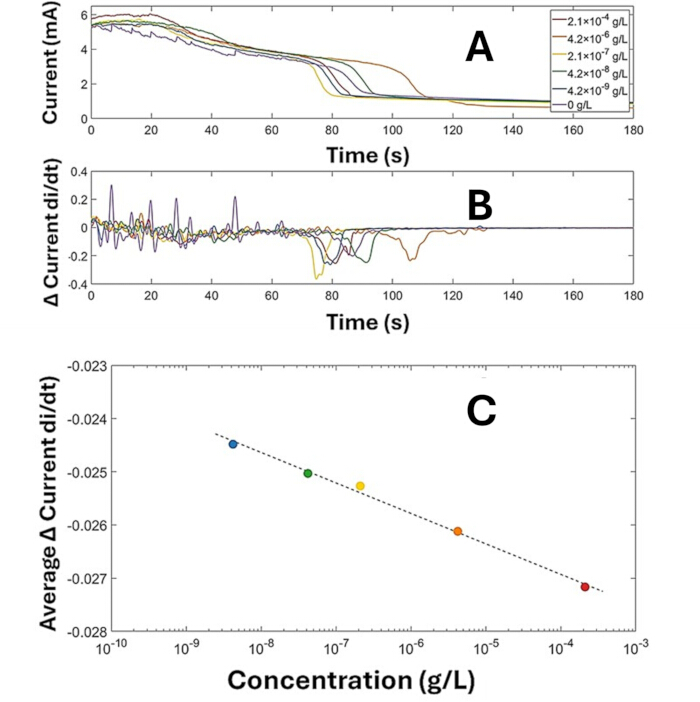
Figure 3: CA-based studies related to electrochemical sensing of nPS (with reference to 500 nm-sized particles of nPS). (A) CA pattern as a function of nPS (500 nm-sized) concentrations (at 10 V for 180 s) in the presence of PBS containing 5 mM redox moieties [Fe(II)/Fe(III)], (B) rate of current response change with reference to each concentration tested, and (C) a calibration curve plotted between the mean of change in current change for each concentration of nPS (500 nm-sized). All the measurements were performed in triplicate (n = 3), and the graphs of identical signals were utilized in the analysis. The mean rate of change of current for each concentration of 500 nm-sized nPS tested alongside a linear regression fit (R2 = 0.994, p-value = 0.000177, RSME = 9.05 × 10⁻⁵) with a sensitivity of – 5.09 × 10⁻⁴ dA/dt /log(g/L), a wide detection ranges from 4.2 × 10⁻⁹ - 2.1 × 10⁻⁴ g/L, and a limit of detection of 4.2 × 10⁻⁹ g/L. This figure is adapted from Sanchez-Almirola et al.1. Please click here to view a larger version of this figure.
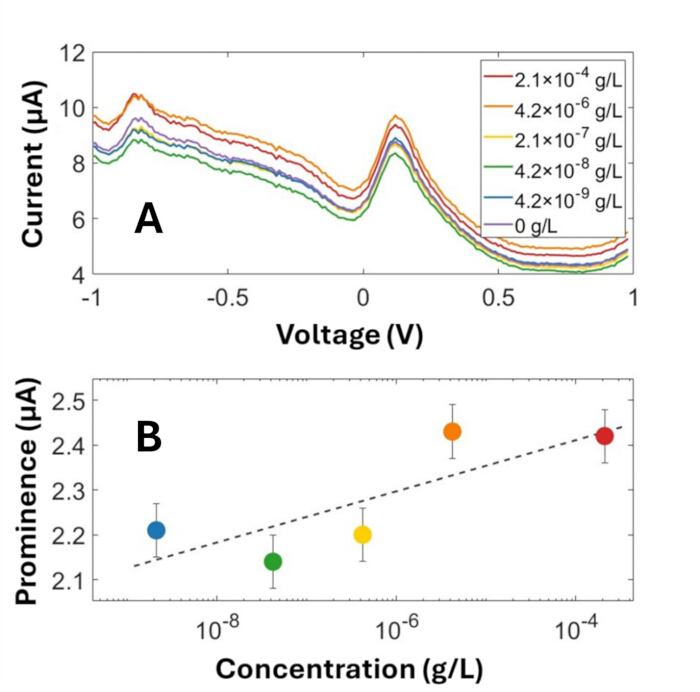
Figure 4: DPV-based electrochemical sensing of nPS (with reference to 100 nm-sized particles of nPS). (A) DPV-based electrochemical studies as a function of 100 nm-sized of nPS concentrations in the presence of PBS containing 5 mM redox moieties, i.e., Fe(II)/Fe(III). (B) A calibration curve plotted between peak response current (prominence) and the log of nPS concentration. All the measurements were performed in triplicate (n = 3), and the graphs of identical signals were utilized in the analysis. Calibration curve: DPV scan prominence plotted against the log of concentration with a linear regression fit (R2 = 0.738, p-value = 0.0284, RMSE = 0.081) using a 100 nm-sized template MIP. Thus, the plotted calibration graph shows a sensitivity of 0.0533 µA/log(g/L), a wide detection range from 4.2 × 10⁻⁹ to 2.1 × 10⁻⁴ g/L, a 5% error bar, and a limit of detection of 4.2 × 10⁻⁹ g/L. This figure is adapted from Sanchez-Almirola et al.1. Please click here to view a larger version of this figure.
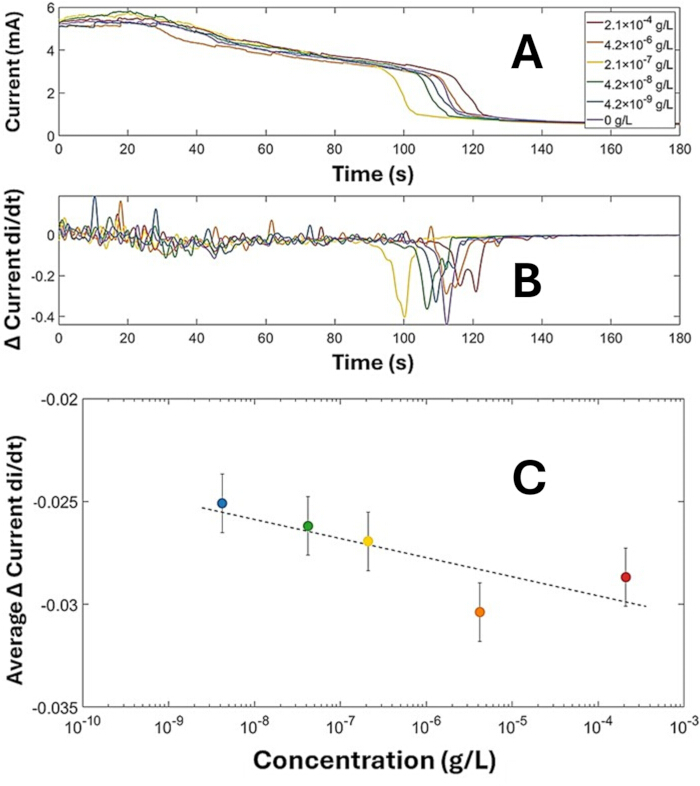
Figure 5: CA-based studies related to electrochemical sensing of nPS (with reference to 100 nm-sized particles of nPS). (A) CA pattern is as a function of nPS (100 nm-sized particles of nPS) concentrations (recorded at 10 V for 180 s) in the presence of PBS containing 5 mM redox moieties [Fe(II)/Fe(III)], (B) rate of current response change with reference to each concentrations tested, and (C) a calibration curve plotted between the mean of change in current change for each concentration of nPS (100 nm-sized particles of nPS). All the measurements were performed in triplicate (n = 3), and the graphs of identical signals were utilized in the analysis. Mean rate of change of current for each concentration of 100 nm tested alongside a linear regression fit (R2 = 0.746, p-value = 0.0266, RMSE = 0.00281) with a sensitivity of 5.09 × 10⁻⁴ dA dt /log(g/L), a detection range from 4.2 × 10⁻⁹ g/L to 2.1 × 10⁻⁴ g/L, error bar of 5%, and a limit of detection of 4.2 × 10⁻⁹ g/L. This figure is adapted from Sanchez-Almirola et al.1. Please click here to view a larger version of this figure.
| Metric | Electrochemical Sensing | FTIR Spectroscopy | Raman Spectroscopy | Pyrolysis-GC/MS |
| Data Output | Concentration / Particle Count | Particle Count, Size, & Chemical ID | Particle Count, Size, & Chemical ID | Total Polymeric Mass & Additives |
| Target Size Limit | Sub-micron | Micro-scale | Micro-scale | Independent of size (mass-dependent) |
| <100 nm | >10 µm | >1 µm | ||
| Analysis Speed | Minutes (Real-Time) | Hours (Scanning + Processing) | Hours (Mapping + Processing) | Hours (Thermal Extraction) |
| Equipment Cost | Low | High | High | Extremely High |
| <$1,000 | $40k - $150k | $50k - $200k | $150k - $300k |
Table 1: A comparative sensing performance of electrochemical polystyrene sensing in comparison with the other techniques adopted for polystyrene detection.
Discussion
In this research, the design and development of an MIP-based electrochemical sensor for nPS in water samples are demonstrated. Two separate chips, including (1) MIP@PoPD@SPCE with reference to 100 nm-sized nPS as template materials, and (2) MIP@PoPD@SPCE with reference to 500 nm-sized nPS as template materials. In the process, the step-by-step characterization of each MIP fabrication and sensing of nPS was performed using CV-based and DPV-based electrochemical studies. In the process, one of the areas of attention is focused on exploring the electrochemical nature of SPCE, PoPD, and nPS. The results of the CV and DPV studies show that the magnitude of SPCE increases upon adding nPS to the electrolyte. This confirms the electroactive nature of nPS. Microplastics (MPs) are, in general, considered insulating materials; however, for m/n-PS, it is observed that their presence instead increases electrochemical signal magnitude, with reference to the MIP@PoPD@SPCE system. The behavior can be correlated with the enhanced properties of nPS when an electric field is applied, which is based on a careful discussion and analysis of the literature. These nPS (100 nm and 500 nm-sized nPS) exhibit different properties, like tunable surface charge and radicalization under different conditions (such as an electric field), and enhance electron transport. It is observed in the CV-based electrochemical studies of nPS@PBS@MIP@SPCE that a shift in the peak position and an increment in the magnitude of current take place. Additionally, in the DPV-based electrochemical studies, the electrochemical signal magnitude of nPS@PBS@MIP@SPCE increases to approximately 4 times that of PBS without nPS. These outcomes confirm that nPS is behaving as an electroactive material in the presence of a potential difference and an electrolyte solution.
The electro-polymerization of oPD creates a polymeric network, PoPD. The same electro-polymerization of oPD, along with nPS, produces a polymeric system with nPS (100 nm and 500 nm particles) embedded within it. Further, the removal of nPS from the PoPD plus nPS system through the elution process results in the fabrication of specific cavities within PoPD. These cavities are specific regarding the size, orientation, and overall shape of the nPS particles. After elution, the MIP of PoPD (which specifically targets the original template molecules of both 100 nm and 500 nm-sized particles of nPS) is fabricated onto the SPCE. To confirm that the fabrication of the MIP@PoPD@SPCE sensing electrode system has been successful, various electrochemical studies were conducted systematically. The outcomes of these experiments were analyzed with reference to the bare SPCE. The analytical assessment suggested that there is an electrochemical response change at every stage of MIP@PoPD@SPCE fabrication. As the main observation, the magnitude of the electrochemical response of PoPD (with nPS)@SPCE increases due to the presence of nPS on the electrode surface. Further, the magnitude of the electrochemical response of MIP@PoPD@SPCE decreased a bit compared to MIP@PoPD@SPCE, caused by the removal of electroactive nPS from the polymeric (PoPD) matrix. Such observed electrochemical behavior confirmed the fabrication of the MIP@PoPD@SPCE chip that will be utilized for the electrochemical sensing of nPS in water samples.
A complete process of PoPD and MIP@PoPD systems fabrication involves various surface changes and modifications, and such variations were confirmed based on the findings of Raman Spectroscopy and Raman Imaging. In the case of PoPD, Raman spectroscopic curves showed all the peaks associated with the functional groups of PoPD polymeric systems and agreed with the literature on PoPD (data not shown). The Raman Spectroscopic curve of MIP@PoPD exhibited all the peaks associated with the functionality of PoPD and nPS (data not shown). This confirms that all the nPS embedded in the PoPD matrix were not removed through the elution process. The nature of nPS has been investigated, as illuminated under exposure to light. Such a feature was also observed while Raman imaging of MIP@PoPD and the setting of nPS within MIP@PoPD, which confirmed the presence of nPS on the sensing chip.
In this study, while performing PS sensing using the MIP@PoPD platform with the CA and DPV approach, it is observed that the magnitude of the electrical signal increases as the nPS concentration increases on the chip surface. Such an observed electrochemical signal is related to the presence of nPS in PBS, which generates a microenvironment that facilitates transport, increasing the magnitude of the SPCE signal. At the same time, while electrochemical sensing of nPS (100 nm and 500 nm-sized particles of nPS) using the respective MIP@PoPD@SPCE sensing chip, an increment in the magnitude of the electrical signal of the MIP@PoPS@SPCE chip was also observed once the nPS was incubated within the MIP@PoPD network.
To provide an explanation that can justify such an enhanced electrochemical response, we have carefully reviewed the literature. It is observed that nPS becomes electroactive when an electric field is applied. An increase in the electrical signal with reference to MIP@PoPD is observed, which is related to the alignment of nPS within the cavities of MIP and the possibility of nPS interaction with the PoPD as well. As discussed above, the applied electric field can generate electroactive sites on nPS, which can facilitate electron transport during an electrochemical measurement. Besides, several factors can also justify the role of nPS associated with the increment in the magnitude of the electrical signal of the MIP@PoPD@SPCE chip. At the same time, the interaction of nPS with a polymeric matrix also plays a significant role in exploring the scientific reasoning of an electrochemical process. On this track, nPS and PoPD blending creates π-π stacking interactions that can enhance electron transport. This extended π-π networking results in easy oxidation when an electric field is applied during an electrochemical process. Additionally, the applied electric field generates various electroactive sites in nPS and nPS@MIP@PoPD, and overall could support electron transport.
The electrochemical sensing of nPS (500 nm-sized particles of nPS) using MIP@PoPD@SPCE, fabricated using 500 nm nPS as a template material, exhibited an acceptable mathematical model (in terms of regression coefficient value) based on concentration ranges from 4.2 x 10⁻⁹ to 2.1 x 10⁻⁴ g/L. At the same time, the electrochemical sensing of nPS (100 nm-sized particles of nPS) using MIP@PoPD@SPCE, fabricated using 100 nm nPS as a template material, exhibited a distinct signal change as a function of concentration ranging from 4.2 x 10⁻⁹ to 2.1 x 10⁻⁴ g/L. However, the generated mathematical model is not acceptable due to poor regression coefficients. The selectivity of both types of sensing generated was evaluated in the following two ways: 1) the effect of 100 nm PS and 500 nm nPS was evaluated on each sensing chip using DPV techniques. The results confirmed that the MIP@PoPD@SPCE sensing chip, specific to 500 nm-sized nPS cavities, exhibited a very good response to 500 nm-sized nPS and an electrochemical signal change with reference to 100 nm-sized nPS. These observations suggest that a MIP@PoPD@SPCE, against 500 nm nPS, is a good sensing chip for selective detection of 500 nm nPS and screening of 100 nm-sized nPS.
In this approach, nPS sensing is selective due to specific cavities generated within PoPD, mainly, and does not relate to the interaction between nPS and PoPD. Therefore, a non-imprinted polymer (NIP), which means only PoPD was deposited onto the SPCE, was evaluated for its electrochemical behavior as a function of nPS concentration (2.1 x 10⁻⁴ g/L concentration of 500 nm-sized particles of nPS). The results of DPV studies (in terms of prominence) confirmed that MIP@PoPD is more responsive to nPS than the NIP. This means that an MIP approach is more selective and adaptable, allowing selective sensing of nPS due to the specific entrapment of nPS within the specific cavities, which are fabricated against the shape, size, and orientation of nPS.
To project a real-world application, as a proof-of-concept, the fabricated sensors were tested using lake water samples that have 2.1 × 10⁻⁴ g/L of 100 nm-sized particles of nPS. The results of the CV and DPV studies confirmed that every sample affects the electrochemical signal, but the samples with nPS affect the electrochemical signal significantly, which confirms the selectivity of the developed sensors with reference to nPS. The proposed method is based on published prototype research, and validation of the developed sensing systems is still in process and is part of a second phase of research of the project. The outcomes of the second phase of the project will be published elsewhere in the future.
In conclusion, this method successfully demonstrates the electrochemical sensing of 100 nm and 500 nm-sized particles of nPS particles using the MIP-based electrochemical sensing approach. In this sensing method, an MIP of PoPD was fabricated electrochemically onto a customized SPCE using oPD as a monomer and nPS (100 nm and 500 nm-sized) as template materials. Every step related to MIP@PoPD fabrication was performed systematically and characterized using advanced analytical techniques, including CV, DPV, CA, and Raman Spectroscopy. The outcomes of these studies explore the electrical properties of the sensing chip, associated surface changes, and the sensing mechanism. Both sensing electrodes, i.e., the MIP@PoPD@SPCE (specific to 100 nm and 500 nm-sized nPS particles), are utilized for the selective sensing of specific nPS particles in the concentration range of 4.2 x 10⁻⁹ – 2.1 x 10⁻⁴ g/L within a few minutes of operation time. The analysis of sensing outcomes suggests that the MIP@PoPD@SPCE system, specific to 500 nm-sized nPS, is more acceptable mathematically. In comparison, the sensing chip specific to 100 nm-sized nPS particles can be adopted for the screening of 100 nm nPS.
The sensing outcomes achieved using CA and DPV agree with each other, and either technique can be adopted for real applications. At the same time, the electrochemical sensing of MIP is distinct from the signal observed in the case of NIP. Therefore, MIP-based sensing is acceptable as expected for selectivity. To explore the real-world application, as a proof of concept, this MIP@PoPD-based electrochemical sensing is performed using artificial samples prepared using known nPS and the lake water of Florida Polytechnic University. The observed signal is very distinct, which suggests the selectivity of the developed sensing electrodes.
Herein, the reported electrochemical sensing can be performed using a portable electrochemical workstation that can be operated using a smartphone or tablet; therefore, the proposed system can be adopted for PoC and PoU applications. In the future, efforts will be made to establish this sensing methodology using an ultra-small MEP. Such a handheld MEP can be operated using a smartphone, which can enable POC, PoN, or PoU sensing, desired data collection, rapid analytics, and decision-making policies14,15.
Disclosures
The authors of this article declare no conflict of interest.
Acknowledgements
The funding, i.e., AW-2000022, GR-23SUMR-AK, and GR-24SUMR-AK, received from the Florida Polytechnic University and the Fulbright Foreign Scholarship Board for the Fulbright Specialist Program Award, is acknowledged in this article. The authors declare that this method is based on a published research article and a granted USA patent (US 12,523,590B1). The authors also acknowledge the contribution of Mr. Mustapha Achoubane, Senior Global Affairs Officer, Florida Polytechnic University, for assistance in getting the Fulbright Specialist Award.
Materials
| Name | Company | Catalog Number | Comments |
|---|---|---|---|
| Data Analysis | MATLAB | ||
| DI Water | Milipore located at Florida Polytechnic University | ||
| Electrochemical Analyzer | PalmSens4 potentiostat (Houten, Netherlands) | ||
| Ethanol | Sigma Aldrich | 459836 | |
| Hydrochloric Acid (HCL) | Sigma Aldrich | 7647-01-0 | |
| Methanol | Sigma Aldrich | 423950010 | |
| O-phenylenediamine (oPD) | Sigma Aldrich | 615-28-1 | |
| phosphate buffer saline (PBS) tablets | Sigma Aldrich | MFCD00131855 | |
| Polystyrene as microplastic (100 nm) | Sigma Aldrich | 43302 | |
| Polystyrene as microplastic (500 nm size) | Sigma Aldrich | 59769 | |
| Potassium Ferricyanide | Sigma Aldrich | 13746-66-2 | |
| Potassium Ferrocyanide | Sigam Aldrich | 14459-95-1 | |
| Raman Spectrophotometrs and Microscope | LabRAM HR Evolution, Horiba Scientific | ||
| Screen-Printed Carbon Electrode | BASi Instrumetation | PALM-IS-C U/M EA - ItalSens Carbon Electrodes |
References
- Sanchez-Almirola J, Orr R, Mujawar M, Casals-Terré J, Voronine DV, Kaushik A. MIP-assisted electrochemical sensing of micro/nano-microplastic (polystyrene) for environmental surveillance. Sens Actuators A Phys. 2026;398:117305.
- Kaushik A, Singh A, Gupta VK, Mishra YK. Nano/micro-plastic, an invisible threat getting into the brain. Chemosphere. 2024;361:142380.
- Sharma B, Mangla S, Aery S, Sharma C, Kaushik A, Kumar S, Chaudhary GR. Advanced tools and methodologies for identification, characterization, and quantification of micro/nano plastics in environmental matrices. Adv Colloid Interface Sci. 2026;347:103716.
- Lee A, Orr R, Sanchez-Almirola J, Casals-Terré J, Kaushik A. Can smart electrochemical sensors sustainably tackle PFAS-@microplastics? ECS Sens Plus. 2025;4(3):033402.
- Noumani A, Verma D, Kaushik A, Khosla A, Solanki PR. Electrochemically microplastic detection using chitosan-magnesium oxide nanosheet. Environ Res. 2024;252:118894.
- Motalebizadeh A, Fardindoost S, Hoorfar M. Selective on-site detection and quantification of polystyrene microplastics in water using fluorescence-tagged peptides and electrochemical impedance spectroscopy. J Hazard Mater. 2024;480:136004.
- Du H, Chen G, Wang J. Highly selective electrochemical impedance spectroscopy-based graphene electrode for rapid detection of microplastics. Sci Total Environ. 2023;862:160873.
- Xiao Z, Chen Y, Zhang Y. Self-powered portable photoelectrochemical sensor based on dual-photoelectrode for microplastics detection. Environ Res. 2025;271:121084.
- Surucu O. Electrochemical analysis of PET microplastics and detection of elements in PET bottles. Microchem J. 2025;208:112422.
- Ben Moussa F, Beduk T, Sena-Torralba A, Beduk D, Ait Lahcen A, Kutner W, Kaushik A. Beyond single-analyte detection: advancing molecularly imprinted polymers for simultaneous multi-target sensing. TrAC Trends Anal Chem. 2025;185:118177.
- Dixit CK, Bhakta S, Reza KK, Kaushik A. Exploring molecularly imprinted polymers as artificial antibodies for efficient diagnostics and commercialization: a critical overview. Hybrid Adv. 2022;1:100001.
- Ahmed S, Ansari A, Li Z, Mazumdar H, Siddiqui MA, Khan A, et al. Point-of-care health diagnostics and food quality monitoring by molecularly imprinted polymers-based histamine sensors. Adv Sens Res. 2024;4(2):2400132.
- Sanchez-Almirola J, Gage A, Lopez R, Yapell D, Mujawar M, Kamat V, Kaushik A. Label and bio-active free electrochemical detection of testosterone hormone using MIP-based sensing platform. Mater Sci Eng B. 2023;296:116670.
- Kaushik A, Soundappan T, Mujawar M, Bhansali S. Standing of electrochemical sensors on the 250th anniversary of the USA. J Electrochem Soc. 2026;173(9):097509.
- Kaushik AK, Almirola JSS. Sensing plastics with electrode sensor to monitor fluid environments. United States Patent US 12,523,590. 2026.
Reprints and Permissions
This article has been published
Video Coming Soon