A continuous bioelectrochemically-enhanced anaerobic digestion (BEAD) system was developed for brewery wastewater treatment, demonstrating improved chemical oxygen demand removal, volatile fatty acid degradation, methane production, and energy efficiency compared to conventional anaerobic digestion under ambient-temperature operation.
Research Article
Bioelectrochemically Enhanced Anaerobic Digestion of Brewery Wastewater at Ambient Temperature: Performance, Methane Yield, and Energy Efficiency
In This Article
Summary
Abstract
Bioelectrochemically-enhanced anaerobic digestion (BEAD) has emerged as a promising approach to improve methane production and process stability during the treatment of high-strength industrial wastewater. In this study, a continuous upflow BEAD reactor was operated for 365 days to evaluate its performance in treating real brewery wastewater at ambient temperature (22–24 °C). The effects of organic loading rate (OLR; 1–7 g sCOD/L∙d), hydraulic retention time (HRT), and applied potential (1.2 V) on organic matter removal, volatile fatty acid (VFA) degradation, methane production, and energy efficiency were systematically investigated and compared with conventional anaerobic digestion (AD). The BEAD system achieved high chemical oxygen demand (COD) removal efficiencies (>92%) at OLRs up to 5 g sCOD/L∙d and demonstrated superior degradation of complex VFAs, particularly propionic and butyric acids. Methane yield increased with increasing OLR, reaching a maximum of 0.35 LCH₄/g sCODRemoved at an OLR of 7 g sCOD/L∙d. Compared with AD, BEAD enhanced methane production by 16–30% at higher OLRs while maintaining stable biogas quality (≈74–75% CH₄). Although shortening HRT at high OLRs reduced overall performance, BEAD consistently outperformed AD. The system exhibited high energy efficiency (~1000%), suggesting it could serve as a robust, highly energy-efficient candidate for brewery wastewater treatment in cold regions.
Introduction
Water pollution remains a significant global concern, harming human health and disrupting ecosystems. The brewing industry ranks among the largest industrial wastewater generators, producing 3–10 L of wastewater per liter of beer1,2. The global consumption of beer resulted in the production of 188 Mm3 of beer in 2023, ranking as the fifth most consumed beverage worldwide3,4. Beer is also a popular beverage in Canada, as evidenced by the increase in the number of breweries from 1,120 in 2019 to 1,210 in 20205.
Breweries primarily manage their wastewater by discharging it into municipal sewer systems, either directly or after pretreatment. However, conventional wastewater treatment plants (WWTPs) often struggle with high-strength industrial effluents, leading to regulatory limits in many countries2,6,7. In many cases, municipal governments may impose surcharges on high-strength effluents to discourage such discharges, potentially leading to increased operational costs for breweries8. Therefore, breweries must take measures to manage their wastewater more effectively and at a lower cost. Installing on-site treatment systems that not only reduce pollutant loads but also harness the energy potential of organic compounds in the brewery wastewater offers a viable alternative9.
Anaerobic processes can effectively treat high-strength wastewater with low energy consumption while converting waste into biogas, which can then be transformed into electricity, renewable gas, or thermal energy10. Anaerobic digestion (AD) is an indirect interspecies electron transfer (IIET) process in which intermediates transfer electrons between acidogenic bacteria and methanogenic archaea through complex enzymatic reactions11. However, these reactions face thermodynamic limitations that prevent the complete transfer of electrons from the initial substrates to methane, leading to notable electron losses and reduced methane production12. AD stability is influenced by these electron transfer mechanisms, and disruptions often lead to the accumulation of intermediates, such as hydrogen or VFAs (volatile fatty acids). The imbalance between acidogenic bacteria and methanogens is a primary factor contributing to this accumulation. High organic loading rates (OLRs) in the brewery wastewater can exacerbate this imbalance, exceeding the methanogens’ capacity to utilize the produced VFAs13.
Bioelectrochemically enhanced anaerobic digestion (BEAD) uses direct interspecies electron transfer (DIET) to transfer electrons directly from organic substrates to methane, bypassing the slower and less efficient IIET in conventional AD. In DIET, electrons are transferred directly between microbial species via cytochromes, conductive pili, or multispecies aggregates without the need for an intermediary electron shuttle12. BEAD systems use external electrical currents to enhance the degradation of short-chain VFAs, such as butyrate and propionate, making the process more stable than conventional AD14,15,16. Additionally, BEAD systems promote microbial syntrophic interactions, which accelerate methane production from improved overall VFA breakdown17. Studies have shown that BEAD can boost methane yields compared to conventional AD due to additional methanogenesis pathways, such as direct electron uptake from electrodes (electromethanogenesis)18,19.
Research on brewery wastewater in BEAD is limited, with most studies conducted at mesophilic temperatures (30–35 °C) or using synthetic wastewater20,21,22,23,24,25. While Mesophilic conditions are ideal for various microorganisms, optimizing the BEAD system at room temperature (22–24 °C) is crucial for practical applications, particularly in cold regions such as Canada. Furthermore, using real brewery wastewater offers a more accurate representation of the challenges found in real-world scenarios. This study aims to fill key gaps by evaluating critical parameters for treatment and methane production from real brewery wastewater in a BEAD reactor at room temperature.
Organic loading rate (OLR) is an important operational parameter in BEAD systems, reflecting the system’s capacity to process organic compounds effectively. A high OLR can lead to excessive acid buildup, potentially hindering methanogenesis. Therefore, it is crucial to manage the OLR to achieve optimal treatment efficiency and methane production26,27. Researchers mostly investigated the impact of OLR on BEAD performance using a synthetic mixture of organic acids28,29,30,31, waste-activated sludge (WAS)26, tomato plant residues32, food waste33, and garbage slurry34. Most studies on BEAD with brewery wastewater have employed low OLRs, and only one study evaluated the impact of different OLRs on BEAD efficiency treating brewery wastewater. Pan et al.22 reported that the methane production gradually increased with OLR, reaching 5.64 L/L∙d at an OLR of 20 g COD/L∙d, outperforming the conventional AD under mesophilic conditions (35 °C). In addition, while AD performance declined at elevated OLRs, the BEAD system remained stable even at higher OLRs. To the best of our knowledge, no study has explored the impact of OLR on BEAD performance using real brewery wastewater at room temperature. Therefore, this study aims to examine how different OLRs affect the breakdown of real brewery wastewater and subsequent methane production at room temperature.
Applied voltage is another important operational parameter in the BEAD systems. The applied voltage promotes the growth of hydrogenotrophic methanogens, thereby increasing process stability. Moreover, the supplied voltage affects methane production as well as internal resistance within the system35,36,37. Only a limited number of studies have explored how the absence/presence of voltage impacts BEAD performance with brewery wastewater20,21,25. For example, Guo et al.21 tested three BEAD reactors with varying cathode-to-anode ratios of 1, 2.5, and 4 cm2/cm3 at 35 °C using synthetic brewery wastewater, finding that a closed-circuit setup (0.9 V) increased methane production by 42%, 121%, and 61%, respectively, compared to an open circuit (0 V). However, research using real brewery wastewater at room temperature remains limited, highlighting the need for further investigation.
The main objective of this study was to investigate the feasibility and performance of a bioelectrochemically enhanced anaerobic digestion (BEAD) system for treating real brewery wastewater at room temperature (22–24 °C). Compared with previous BEAD studies primarily conducted under mesophilic conditions, this study emphasizes the long-term operation of BEAD at ambient temperature, which is of particular engineering significance because it avoids the need for continuous reactor heating and reduces energy demand. Specifically, the study evaluated the effects of different organic loading rates (OLRs) and the impact of applied voltage on wastewater degradation, process stability, and methane production. By operating a BEAD reactor under controlled conditions, this study aimed to identify optimal operational parameters that enhance volatile fatty acid (VFA) breakdown and methane yield while maintaining system stability. The findings are expected to provide practical insights into the application of BEAD technology for on-site brewery wastewater treatment.
Protocol
Ethics approval was not required for this study as it did not involve human participants or animal subjects. The wastewater and sludge samples were collected and treated in accordance with standard laboratory safety protocols.
Feed and inoculum
Initially, sodium acetate was used as a supplementary carbon source to initiate microbial activity in the reactors. After reactor start-up, real brewery wastewater obtained from Dominion City Brewing Co., Ottawa, was incrementally introduced, gradually replacing the sodium acetate (approximately 5 days). The characteristics of the brewery wastewater samples (Table 1) varied with each batch (17 batches in total), allowing assessment of system adaptability to real-world conditions. At Dominion City, solids such as hops and yeast are separated before the wastewater is collected into two final tanks. Batch samples were taken from these tanks, transported to the lab, and centrifuged at 12,000 × g under room temperature (22 °C) to remove residual solids. The resulting supernatant was stored at 4 °C until use. The inoculum was mesophilic anaerobically digested sludge collected from the Robert O. Pickard Environmental Centre (ROPEC) in Ottawa. Prior to its introduction, the sludge was acclimatized with the centrifuged brewery wastewater in 500 mL glass bottles for 14 days at 480 × g under room temperature (22 °C).
Reactor configuration
This study used a single-chamber upflow BEAD reactor made from cylindrical glass (435 mm height, 54 mm diameter), with a total volume of 1 L and an effective working volume of 0.65 L. The influent was fed into the reactor using a peristaltic pump and controlled using a digital timer to control the feed rate. To enhance mixing and gas-liquid mass transfer, a recirculation loop connected the top and bottom of the reactor (Figure 1A), maintained at 70 mL/min using a second peristaltic pump. Electrodes consisted of stacked 25 mm × 25 mm carbon felt squares, to a total height of 130 mm (Figure 1B,C). A 3 mm thick non-conductive geotextile separator with 2 mm perforations was placed between the anode and cathode to prevent contact, resulting in an electrode spacing of 3 mm. The anode was positioned above the cathode to prevent hydrogen gas from escaping to the gas bag, given hydrogen’s low solubility in water. A 1 mm thick titanium wire coated with iridium mixed metal oxide (Ir-MMO) was inserted into the carbon felt and served as the current collector for both electrodes. The current collectors were connected to a potentiostat (AUTM101.S, Metrohm, Switzerland), which was used to apply and maintain a controlled potential across the electrodes and continuously monitor the electrochemical response of the system. An applied voltage of 1.2 V was maintained between the anode and cathode throughout reactor operation. The AD reactor, used as the control group in this study, had the same configuration as the BEAD reactor but was operated without an applied potential.
Experimental design and procedure
The study was conducted over 365 days, including 17 operational phases (10–20 days each) across three main stages, each assessing BEAD reactor performance under different operational conditions. Prior to data collection, each phase was operated until stable conditions were achieved. This extended duration enabled evaluation of BEAD long-term performance and stability, in contrast to typical short-term or batch-mode studies. The use of multiple batches of real brewery wastewater introduced compositional variability; however, reactor performance was evaluated under steady-state conditions within each phase, ensuring that the reported results reflect stable system behavior rather than short-term fluctuations.
Startup phases: Reactor startup (impact of influent VFA/sCOD ratio)
The BEAD reactor was inoculated with 350–400 mL of pre-acclimatized anaerobic sludge. Initially operated in batch mode with sodium acetate and an applied potential of 1.2 V, the system maintained a high HRT of 16 days to support the growth of electroactive microorganisms while minimizing biomass washout. After two weeks, the reactor transitioned to continuous-flow operation, using sodium acetate at an OLR of 2 g sCOD/L∙d with a daily flow rate of 120–130 mL, resulting in an HRT of 5 days. Once stable, the feed was gradually replaced with brewery wastewater: first at 70%/30% (acetate/wastewater), then at 50%/50%, and finally at 80%/20% before reaching 100% brewery wastewater (Table 2). This stage also assessed the impact of different influent VFA/sCOD ratios on BEAD performance, as sodium acetate has a simpler VFA composition than the more complex VFAs in brewery wastewater, which influence microbial activity and methane production. The results of this stage have been discussed in Supplementary File 1 (Supplementary Figures 1–5 and Supplementary Table 1)12,38,39,40,41,42.
When the feed was switched to 100% brewery wastewater at an OLR of 2 g sCOD/L∙d, the methane yield dropped compared to the acetate-only feed. Inhibition tests, Supplementary File 1 (Supplementary Table 2), confirmed that inhibition from brewery wastewater was not the primary issue. Hence, the OLR was increased to stimulate microbial activity with a higher substrate availability. Reactor recovery and inhibitory tests were conducted during a three-month gap between phases 5 and 6. During this period, the reactor was continuously operated under controlled conditions using brewery wastewater, while additional experiments were conducted to evaluate potential inhibitory compounds, including total ammonia nitrogen (TAN), sulfate, sulfide, hydrogen peroxide (H₂O₂), and peracetic acid (PAA). The results confirmed that none of these compounds were present at inhibitory concentrations. The reactor was maintained under stable operating conditions until steady-state performance was re-established, as indicated by consistent methane production, COD removal, and VFA degradation. The subsequent experimental phases were resumed only after confirming that the reactor performance had stabilized and was comparable to pre-gap conditions. Data from this recovery and testing period were omitted from the analysis to ensure consistency across defined operational phases.
Stage 1: Impact of OLR
In this stage, the BEAD reactor was fed exclusively with brewery wastewater to explore the effect of varying OLRs (1–7 g sCOD/L∙d) under an applied potential of 1.2 V (Table 2). The variation in brewery wastewater COD levels also led to fluctuations in HRT, particularly at the highest OLR (7* g sCOD/L∙d), where experiments were conducted under two HRTs of 2 and 4 days (* indicates different HRT at the same OLR of 7 g sCOD/L∙d; 7 g sCOD/L∙d is HRT at 3–4 days, 7* g sCOD/L∙d is HRT at 2 days). This allowed evaluation of how HRT influenced methane production, substrate degradation, and overall efficiency of the process.
Stage 2: Impact of applied potential
This stage evaluated the effect of the presence or absence of applied potential (1.2 V) on reactor performance and methane production using brewery wastewater. The control reactor without applied potential (AD) and the BEAD reactor were tested at OLRs of 2, 3, 5, and 7 g sCOD/L∙d. The AD control was operated as a separate reactor with the same configuration as the BEAD reactor, but without an applied potential. Both reactors were operated in parallel under comparable conditions. Moreover, at an OLR of 7* g sCOD/L∙d, the HRT was reduced from 4 days to 2 days, allowing for an investigation into the impact of applied potential under a shorter HRT (Table 2).
Analytical methods
Total Solids (TS) and Volatile Solids (VS) were measured using Standard Method 168443. Soluble COD (sCOD) was analyzed using the COD Standard Method44 with reagent tubes. Before analysis, the samples were filtered using a vacuum filter equipped with a 0.45 µm pore-size membrane. Ammonia concentration was determined using the ammonia reagent kit45. Sulfate was measured using the sulfate reagent kit46. Sulfide was analyzed using the sulfide reagent kit47. All HACH analyses were performed using the spectrophotometer. Hydrogen peroxide and peracetic acid were measured using the peracetic acid test kit via the dropper bottle method. The biogas was collected in a gas collecting bag, and its volume was quantified using a gas-tight syringe every day, with all measurements performed in triplicate. The biogas composition was analyzed using a micro Gas Chromatograph (GC), with argon as the carrier gas, a TCD detector, and an injection temperature of 110 °C. Biogas volumes were measured directly from gas collection bags and are reported as measured values under consistent laboratory conditions. Gas volumes are reported on a wet basis. All gas measurements were conducted under near-atmospheric pressure conditions, and airtight connections were maintained to minimize gas leakage. The system was regularly checked to ensure sealing integrity throughout the experiment.
VFAs, including acetate, propionate, and butyrate, were quantified using high-performance liquid chromatography (HPLC) with an absorption wavelength of 210 nm. The mobile phases comprised 100% acetonitrile and 2.5 mM methanesulfonic acid, and the analysis was performed using a column (5 µm, 4 mm × 150 mm) at 30 °C with a constant flow rate of 1 mL/min for the mobile phase. The pH and temperature of the reactor were continuously monitored using a meter. During reactor operation, the pH was maintained within a typical range of 6.5–7.5, indicating stable operating conditions. The current generation was recorded every 5 min using a potentiostat, under a fixed applied potential of 1.2 V.
Calculations
The COD removal efficiency and rate were determined using the following equations:
 Eq. 1
Eq. 1
 Eq. 2
Eq. 2
Feed OLR was calculated using Equation 3, as shown below, where the feed rate is expressed in liters per day (L/d) and reactor volume in liters.
 Eq. 3
Eq. 3
The following equations were used to calculate specific methane yield based on COD removed (LCH4/g sCODRemoved), and COD added (LCH4/g sCODAdded):
 Eq. 4
Eq. 4
 Eq. 5
Eq. 5
Where is the volume of methane produced per day (LCH4/d) and and are the amount of sCODRemoved per day (g sCODRemoved/d) and sCOD entering the reactor per day (g sCODAdded/d), respectively.
Current density was calculated by normalizing the measured current (I) in amperes (A) to the working volume of the reactor (V), expressed in cubic meters (m3). The current density is reported in A/m3 and is described by the following equation:
 Eq. 6
Eq. 6
Coulombic efficiency (CE) was calculated to assess the efficiency of electron recovery as current from the CODRemoved. It is defined as the ratio of the total charge (in Coulombs) recovered as current (QC) to the theoretical charge that could be recovered based on the COD removed (QT). The total recovered charge (QC) was determined by integrating the measured current over time:
Qc = ∫I(t)dt ≈ ∑Ii × ∆t Eq.7
where is the measured current (A) at each time interval, and Δt is the recording interval (s).
The theoretical charge (QT) was calculated based on COD removal, assuming that 1 mol of electrons is transferred per 8 g of CODRemoved, according to Faraday’s law:
 Eq.8
Eq.8
where F is Faraday’s constant (96,485 C/mol e⁻), and is expressed in grams.
Thus, CE was calculated as:
 Eq. 9
Eq. 9
Energy efficiency (ηE), defined here as the electrical-to-methane energy conversion efficiency, is used to evaluate the effectiveness of converting electrical input into additional methane production in the BEAD system. It is defined as the ratio of the energy produced in the form of methane to the energy consumed by the system to maintain electrochemical processes. It should be noted that the reported energy efficiency represents a partial energy balance focused on electrical input, and does not account for other operational energy demands (e.g., pumping and recirculation). Therefore, it should not be interpreted as the overall system energy efficiency. The energy efficiency was calculated using the following formula:
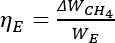 Eq. 10
ΔWCH4 = ΔVCH4 × LHV Eq. 11
WE = I × E × ∆t Eq. 12
where:
ΔWCH4 represents the energy recovered in the BEAD, the difference in energy produced as methane between the BEAD reactor and the AD control reactor, measured in watt-hours (Wh).
ΔVCH4 denotes the difference in methane volume produced between the BEAD reactor and the AD control reactor, expressed in liters (L).
LHV is the lower heating value of methane, approximately 9.6 Wh/L.
WE is the amount of electric energy consumed by providing applied potential, measured in watt-hours (Wh), E is voltage in volts (V), and Δt is the interval time (24 h).
Statistical analysis
Data collected from the experiments were statistically analyzed using ANOVA (Analysis of Variance) to evaluate the significance of operational parameters such as OLR, applied potential, and HRT on key performance indicators, including methane yield, COD removal, and VFA degradation. Stable data points were defined as consecutive measurements obtained under steady-state conditions, where key parameters showed variations of less than ±5% over time. Three stable data points from each phase, representing serial measurements from the same reactor under steady-state conditions, were selected and averaged to represent that phase. It should be noted that each phase included multiple batches of real brewery wastewater with varying characteristics (e.g., sCOD and VFA composition). These variations were inherently incorporated into the phase-based analysis, allowing evaluation of system adaptability under realistic conditions. Standard deviation was used as the error bar in figures to reflect variability. All statistical analyses were conducted using a spreadsheet. A statistical significance level of 95% was adopted, indicating that results with a p-value less than 0.05 are considered statistically significant (p < 0.05).
Results
Effect of Organic Loading Rate (OLR) on BEAD Performance - Stage 1:
Effect of OLR on COD Removal Performance
As shown in Figure 2 and detailed in Table 3, the BEAD system maintained high COD removal efficiencies even at high OLRs, achieving 92.7 ± 0.6% removal at a high OLR of 5 g sCOD/L∙d. This performance is particularly notable when compared with other BEAD studies operated under controlled conditions and lower OLRs. For example, at OLRs of 1 and 2 g sCOD/L∙d, the reactor achieved COD removal efficiency of 96.2%, outperforming results by Sangeetha et al.24 and Guo et al.21, who reported maximum COD removals of 90% and 80%, respectively, at 30–35 °C using synthetic brewery wastewater.
Reductions in HRT at higher OLRs led to corresponding decreases in COD removal efficiencies. As HRT decreased from 5.2 ± 0.1 days at an OLR of 5 g sCOD/L∙d to 4.4 ± 0.3 and 3.7 ± 0.1 days at OLRs of 6 and 7 g sCOD/L∙d, respectively, COD removal efficiencies significantly decreased to 85.1 ± 1.7% and 79.2 ± 0.8% (p < 0.05). A further reduction in HRT to 2.1 ± 0.2 days at an OLR of 7* g sCOD/L∙d reduced COD removal to 64.6 ± 2.1% (p < 0.05). This trend indicates that a short HRT at a high OLR can lead to substrate inhibition and biomass washout, which could limit the BEAD system’s ability to maintain bioelectrochemical enhancements, potentially associated with DIET, that are important for efficient COD degradation48. These results align with findings by Sangeetha et al.23, who observed decreased COD removal in a BEAD treating synthetic brewery wastewater when HRT was reduced from 36 to 12 hours as OLR increased from 1.5 to 4.4 g COD/L∙d. Despite these challenges, the BEAD reactor in this study still demonstrated excellent performance at high OLRs compared to traditional AD systems. For example, Xu et al.49 reported 80% COD removal at an OLR of 7.4 g COD/L∙d under ideal conditions at 35 °C, a value comparable to our 79.2 ± 0.8% at 7 g sCOD/L∙d, achieved at room temperature (22 °C).
VFA Removal Under Different OLRs
As shown in Figure 3A, increasing OLRs did not hinder BEAD’s ability to enhance VFA removal, as BEAD managed higher influent VFA loads while maintaining relatively stable effluent VFA rates. For instance, despite an increase in influent VFA rate from 1.8 g sCOD/L∙d at an OLR of 6 to 2.9 g sCOD/L∙d at an OLR of 7, the effluent VFA rate remained stable at 0.8 g sCOD/L∙d. This stability across all OLRs demonstrates BEAD’s effectiveness in degrading VFAs and its ability to prevent the VFA accumulation typically responsible for pH drops and microbial inhibition in traditional AD systems50,51.
Moreover, the system demonstrated exceptional capability to degrade challenging VFAs, propionic and butyric acids, which are known for their slower degradation rates in anaerobic processes51. For example, BEAD achieved 100% removal of propionic acid at OLRs 5 and 7 g sCOD/L∙d and substantial reduction of butyric acid from 1.2 to 0.3 g sCOD/L∙d at an OLR of 7 g sCOD/L∙d, as shown in Figure 3B and Table 4. The results also suggest that maintaining an optimal HRT is crucial for effective VFA degradation in BEAD, especially at high OLRs, where bioelectrochemical activity is intensified. Although the system exhibited high VFA degradation rates from OLRs of 5 to 7 g sCOD/L∙d, even with decreasing HRT from 5.2 ± 0.1 to 3.7 ± 0.1 days, a further reduction to 2.1 ± 0.0 days at an OLR of 7* g sCOD/L∙d resulted in a notable decline in performance. This was evident in the significant increase in effluent VFA rate from 0.8 to 2.4 g sCOD/L∙d. In particular, the effluent acetic acid rate increased sharply from 0.6 to 1.8 g sCOD/L∙d, and propionic acid, completely removed at an OLR of 7, increased to 0.4 g sCOD/L∙d. Butyric acid removal was also affected, though to a lesser extent.
CH4 Production Performance:
CH4 Yield (Based on COD removal) and Volumetric CH4 Production
Higher OLRs significantly enhanced methane yield and volume in BEAD, indicating the benefits of increased substrate availability for methane production while avoiding system overload. As shown in Figure 4A, methane yield (based on COD removal) peaked at 0.35 ± 0.01 LCH4/g sCODRemoved (the maximum theoretical yield) at an OLR of 7 g sCOD/L∙d. This yield represented a statistically significant increase (p < 0.05) of 10–400% over lower OLRs. Methane volume also followed this trend, reaching 1.93 ± 0.04 L/L∙d at an OLR of 7 g sCOD/L∙d, indicating 18–2657% increases over lower OLRs, as shown in Table 3.
Compared to other BEAD studies conducted under controlled conditions, the BEAD system in this study demonstrated superior methane production using real brewery wastewater at room temperature (22 °C). For example, while Sangeetha et al.24 reported a methane yield of 0.143 LCH4/g COD and a volume of 0.367 L/L∙d at OLRs of 1–2 g COD/L∙d using synthetic brewery wastewater at 30 °C, our system achieved a higher methane yield of 0.21 ± 0.01 LCH4/g sCODRemoved and a volume of 0.43 ± 0.03 L/L∙d at an OLR of 2 g sCOD/L∙d. Similarly, Xu et al.25 observed a methane volume of 1.16 L/L∙d at an OLR of 5.8 g COD/L∙d and 35°C, whereas our system produced 1.64 ± 0.05 L/L∙d at a comparable OLR of 6 g sCOD/L∙d. Although methane yield and volume remained stable as HRT decreased from 5.2 ± 0.1 to 3.7 ± 0.1 days between OLRs 5 and 7 g sCOD/L∙d, a further reduction to 2.1 ± 0.2 days at an OLR of 7* g sCOD/L∙d resulted in statistically significant declines (p < 0.05). Methane yield decreased by 21%, from 0.35 ± 0.01 to 0.28 ± 0.01 LCH4/g sCODRemoved, and methane volume decreased by 36%, from 1.93 ± 0.04 to 1.24 ± 0.02 L/L∙d. These reductions correlate with the decreased COD and VFA removal previously discussed, indicating that short HRTs limit microbial contact time and conversion of organics into methane. Thus, sufficient retention time is essential to maintain optimal bioelectrochemical efficiency under high organic loading.
CH4 yield based on COD Added
Methane yield based on COD added improved with increasing OLRs but stabilized at higher OLRs due to HRT limitations. As shown in Figure 4B, methane yield significantly increased (p < 0.05) from 0.07 ± 0.01 L LCH4/g sCODAdded at an OLR of 1 g sCOD/L∙d to 0.28 ± 0.01 LCH4/g sCODAdded at 5 g sCOD/L∙d. However, from OLR 5 to 7 g sCOD/L∙d, the yield stabilized around 0.28 LCH4/g sCODAdded, with no significant differences (p > 0.05), indicating that further increases in substrate availability did not lead to higher conversion efficiency. This finding is primarily attributed to reduced HRTs at higher OLRs, which limited the conversion of non-VFA organic compounds to methane, despite effective VFA degradation. Table 5 supports this observation, showing that the removal rates of these other organic compounds did not increase between OLRs 5 and 7 g sCOD/L∙d, resulting in their increased rates in the effluent. In addition, a further HRT reduction at OLR 7* g sCOD/L∙d caused a notable drop in methane yield, illustrating a critical threshold beyond which even VFAs were not adequately converted to methane due to insufficient retention time.
CH4 content
Methane content in BEAD improved with increasing OLRs, stabilizing at high loads. As shown in Figure 4C, the system reached its peak methane content of 75.0 ± 0.3% at an OLR of 6 g sCOD/L∙d, followed by 74.3 ± 1.2% and 74.0 ± 0.8% at OLRs of 7 and 5 g sCOD/L·d, respectively. Notably, no statistical differences (p > 0.05) in methane content were observed among these higher OLRs, indicating a stable biogas quality at these high loading rates. Moreover, the system outperformed other BEAD studies; for example, Xu et al.25 reported a methane content of 62.3% at an OLR of 5.8 g COD/L∙d under controlled temperature of 35°C and using synthetic wastewater, whereas our reactor achieved 75.0 ± 0.3% at an OLR of 6 g sCOD/L∙d using real wastewater at room temperature (22 °C).
At an OLR of 7* g sCOD/L∙d with a reduced HRT of 2.1 ± 0.2 days, the methane content slightly decreased to 72.7 ± 0.5%. However, this change was not statistically significant (p > 0.05) compared with the methane content at an HRT of 3.7 ± 0.1 days and an OLR of 7 g sCOD/L∙d, indicating that the system maintained effective methane content even under reduced contact times.
Electrochemical Performance of the BEAD System
Both current density and CE significantly improved with increasing OLRs and reached their maximum values at an OLR of 6 g sCOD/L·d, peaking at 13.8 ± 0.3 A/m3 and 1.97 ± 0.04%, respectively. However, further increasing the OLR to 7 g sCOD/L∙d resulted in a significant decrease in performance (p < 0.05), with current density and CE dropping to 6.2 ± 0.1 A/m3 and 0.81 ± 0.01%, respectively, as illustrated in Figures 5A and B. The decline in EC values indicates that most electrons are directed toward methane production rather than being recovered as electrical current, which is consistent with the system’s primary function as an anaerobic digestion process. This decline may be attributed to substrate overload or nutrient imbalances at high OLRs. High substrate concentrations at high OLRs can intensify competition between exoelectrogens and methanogens at the anode, often favoring methanogens and thereby reducing current generation52. Additionally, limited nutrient availability at high OLRs can inhibit the growth and activity of exoelectrogens, thus reducing current production53.
Compared with other BEAD systems using synthetic brewery wastewater, our system demonstrated higher current production at higher OLRs but lower electrochemical performance at lower OLRs, highlighting the influence of wastewater complexity. For instance, at an OLR of 6 g sCOD/L∙d, our system achieved a higher current density than that of only 1.41 A/m3reported by Xu et al.25 at a comparable OLR of 5.8 g COD/L∙d at 35 °C. However, our BEAD performance at an OLR of 2 g sCOD/L∙d, with a current density of 1.9 ± 0.1 A/m3 and CE of 1.58 ± 0.14%, was lower than 14.3 A/m3and 15% observed by Sangeetha et al.24. These findings highlight that synthetic substrates enhance electron recovery due to reduced microbial competition, unlike real wastewater, which contains a more diverse and competitive microbial community12,54.
Interestingly, current production remained stable despite reductions in HRT. Specifically, reducing the HRT from 3.7 ± 0.1 days to 2.1 ± 0.2 days at an OLR of 7* g COD/L∙d did not result in a statistically significant change in current density (p > 0.05), which remained steady at 6.2 A/m3. This consistency suggests that variations in HRT do not necessarily correlate with changes in current density. This finding is critical as it indicates that despite a reduction in organic removal efficiency due to a shorter contact time between exoelectrogens and substrates, the electron transfer rate to the anode remained unaffected. This observation aligns with the findings of Castellano-Hinojosa et al.55, who also reported a stable current density despite significant reductions in HRT. Similarly, Song et al.56 observed no change in current density (remaining at 233 A/m3), even though effluent sCOD increased significantly from 439.0 ± 129.8 to 749.0 ± 36 mg/L when HRT was reduced from 10 to 5 days. These findings suggest that bioelectrochemical interactions, potentially associated with DIET, may remain effective in BEAD even when the retention time is shortened.
Impact of Applied Potential on BEAD Performance - Stage 2:
Influence of Applied Potential on COD removal
The results showed that at higher OLRs, the applied potential in the BEAD system improved COD removal efficiency compared to the control AD system but had minimal effect at lower OLRs, as demonstrated in Figure 2 and Table 3. Specifically, at a high OLR of 5 g sCOD/L∙d, BEAD achieved a COD removal efficiency of 92.7 ± 0.6%, significantly higher (p < 0.05) than the 85.3 ± 0.6% observed in AD. In contrast, at lower OLRs of 2 and 3 g sCOD/L∙d, the difference was not statistically significant (p > 0.05), with both systems achieving similar high efficiencies (96.2 ± 0.1% vs. 96.6 ± 0.3% at 2 g sCOD/L∙d and 94.1 ± 1.2% vs. 94.7 ± 0.8% at 3 g sCOD/L∙d). This trend aligns with findings by Tartakovsky et al.57, who also reported similar COD removal efficiencies at lower OLRs in systems with and without applied potential, but noted that the application of potential significantly enhanced COD removal at higher OLRs compared to traditional AD. These observations suggest that the applied potential may enhance microbial interactions and electron transfer processes, potentially associated with DIET, leading to more effective organic degradation.
At the highest OLR of 7* g sCOD/L∙d, where HRT was reduced to 2 days, the applied potential had a limited impact on COD removal efficiency. BEAD achieved a COD removal efficiency of 64.6 ± 2.1%, slightly higher than the 61.9 ± 1.5% observed in AD, but the difference was not statistically significant (p > 0.05). This suggests that while higher OLRs might demonstrate the potential benefits of applied potential in enhancing COD removal, the reduced HRT limits the system’s ability to fully utilize these bioelectrochemical advantages. This may be because the shortened HRT does not provide sufficient time for microbial activity and electron transfer processes, potentially associated with DIET, highlighting the need for a balanced operational strategy that considers both the benefits of applied potential and the limitations imposed by reduced retention time.
Effect of Applied Potential on VFA Removal
Figure 6A–E and Table 5 demonstrate that BEAD significantly outperformed AD in the degradation of complex VFAs. Notably, at an OLR of 5 g sCOD/L∙d, BEAD achieved 100% removal of propionic and butyric acids, compared to only 58.2% and 77.6% removal in AD (Figure 6E). This highlights the effectiveness of applied potential in enhancing bioelectrochemical processes, which not only accelerates VFA degradation but also improves the kinetics of methanogenesis58,59. Effluent composition analysis at this OLR further confirms this superior performance: BEAD effluent consisted of 87% acetic acid with no detectable propionic or butyric acids, while AD effluent contained 64% acetic acid, with 19% propionic and 17% butyric acids (Figure 6D).
BEAD maintained superior removal of propionic and butyric acids even at a shortened HRT. At the highest OLR of 7* g sCOD/L∙d with a reduced HRT of 2 days, BEAD achieved 66.4% removal of butyric acid, significantly higher than AD’s 50.9%. For propionic acid, BEAD removed 33.2%, while AD showed an effluent rate exceeding the influent, indicating poor degradation. This superior performance of BEAD may be attributed to enhanced bioelectrochemical interactions, potentially associated with DIET, which could facilitate more effective electron transfer between acetogenic propionate- and butyrate-oxidizing bacteria and methanogens compared to hydrogen interspecies transfer (HIT) in AD, thereby reducing VFA accumulation at high OLRs15,16,60,61.
Effect of Applied Potential on CH4 Production:
CH4 Yield and Volumetric CH4 Production
BEAD demonstrated a superior performance in methane yields and volume compared to AD, particularly at OLRs of 3, 5, and 7* g sCOD/L∙d, where substrate availability supported enhanced bioelectrochemical activity (Figure 4A, Table 3). Notably, the most significant difference was observed at an OLR of 5 g sCOD/L∙d, where BEAD achieved 0.30 ± 0.01 LCH4/g sCODRemoved, 20% higher than AD’s yield of 0.25 ± 0.01 (p < 0.05). Methane volume followed a similar trend, with BEAD exceeding AD by 30%, 20%, and 16% at OLRs of 5, 3, and 7*, respectively (p < 0.05). These advantages can be attributed to the efficient electron transfer mechanisms facilitated by the closed circuit system, where the anode serves as a reliable electron acceptor, promoting enhanced electron flow to the cathode62. In contrast, AD’s open circuit likely experiences greater electron losses, reducing its methane production efficiency. Moreover, BEAD may benefit from enhanced bioelectrochemical interactions, potentially associated with DIET, which could provide additional pathways for methanogenesis, enabling more effective conversion of complex VFAs such as propionate and butyrate into methane. The only exception was observed at 2 g sCOD/L·d, where BEAD showed no clear advantage, possibly due to limited carbon availability and the initial acclimatization of electroactive microorganisms.
Applied potential not only improved methane production but also enhanced process stability, as depicted in Figure 7. At an OLR of 5 g sCOD/L∙d, BEAD operation in phase 11 showed relatively stable methane yield, with an average of 0.298 LCH₄/g sCODRemoved, a standard deviation of 0.008 LCH₄/g sCODRemoved, and a coefficient of variation (CV) of 2.81%. In contrast, after switching to AD in phase 12, the methane yield showed much larger fluctuations, decreasing from 0.33 to 0.16 LCH₄/g sCODRemoved, with a higher standard deviation of 0.054 LCH₄/g sCODRemoved and a CV of 20.87%. When the system was switched back to BEAD in phase 13, methane production recovered rapidly and became more stable, with an average yield of 0.312 LCH₄/g sCODRemoved and a reduced CV of 6.23%. Notably, during the later stable period of phase 13, the CV further decreased to 1.95%, indicating that BEAD operation restored process stability after the disturbance caused by AD operation. These quantitative results demonstrate that the applied potential contributed not only to higher methane production but also to lower operational variability and faster stabilization. These findings align with those of Park et al.63, who reported that BEAD systems enhance methane production rates and shorten stabilization time by facilitating rapid organic oxidation and methanogenesis, offering clear advantages over conventional AD processes.
CH4 Content
BEAD had a higher CH4 content than AD at higher OLRs, reaching 74.0 ± 0.8% and 72.7 ± 0.5% compared to AD’s 71.0 ± 0.8% and 70.0 ± 0.5% (p < 0.05) at OLRs of 5 and 7 g sCOD/L∙d, respectively, as shown in Figure 7. However, at lower OLRs of 2 and 3 g sCOD/L∙d, differences were not statistically significant (p > 0.05). This is likely because higher VFA degradation in BEAD generates more carbon dioxide (CO2), part of which is converted to CH4 while the rest increases gas bag CO2, leaving CH4 content unchanged. Similar trends were noted by other studies64,65,66, which indicates that enhancements in CH4 percentage and volume do not necessarily occur concurrently. Increasing the applied voltage above 1.23 V could further improve CH4 content by facilitating water electrolysis, thus producing hydrogen (H2) that can convert additional CO2 into methane57,66. However, this approach might lead to overpotential issues, potentially resulting in energy inefficiencies and operational challenges. Hence, voltage adjustment must be carefully optimized to balance enhanced methane production with system efficiency.
Energy Efficiency of the BEAD System
Figure 8 shows that BEAD maintained a consistently high energy efficiency (~1000%) across all OLRs. Notably, even at the highest OLR of 7* g sCOD/L∙d with a shortened HRT of 2 days, the system achieved high energy efficiency due to the low energy consumption of 0.03 ± 0.01 Wh/g sCODRemoved. This is far lower than the typical energy consumption of 0.7 to 2 Wh/g sCODRemoved in conventional activated sludge processes67. Moreover, although a slight decline in energy efficiency was observed with increasing OLR, the variation was minimal, indicating that BEAD maintained stable energetic performance even under increased organic loading and reduced hydraulic retention time. These findings indicate that BEAD can enhance methane production with high energy efficiency within the scope of the applied electrical input. However, it should be noted that the current energy analysis does not account for other operational energy demands, such as feed pumping and recirculation. Therefore, the reported energy efficiency reflects a partial energy balance, and further work is needed to evaluate the overall energy performance under full-scale operational conditions.
BEAD Performance in Nutrient-Limited (High C/N) Brewery Wastewater
Despite the high C/N ratio of the brewery wastewater, BEAD achieved significant performance, including efficient COD removal, VFA degradation, and methane production. Brewery wastewater is typically characterized by high organic and low-nitrogen content, leading to high C/N ratios68,69,70,71. This interpretation is based on the observed characteristics of the influent rather than a controlled comparison across different C/N ratios. In the conventional AD process, nutrient supplementation to brewery wastewater is often required to lower the C/N ratio and support microbial growth69,70,71, but no additional nutrients were added in this study. The strong BEAD performance likely results from the applied potential, which enhances microbial activity and reactor stability under nutrient-deficient conditions72,73. Limited research has investigated the impact of C/N ratios on BEAD performance, with most studies focusing on low to moderate C/N ratios (0.6–25)74,75,76. As previously mentioned, specific studies on BEAD systems treating brewery wastewater are scarce. Furthermore, in studies using synthetic brewery wastewater, nutrients were typically added to achieve optimal C/N ratios to 4021,23,24,25, while the only two studies conducted on real brewery wastewater did not measure or consider the impact of C/N ratio on BEAD performance20,22. Hence, further research is needed to explore the role of varying C/N ratios (low to high) on BEAD systems using real brewery wastewater.
DATA AVAILABILITY:
The data relevant to the study are included within the article and also in Supplementary File 2.
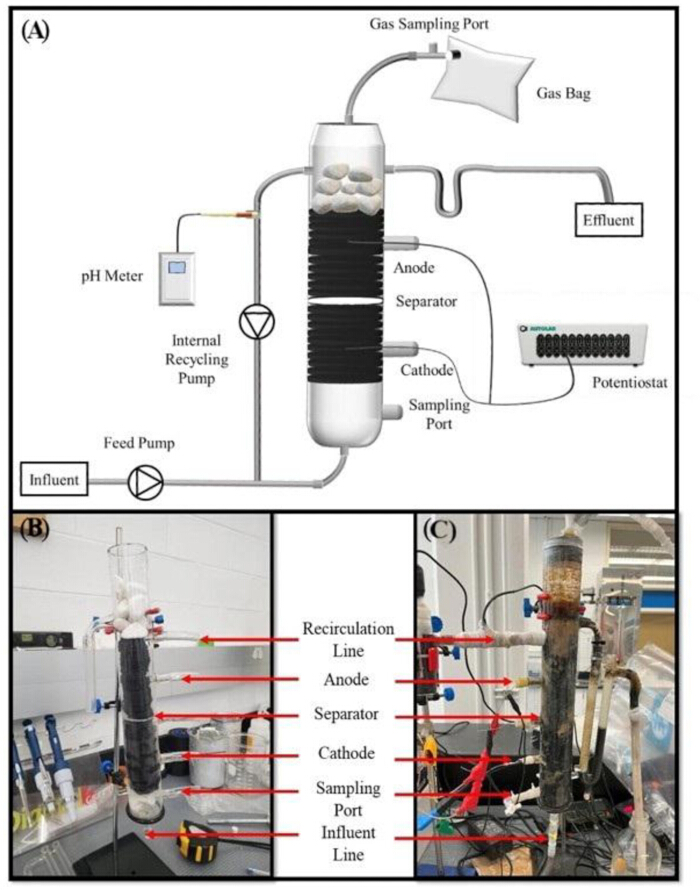
Figure 1: Configuration and operational setup of the bioelectrochemical reactor system used in this study. (A) Schematic illustration of the reactor configuration showing the major system components, including the packed-bed anode filled with carbon-based conductive material, cathode chamber, separator, influent and effluent lines, internal recirculation loop, gas sampling port, gas collection bag, and external electrical circuit connected to the potentiostat for electrochemical monitoring and control. The positions of the current collectors, sampling ports, feed pump, recirculation pump, and pH monitoring system are also indicated. (B) Photograph of the assembled reactor prior to operation, highlighting the vertical column design, packed anode structure, separator layer, cathode region, influent line, sampling port, and recirculation connections. (C) Photograph of the reactor during operation, showing reactor performance under continuous recirculation conditions, including liquid flow pathways, biofilm formation on the electrode surface, external tubing connections, and electrical wiring connected to the potentiostat. Please click here to view a larger version of this figure.
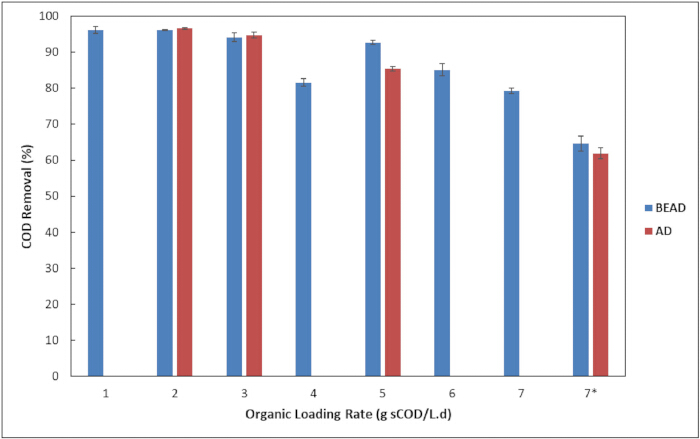
Figure 2: COD removal efficiency under different OLRs in BEAD system and conventional AD system. COD removal (%) was evaluated at OLRs ranging from 1 to 7 g sCOD/L·d, including the overloaded condition (7*). The figure compares the treatment performance of BEAD and AD reactors under increasing substrate loading conditions. Error bars represent standard deviations of replicate measurements. n = 3. Please click here to view a larger version of this figure.
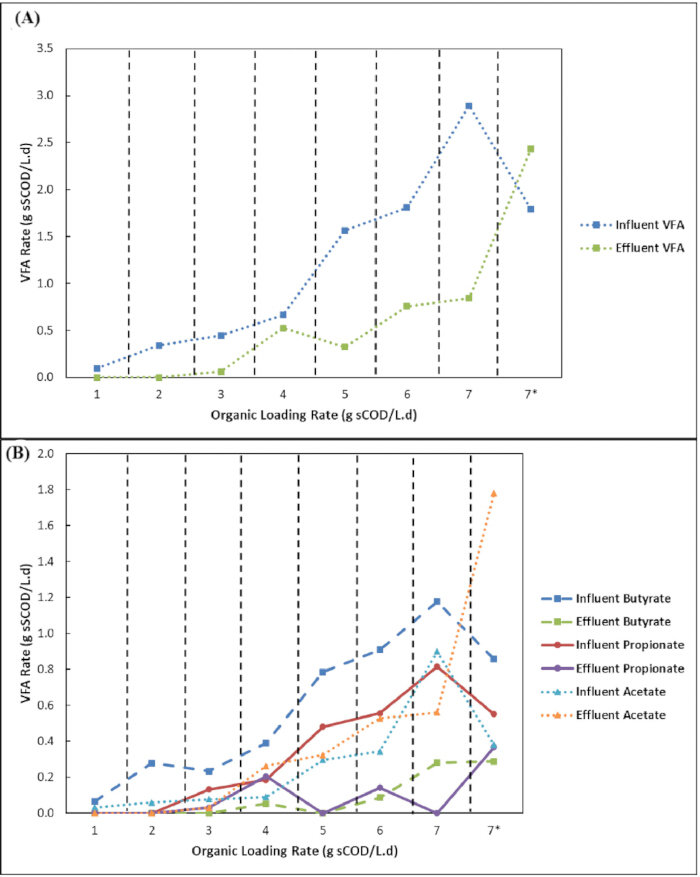
3: VFA production and composition under different OLRs in the BEAD system. (A) Total influent and effluent VFA rates measured at OLRs ranging from 1 to 7 g sCOD/L·d, showing the effect of substrate loading on VFA accumulation and removal performance. (B) Distribution of major VFAs, including acetate, propionate, and butyrate, in influent and effluent streams under different OLR conditions. Dashed vertical lines indicate operational phase transitions corresponding to changes in OLR. VFA rates are expressed as g sCOD/L·d. Please click here to view a larger version of this figure.
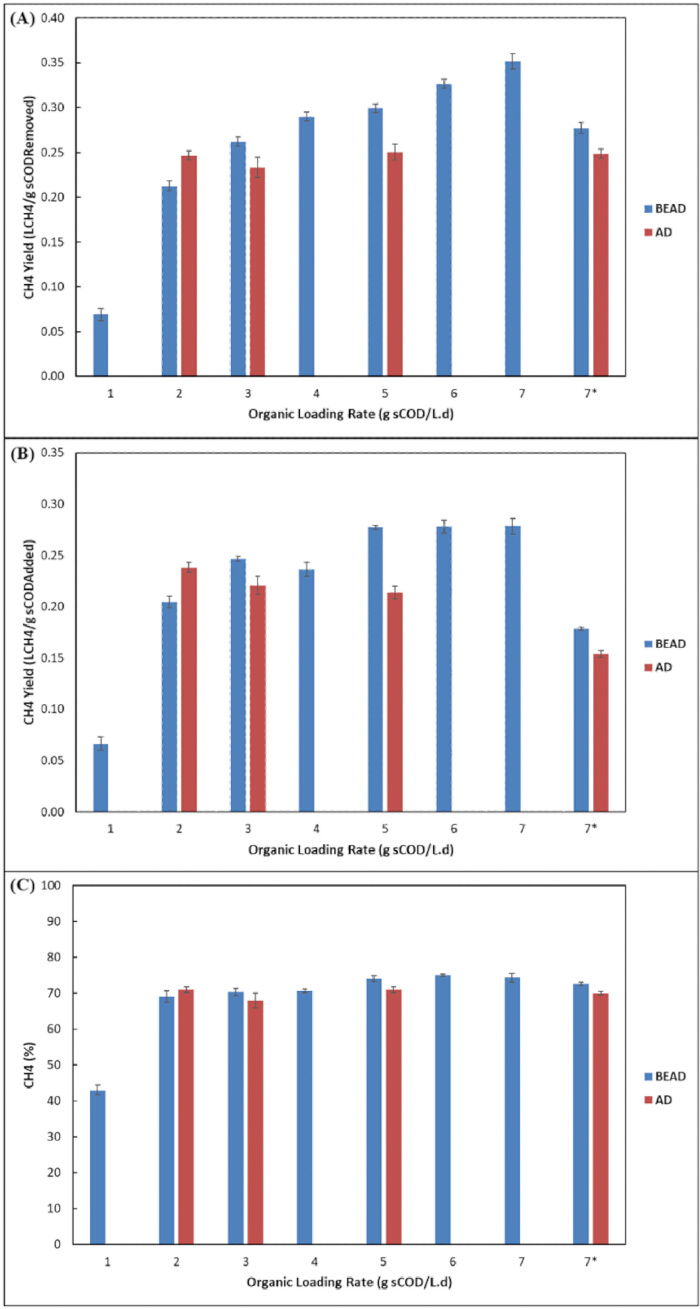
Figure 4: Methane production performance under different OLRs in the BEAD and AD systems. (A) Methane yield normalized to COD removed; (B) methane yield normalized to COD added; and (C) methane content (%) in the produced biogas at OLRs ranging from 1 to 7 g sCOD/L·d, including the overloaded condition (7*). The figure illustrates the influence of increasing substrate loading on methane recovery efficiency and biogas quality in both reactor configurations. Methane yield is expressed as L CH₄/g COD. Error bars represent standard deviations of replicate measurements. n = 3. Please click here to view a larger version of this figure.
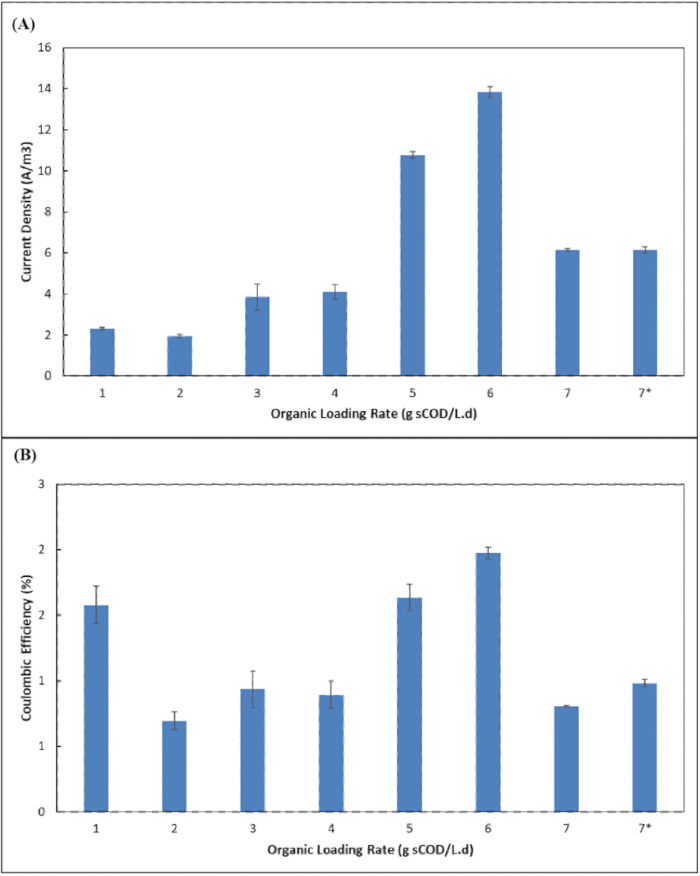
Figure 5: Electrochemical performance of the BEAD system under different OLRs. (A) Current density generated at OLRs ranging from 1 to 7 g sCOD/L·d, demonstrating the relationship between substrate loading and bioelectrochemical activity. (B) Coulombic efficiency (%) under different OLR conditions, representing the fraction of electrons recovered as electrical current relative to total substrate oxidation. Current density is expressed as A/m3. Error bars represent standard deviations of replicate measurements. n = 3. Please click here to view a larger version of this figure.
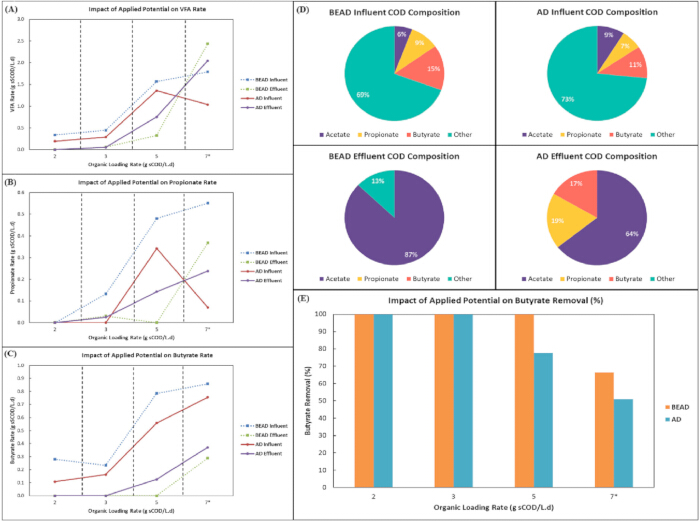
Figure 6:. Effect of applied potential on VFA dynamics and effluent composition in the BEAD and AD systems. (A) Total VFA rates under different applied potential and OLR conditions; (B) propionate production and removal rates; (C) butyrate production and removal rates; (D) influent and effluent COD composition at OLR 5 g sCOD/L·d, showing the relative distribution of acetate, propionate, butyrate, and other compounds; and (E) butyrate removal efficiency (%) under different OLR conditions. The figure demonstrates the influence of electrochemical stimulation on intermediate fermentation products and substrate conversion pathways. VFA rates are expressed as g sCOD/L·d. Error bars represent standard deviations of replicate measurements where applicable. n = 3. Please click here to view a larger version of this figure.
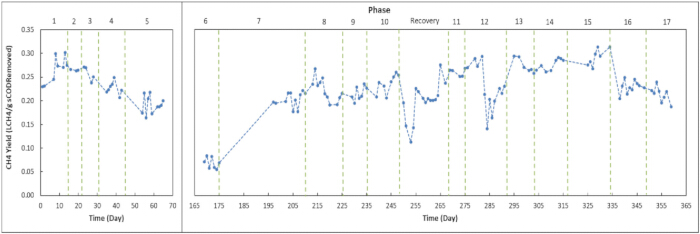
Figure 7: Temporal variation of methane yield normalized to COD removed during long-term operation of the BEAD reactor system. Methane yield was monitored over 365 days under different operational phases and OLR conditions. Vertical dashed lines indicate transitions between operational phases, including the recovery stage following reactor overloading. Methane yield is expressed as L CH₄/g sCOD removed. The figure illustrates reactor stability and methane production performance during extended continuous operation. Please click here to view a larger version of this figure.
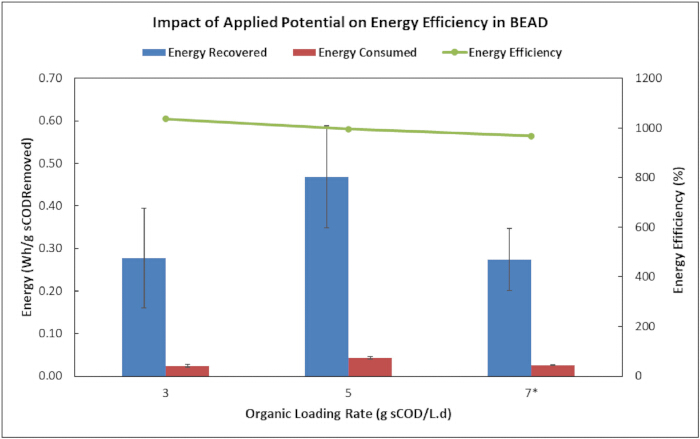
Figure 8: Effect of applied potential on energy recovery and energy efficiency in the BEAD system under different OLRs. The figure compares recovered energy, consumed electrical energy, and overall energy efficiency (%) at OLRs of 3, 5, and 7* g sCOD/L·d. Energy recovered and energy consumed are expressed as Wh/g sCOD removed. The figure demonstrates the energetic performance of the BEAD system under electrochemical stimulation and varying substrate loading conditions. Error bars represent standard deviations of replicate measurements. n = 3. Please click here to view a larger version of this figure.
| Parameter | Value |
| sCOD (mg/L) | 8,000-30,343 |
| VFA/sCOD | 0.1-0.4 |
| TS (%) | 0.85-1.4 |
| VS (%) | 0.6-1.3 |
| VS/TS | 0.7-0.93 |
| pH | 5.2-6 |
| TAN (mg/L) | 5-5.2 |
Table 1: Characteristics of the brewery wastewater used during reactor operation. The table summarizes the ranges of sCOD, VFA/sCOD, TS, VS, VS/TS ratio, pH, and TAN measured in the brewery wastewater throughout the experimental period.
| Stage | Phase | Description | Substrate | OLR (g sCOD/L.d) | Applied Potential (1.2 V) | HRT (Days) |
| Stage-1: Impact of OLR | 5 | Lowest OLR condition | Brewery WW | 2 | Yes | 4-5 |
| 6 | Shared phase (baseline for Stage-2) | Brewery WW | 1 | Yes | 4-5 | |
| 9 | Shared phase | Brewery WW | 3 | Yes | 4-5 | |
| 10 | Increased OLR | Brewery WW | 4 | Yes | 4-5 | |
| 11 & 13 | Repeated phase at OLR=5 for stability verification | Brewery WW | 5 | Yes | 4-5 | |
| 14 | Increased OLR | Brewery WW | 6 | Yes | 4-5 | |
| 15 | High OLR | Brewery WW | 7 | Yes | 3-4 | |
| 16 | Maximum loading | Brewery WW | 7* | Yes | 2 | |
| Stage-2: Impact of Applied Potential | 5 | Same condition as Stage-1 | Brewery WW | 2 | Yes | 4-5 |
| 7 | Without applied potential | Brewery WW | 2 | No | 4-5 | |
| 9 | Same as Stage-1 | Brewery WW | 3 | Yes | 4-5 | |
| 8 | Without applied potential | Brewery WW | 3 | No | 4-5 | |
| 11&13** | Same repeated phase as Stage-1 | Brewery WW | 5 | Yes | 4-5 | |
| 12 | Without applied potential | Brewery WW | 5 | No | 4-5 | |
| 16 | Same as Stage-1 | Brewery WW | 7* | Yes | 2 | |
| 17 | Without applied potential | Brewery WW | 7* | No | 2 |
Table 2: Experimental design and operational conditions used to evaluate the effects of OLR and applied potential on reactor performance. The table summarizes the operational phases, substrate conditions, applied potential, and HRT used throughout the study. The overloaded condition (7*) represents operation at the same OLR with reduced HRT.
| OLR | 1 | 2 | 3 | 4 | 5 | 6 | 7 | 7* | ||||
| Parameter | BEAD | BEAD | AD | BEAD | AD | BEAD | BEAD | AD | BEAD | BEAD | BEAD | AD |
| COD Removal (%) | 96.2 ± 1.0 | 96.2 ± 0.1 | 96.6 ± 0.3 | 94.1 ± 1.2 | 94.7 ± 0.8 | 81.6 ± 1.1 | 92.7 ± 0.6 | 85.3 ± 0.6 | 85.1 ± 1.7 | 79.2 ± 0.8 | 64.6 ± 2.1 | 61.9 ± 1.5 |
| CH4 YieldRemoved (LCH4/g sCODRemoved) | 0.07 ± 0.01 | 0.21 ± 0.01 | 0.25 ± 0.01 | 0.26 ± 0.01 | 0.23 ± 0.01 | 0.29 ± 0.01 | 0.30 ± 0.01 | 0.25 ± 0.01 | 0.33 ± 0.01 | 0.35 ± 0.01 | 0.28 ± 0.01 | 0.25 ± 0.01 |
| CH4 YieldAdded (LCH4/g sCODAdded) | 0.07± 0.01 | 0.20 ± 0.01 | 0.24 ± 0.01 | 0.25 ± 0.01 | 0.22 ± 0.01 | 0.24 ± 0.01 | 0.28 ± 0.01 | 0.21 ± 0.01 | 0.28 ± 0.01 | 0.28 ± 0.01 | 0.18 ± 0.01 | 0.15 ± 0.01 |
| CH4 Volume (L/L.d) | 0.07 ± 0.02 | 0.43 ± 0.03 | 0.46 ± 0.02 | 0.77 ± 0.01 | 0.64 ± 0.02 | 0.96 ± 0.04 | 1.42 ± 0.07 | 1.09 ± 0.08 | 1.64 ± 0.05 | 1.93 ± 0.04 | 1.24 ± 0.02 | 1.07 ± 0.01 |
| CH4 (%) | 43.0 ± 1.4 | 69.0 ± 1.6 | 71.0 ± 0.8 | 70.3 ± 0.9 | 68.0 ± 2.1 | 70.7 ± 0.5 | 74.0 ± 0.8 | 71.0 ± 0.8 | 75.0 ± 0.3 | 74.3 ± 1.2 | 72.7 ± 0.5 | 70.0 ± 0.5 |
| CE (%) | 1.58 ± 0.14 | 0.69 ± 0.07 | - | 0.93 ± 0.14 | - | 0.89 ± 0.10 | 1.64 ± 0.10 | - | 1.97 ± 0.04 | 0.81 ± 0.01 | 0.98 ± 0.03 | - |
| Current Density (A/m3) | 2.3 ± 0.1 | 1.9 ± 0.1 | - | 3.8 ± 0.6 | - | 4.1 ± 0.4 | 10.8 ± 0.2 | - | 13.8 ± 0.3 | 6.2 ± 0.1 | 6.2 ± 0.2 | - |
| HRT (days) | 5.3 ± 0.2 | 5.5 ± 0.3 | 5.3 ± 0.1 | 4.6 ± 0.1 | 5.3 ± 0.1 | 3.6 ± 0.1 | 5.2 ± 0.1 | 4.1 ± 0.1 | 4.4 ± 0.3 | 3.7 ± 0.1 | 2.1 ± 0.2 | 2.0 ± 0.1 |
Table 3: Performance parameters under different OLRs in the BEAD and AD systems. The table summarizes COD removal, CH₄ yield, CH₄ volume, CH₄ content, CE, current density, and HRT under different operational conditions. Values are presented as mean ± standard deviation based on steady-state measurements during each operational phase. The overloaded condition (7*) represents operation at the same OLR with reduced HRT.
| OLR | 1 | 2 | 3 | 4 | 5 | 6 | 7 | 7* | ||||
| Parameter | BEAD | BEAD | AD | BEAD | AD | BEAD | BEAD | AD | BEAD | BEAD | BEAD | AD |
| Influent Acetate (g sCOD/L.d) | 0.03 | 0.06 | 0.08 | 0.08 | 0.13 | 0.09 | 0.3 | 0.46 | 0.34 | 0.9 | 0.38 | 0.21 |
| Influent Propionate (g sCOD/L.d) | 0 | 0 | 0 | 0.13 | 0 | 0.19 | 0.48 | 0.34 | 0.56 | 0.82 | 0.55 | 0.07 |
| Influent Butyrate (g sCOD/L.d) | 0.07 | 0.28 | 0.11 | 0.23 | 0.16 | 0.39 | 0.79 | 0.56 | 0.91 | 1.18 | 0.86 | 0.76 |
| Effluent Acetate (g sCOD/L.d) | 0 | 0 | 0 | 0.03 | 0.03 | 0.26 | 0.32 | 0.48 | 0.53 | 0.56 | 1.78 | 1.44 |
| Effluent Propionate (g sCOD/L.d) | 0 | 0 | 0 | 0.03 | 0.03 | 0.21 | 0 | 0.14 | 0.14 | 0 | 0.37 | 0.24 |
| Effluent Butyrate (g sCOD/L.d) | 0 | 0 | 0 | 0 | 0 | 0.05 | 0 | 0.13 | 0.09 | 0.28 | 0.29 | 0.37 |
Table 4: VFA rates under different OLRs in the BEAD and AD systems. The table summarizes influent and effluent acetate, propionate, and butyrate rates expressed as g sCOD/L·d under different operational conditions.
| OLR | 1 | 2 | 3 | 4 | 5 | 6 | 7 | 7* | ||||
| Parameter | BEAD | BEAD | AD | BEAD | AD | BEAD | BEAD | AD | BEAD | BEAD | BEAD | AD |
| Influent COD (g sCOD/L.d) | 1.1 | 2.1 | 1.93 | 3.13 | 2.91 | 4.04 | 5.11 | 5.11 | 5.91 | 6.92 | 6.96 | 6.97 |
| Influent VFA (g sCOD/L.d) | 0.1 | 0.34 | 0.19 | 0.44 | 0.29 | 0.67 | 1.56 | 1.36 | 1.81 | 2.89 | 1.79 | 1.04 |
| Influent Other** (g sCOD/L.d) | 1 | 1.76 | 1.74 | 2.69 | 2.62 | 3.37 | 3.55 | 3.75 | 4.1 | 4.03 | 5.17 | 5.93 |
| Effluent COD (g sCOD/L.d) | 0.04 | 0.08 | 0.07 | 0.18 | 0.15 | 0.75 | 0.37 | 0.75 | 0.88 | 1.44 | 2.47 | 2.66 |
| Effluent VFA (g sCOD/L.d) | 0 | 0 | 0 | 0.06 | 0.05 | 0.52 | 0.32 | 0.75 | 0.76 | 0.84 | 2.44 | 2.05 |
| Effluent Other (g sCOD/L.d) | 0.04 | 0.08 | 0.07 | 0.12 | 0.1 | 0.23 | 0.05 | 0 | 0.12 | 0.6 | 0.03 | 0.61 |
| Removed COD (g sCOD/L.d) | 1.06 | 2.02 | 1.86 | 2.95 | 2.76 | 3.29 | 4.74 | 4.36 | 5.03 | 5.48 | 4.49 | 4.31 |
| Removed VFA (g sCOD/L.d) | 0.1 | 0.34 | 0.19 | 0.38 | 0.24 | 0.15 | 1.24 | 0.61 | 1.05 | 2.05 | - | - |
| Removed Other (g sCOD/L.d) | 0.96 | 1.68 | 1.67 | 2.57 | 2.52 | 3.14 | 3.5 | 3.75 | 3.98 | 3.43 | 5.14 | 5.32 |
Table 5: COD distribution, VFA rates, and other compound removal under different OLRs in the BEAD and AD systems. The table summarizes influent, effluent, and removed COD fractions, VFAs, and other compounds expressed as g sCOD/L·d under different reactor operating conditions. “Other” represents non-VFA compounds contributing to COD.
Supplementary Figure 1. Impact of influent VFA/sCOD ratio on COD removal efficiency in BEAD. The figure compares the COD removal performance of BEAD reactor under decreasing influent VFA/sCOD ratios from 1 to 0.2. Error bars represent standard deviations of replicate measurements. n = 3.Please click here to download this file.
Supplementary Figure 2. Impact of influent VFA/sCOD ratio on CH4 yield (based on COD removed) in BEAD. The figure compares the CH₄ yield of BEAD reactor under decreasing influent VFA/sCOD ratios from 1 to 0.2. Error bars represent standard deviations of replicate measurements. n = 3.Please click here to download this file.
Supplementary Figure 3. Impact of influent VFA/sCOD ratio on CH4 percentage in BEAD. The figure compares the CH₄ content in BEAD reactor under decreasing influent VFA/sCOD ratios from 1 to 0.2. Error bars represent standard deviations of replicate measurements. n = 3.Please click here to download this file.
Supplementary Figure 4. Impact of influent VFA/sCOD ratio on current density in BEAD. The figure compares the current density in BEAD reactor under decreasing influent VFA/sCOD ratios from 1 to 0.2. Error bars represent standard deviations of replicate measurements. n = 3.Please click here to download this file.
Supplementary Figure 5. Impact of influent VFA/sCOD ratio on coulombic efficiency in BEAD. The figure compares the coulombic efficiency in BEAD reactor under decreasing influent VFA/sCOD ratios from 1 to 0.2. Error bars represent standard deviations of replicate measurements. n = 3.Please click here to download this file.
Supplementary Table 1. Performance parameters in different substrate compositions. The table summarizes COD removal, CH₄ yield, CH₄ volume, CH₄ content, CE and current density under different substrate compositions. Values are presented as mean ± standard deviation based on steady-state measurements during each operational phase.Please click here to download this file.
Supplementary Table 2. Inhibitory compounds concentrations in influent and effluent. The table summarizes inhibitory compounds including ammonia, sulfate, sulfide, H2O2 and PAA in BEAD and AD influent and effluent under different OLR conditions. Values are presented as mean ± standard deviation based on steady-state measurements during each operational phase. The overloaded condition (7*) represents operation at the same OLR with reduced HRT.Please click here to download this file.
Supplementary File 1. Impact of influent VFA/sCOD ratio on BEAD performance and inhibitory compound evaluation.Please click here to download this file.
Supplementary File 2. Raw data.Please click here to download this file.
Discussion
BEAD consistently outperformed conventional AD in terms of COD removal, VFA degradation, methane yield, and process stability across varying OLRs. A key advantage of the system was its ability to efficiently degrade complex VFAs, such as propionic and butyric acids, which are typically challenging to break down in anaerobic environments. Methane yield increased with higher substrate availability, reaching a peak methane yield of 0.35 LCH4/g sCODRemoved at the highest OLR tested of 7 g sCOD/L·d. Methane production benefited from the applied potential, with methane volume in BEAD being 16–30% higher than in AD across various OLRs. This enhancement may be attributed to improved electron transfer processes. In conventional AD systems, electron transfer is primarily governed by IIET, which relies on intermediates such as hydrogen and formate, and is often limited by diffusion constraints and thermodynamic inefficiencies77. In contrast, the application of an external potential in BEAD likely promotes direct DIET, enabling more efficient electron exchange between electroactive bacteria and methanogens without the need for soluble mediators. The bioelectrochemical interactions, potentially associated with DIET and facilitated by the applied potential, could result in lower electron losses, more effective organic degradation, and higher methane production77. This shift from IIET to DIET could reduce electron losses, enhance syntrophic interactions, and accelerate the degradation of organic substrates, thereby contributing to improved methane production and process stability. It should be noted that the brewery wastewater used in this study was obtained from a single source, and thus the observed performance reflects site-specific wastewater characteristics. Therefore, the findings should be interpreted within the context of the tested conditions and may not be directly generalizable to all brewery wastewater systems.
Alternative approaches and complementary methods could further help investigate the mechanisms responsible for enhanced methane production and electron transfer in BEAD systems. For example, 16S rRNA sequencing or metagenomic analysis could identify electroactive bacteria and methanogens associated with DIET. Electrochemical techniques such as CV and EIS could provide additional insights into electron transfer behavior and biofilm conductivity. In addition, SEM and fluorescence microscopy could be used to investigate biofilm development and microbial interactions on electrode surfaces. These complementary approaches would provide a better understanding of the bioelectrochemical mechanisms governing reactor performance.
Although BEAD handled high OLRs effectively, reducing the HRT from 3.7 to 2.1 days led to declines in COD removal, VFA degradation, and methane production, highlighting the importance of sufficient HRT for process stability under high organic loads. Future work should further investigate the integration of brewery solid waste as a co-feed, optimization of applied potentials, and evaluation under a broader range of wastewater compositions and operational conditions. In addition, studies incorporating improved statistical replication and clearer benchmarking against conventional AD systems would help to better assess the relative performance of BEAD. These efforts would provide a more comprehensive understanding of the system and help clarify its potential applicability for treating high-strength industrial wastewaters.
Disclosures
The authors have no conflict of interest.
Acknowledgements
The authors thank the Natural Sciences and Engineering Research Council of Canada for financial support. Technical guidance from Dr. Boris Tartkovsky and Dr. Virender Singh is duly acknowledged.
Funding Source: Natural Sciences and Engineering Research Council of Canada
Materials
| Name | Company | Catalog Number | Comments |
|---|---|---|---|
| 0.45 µm membrane filter | MilliporeSigma | HAWP04700 | Used before soluble COD analysis |
| 500 mL glass bottles | Fisherbrand | 500 mL media bottle | Used for inoculum acclimatization |
| Acclaim OA column | Thermo Scientific | Acclaim OA, 5 µm, 4 × 150 mm | Column used for VFA quantification |
| Acetonitrile | Fisher Scientific | HPLC grade | Mobile phase for HPLC analysis |
| Ammonia reagent kit | HACH | TNTplus 832 | Nitrogen, Ammonia-Salicylate HR Method 10205 |
| Argon carrier gas | Air Liquide | Ultra-high purity argon | Carrier gas for micro GC |
| Carbon felt | SGL Carbon | GFD series | Electrode material cut into 25 mm × 25 mm squares |
| Centrifuge | Eppendorf | 5810 R | Used to centrifuge brewery wastewater at 12,000 × g |
| COD reagent tubes | SCP Science | COD reagent tubes (Method 8000 compatible) | Used for soluble COD analysis following HACH Method 8000 |
| Cylindrical glass reactor | Chemglass Life Sciences | Custom glass reactor | Single-chamber upflow reactor; 1 L total volume, 0.65 L working volume |
| Digital timer | Intermatic | TN311 | Used to control feed-rate timing |
| DR 2800 spectrophotometer | HACH | DR 2800 | Used for COD, ammonia, sulfate, and sulfide analyses |
| Gas collection bag | SKC | Tedlar gas sampling bag | Used for biogas collection |
| Gas-tight syringe | Hamilton | Gastight syringe | Used to measure biogas volume |
| HPLC system | Thermo Scientific Dionex | UltiMate 3000 | Used for volatile fatty acid (VFA) analysis |
| Hydrogen peroxide/peracetic acid test kit | LaMotte | 7191-02 | Used for H2O2 and PAA measurement |
| Ir-MMO coated titanium wire | Baoji Changli Special Metal Co., Ltd. | Ir-MMO/Ti wire | 1 mm current collector inserted into carbon felt |
| Laboratory refrigerator | VWR | Laboratory refrigerator | Used for wastewater storage at 4 °C |
| Methanesulfonic acid | Sigma-Aldrich | ≥99% | Used at 2.5 mM as HPLC mobile phase |
| Micro gas chromatograph | Agilent Technologies | 490 Micro GC | Used for biogas composition analysis with TCD detector |
| Non-conductive geotextile separator | TenCate Geosynthetics | Mirafi series | 3 mm separator with 2 mm perforations between electrodes |
| Peristaltic pump | Cole-Parmer | Masterflex L/S | Used for influent feeding and recirculation |
| Potentiostat | Metrohm Autolab | PGSTAT204 | Potentiostat used for applied potential and current monitoring |
| Silicone tubing | Cole-Parmer | Masterflex silicone tubing | Used for influent, effluent, and recirculation lines |
| Spectrophotometer | HACH | DR 2800 | Used for HACH analytical measurements |
| Spreadsheet | Microsoft Excel | Used for statistical analysis | |
| Sulfate reagent | HACH | SulfaVer 4, Method 8051 | Used for sulfate measurement |
| Sulfide reagent | HACH | Method 8131 | Used for sulfide measurement |
| Vacuum filtration apparatus | MilliporeSigma | Glass vacuum filtration holder | Used with 0.45 µm membrane filters |
References
- Kumar JA et al. A comprehensive review on bio-hydrogen production from brewery industrial wastewater and its treatment methodologies. Fuel. 2022;319:123594.
- Simate GS et al. The treatment of brewery wastewater for reuse: State of the art. Desalination. 2011;273(2):235-47.
- Statista Inc. Beer production worldwide from 1998 to 2023. 2024. Available from: https://www.statista.com/statistics/270275/worldwide-beer-production/
- Timm TG, Schipmann DBD, Costa TM, Tavares LBB. Remediation of brewery wastewater and reuse for β-glucans production by basidiomycete fungi. Waste Biomass Valor. 2024;15(8):4629-45.
- Beer Canada. National overview. 2021. Available from: https://industry.beercanada.com/national-overview
- Goldammer T. The brewer’s handbook: the complete book to brewing beer. 2nd ed. Apex Publishers; 2009.
- Huige NJ. Brewery by-products and effluents. In: Handbook of Brewing. 2nd ed. CRC Press; 2006. p. 60.
- Stantec Ltd. Over Strength Surcharge Review for Toronto Water, City of Toronto. 2012. Available from: https://www.toronto.ca/legdocs/mmis/2012/pw/bgrd/backgroundfile-50669.pdf
- Swain K, Abbassi B, Kinsley C. Combined electrocoagulation and chemical coagulation in treating brewery wastewater. Water. 2020;12(3):3.
- Hao X et al. Environmental impacts of resource recovery from wastewater treatment plants. Water Res. 2019;160:268-77.
- Feng Q, Song YC, Ahn Y. Electroactive microorganisms in bulk solution contribute significantly to methane production in bioelectrochemical anaerobic reactor. Bioresour Technol. 2018;259:119-27.
- Oh GG, Song YC, Bae BU, Lee CY. Electric field-driven direct interspecies electron transfer for bioelectrochemical methane production from fermentable and non-fermentable substrates. Processes. 2020;8(10):10.
- Park JG, Shin WB, Shi WQ, Jun HB. Changes of bacterial communities in anaerobic digestion and bio-electrochemical anaerobic digestion reactors according to organic load. Energies. 2019;12(15):15.
- Kaur A et al. Inhibition of methane production in microbial fuel cells: operating strategies which select electrogens over methanogens. Bioresour Technol. 2014;173:75-81.
- Luo L et al. Evaluation of methanogenic microbial electrolysis cells under closed/open circuit operations. Environ Technol. 2018;39(6):739-48.
- Moreno R et al. Mitigation of volatile fatty acid build-up by the use of soft carbon felt electrodes: evaluation of anaerobic digestion in acidic conditions. Fermentation. 2018;4(1):1.
- Liu Q et al. Multiple syntrophic interactions drive biohythane production from waste sludge in microbial electrolysis cells. Biotechnol Biofuels. 2016;9(1):162.
- Blasco-Gómez R et al. On the edge of research and technological application: a critical review of electromethanogenesis. Int J Mol Sci. 2017;18(4):4.
- Wang XT et al. Microbial electrolysis cells accelerated methane production from the enhanced hydrolysis and acidogenesis of raw waste activated sludge. Chem Eng J. 2021;413:127472.
- Hussain SA, Perrier M, Tartakovsky B. Long-term performance of a microbial electrolysis cell operated with periodic disconnection of power supply. RSC Adv. 2018;8(30):16842-9.
- Guo Z et al. Efficient methane production from beer wastewater in a membraneless microbial electrolysis cell with a stacked cathode: the effect of the cathode/anode ratio on bioenergy recovery. Energy Fuels. 2017;31(1):615-20.
- Pan H et al. Influence of organic loading rate on methane production from brewery wastewater in bioelectrochemical anaerobic digestion. Fermentation. 2023;9(11):11.
- Sangeetha T et al. Energy recovery evaluation in an up flow microbial electrolysis coupled anaerobic digestion reactor: role of electrode positions and hydraulic retention times. Appl Energy. 2017;206:1214-24.
- Sangeetha T et al. Cathode material as an influencing factor on beer wastewater treatment and methane production in a novel integrated upflow microbial electrolysis cell. Int J Hydrogen Energy. 2016;41(4):2189-96.
- Xu S, Zhang Y, Luo L, Liu H. Startup performance of microbial electrolysis cell assisted anaerobic digester with pre-acclimated activated carbon. Bioresour Technol Rep. 2019;5:91-8.
- Kang X et al. Fermentation and biogas production of alkaline wasted sludge enhanced in a bioelectrolysis-assisted anaerobic digestion reactor under increasing organic loads. Sustainability. 2023;15(2):1443.
- Sun MT et al. Effects of organic loading rate on biogas production from macroalgae: performance and microbial community structure. Bioresour Technol. 2017;235:292-300.
- Clauwaert P et al. Combining biocatalyzed electrolysis with anaerobic digestion. Water Sci Technol. 2008;57(4):575-9.
- Cristiani L, Zeppilli M, Villano M, Majone M. Role of the organic loading rate and the electrodes’ potential control strategy on the performance of a micro pilot tubular microbial electrolysis cell for biogas upgrading. Chem Eng J. 2021;426:131909.
- Lee M, Nagendranatha Reddy C, Min B. In situ integration of microbial electrochemical systems into anaerobic digestion to improve methane fermentation at different substrate concentrations. Int J Hydrogen Energy. 2019;44(4):2380-9.
- Zhao Z et al. Bioelectrochemical enhancement of anaerobic methanogenesis for high organic load rate wastewater treatment in a up-flow anaerobic sludge blanket reactor. Sci Rep. 2014;4(1):6658.
- Hirano S, Matsumoto N. Analysis of a bio-electrochemical reactor containing carbon fiber textiles for the anaerobic digestion of tomato plant residues. Bioresour Technol. 2018;249:809-17.
- Park JG, Lee B, Park HR, Jun HB. Long-term evaluation of methane production in a bio-electrochemical anaerobic digestion reactor according to the organic loading rate. Bioresour Technol. 2019;273:478-86.
- Sasaki K et al. Bioelectrochemical system stabilizes methane fermentation from garbage slurry. Bioresour Technol. 2010;101(10):3415-22.
- Choi KS, Kondaveeti S, Min B. Bioelectrochemical methane production in anaerobic digestion at different supplemental voltages. Bioresour Technol. 2017;245:826-32.
- Flores-Rodriguez C, Nagendranatha Reddy C, Min B. Enhanced methane production from acetate intermediate by bioelectrochemical anaerobic digestion at optimal applied voltages. Biomass Bioenergy. 2019;127:105261.
- Park JG, Jiang D, Lee B, Jun HB. Towards the practical application of bioelectrochemical anaerobic digestion: insights into electrode materials, reactor configurations, and process designs. Water Res. 2020;184:116214.
- Cusick RD et al. Performance of a pilot-scale continuous flow microbial electrolysis cell fed winery wastewater. Appl Microbiol Biotechnol. 2011;89(6):2053-63.
- Duan H et al. Metabolic regulation of mesophilic Methanosarcina barkeri to ammonium inhibition. Environ Sci Technol. 2022;56(12):8897-907.
- Jiang Y et al. Ammonia inhibition and toxicity in anaerobic digestion: a critical review. J Water Process Eng. 2019;32:100899.
- Chen Y, Cheng JJ, Creamer KS. Inhibition of anaerobic digestion process: a review. Bioresour Technol. 2008;99(10):4044-64.
- Liu X, Chen J, Lin DH, Pavlostathis SG. Long-term evaluation of the effect of peracetic acid solution on anaerobic wastewater treatment: process performance and microbial community structure. Chem Eng J. 2022;436:135262.
- EPA. Method 1684: Total, Fixed, and Volatile Solids in Water, Solid, and Biosolids Draft 20. 2001.
- HACH. DR 2800 Spectrophotometer Procedures Manual. 2007.
- HACH. Nitrogen, Ammonia-Salicylate HR Method 10205, TNTplus 832. 2007.
- HACH. Sulfate Method 8051, SulfaVer 4 method, powder pillows or AccuVac ampuls, range: 2-70 mg/L. 2007.
- HACH. Sulfide, Methylene Blue Method 8131. 2007.
- Gomez-Romero J et al. Continuous two-staged co-digestion process for biohydrogen production from agro-industrial wastes. Int J Energy Res. 2016;40(2):257-72.
- Xu F et al. Identical full-scale biogas-lift reactors with anaerobic granular sludge and residual activated sludge for brewery wastewater treatment and kinetic modeling. J Environ Sci. 2013;25(10):2031-40.
- Buyukkamaci N, Filibeli A. Volatile fatty acid formation in an anaerobic hybrid reactor. Process Biochem. 2004;39(11):1491-4.
- Wang Y, Zhang Y, Wang J, Meng L. Effects of volatile fatty acid concentrations on methane yield and methanogenic bacteria. Biomass Bioenergy. 2009;33(5):848-53.
- Sleutels THJA, Molenaar SD, Heijne AT, Buisman CJN. Low substrate loading limits methanogenesis and leads to high coulombic efficiency in bioelectrochemical systems. Microorganisms. 2016;4(1):1.
- Zarabadi MP, Charette SJ, Greener J. Flow-based deacidification of Geobacter sulfurreducens biofilms depends on nutrient conditions: a microfluidic bioelectrochemical study. ChemElectroChem. 2018;5(23):3645-53.
- Sasaki K et al. Changes in the microbial consortium during dark hydrogen fermentation in a bioelectrochemical system increases methane production during a two-stage process. Biotechnol Biofuels. 2018;11(1):173.
- Castellano-Hinojosa A et al. Hydraulic retention time drives changes in energy production and the anodic microbiome of a microbial fuel cell. J Water Process Eng. 2024;59:104966.
- Song YC, Feng Q, Ahn Y. Performance of the bio-electrochemical anaerobic digestion of sewage sludge at different hydraulic retention times. Energy Fuels. 2016;30(1):352-9.
- Tartakovsky B, Mehta P, Bourque JS, Guiot SR. Electrolysis-enhanced anaerobic digestion of wastewater. Bioresour Technol. 2011;102(10):5685-91.
- He W et al. Enhanced methanogenesis of waste-activated sludge in a continuous stirring tank reactor with stealth electrodes. Fermentation. 2024;10(3):3.
- Kanellos G, Tremouli A, Arvanitakis G, Lyberatos G. Computational analysis of the kinetic processes of microbial electrolysis cell-assisted anaerobic digestion using the ADM1. Water. 2023;15(22):22.
- Cruz Viggi C et al. Magnetite particles triggering a faster and more robust syntrophic pathway of methanogenic propionate degradation. Environ Sci Technol. 2014;48(13):7536-43.
- Zhao Z et al. Communities stimulated with ethanol to perform direct interspecies electron transfer for syntrophic metabolism of propionate and butyrate. Water Res. 2016;102:475-84.
- Rotaru AE et al. A new model for electron flow during anaerobic digestion: direct interspecies electron transfer to Methanosaeta for the reduction of carbon dioxide to methane. Energy Environ Sci. 2014;7(1):408-15.
- Park J, Lee B, Tian D, Jun H. Bioelectrochemical enhancement of methane production from highly concentrated food waste in a combined anaerobic digester and microbial electrolysis cell. Bioresour Technol. 2018;247:226-33.
- Dou Z, Dykstra CM, Pavlostathis SG. Bioelectrochemically assisted anaerobic digestion system for biogas upgrading and enhanced methane production. Sci Total Environ. 2018;633:1012-21.
- Gajaraj S, Huang Y, Zheng P, Hu Z. Methane production improvement and associated methanogenic assemblages in bioelectrochemically assisted anaerobic digestion. Biochem Eng J. 2017;117:105-12.
- Yu J, Kim S, Kwon OS. Effect of applied voltage and temperature on methane production and microbial community in microbial electrochemical anaerobic digestion systems treating swine manure. J Ind Microbiol Biotechnol. 2019;46(7):911-23.
- Cheng KY, Ho G, Cord-Ruwisch R. Energy-efficient treatment of organic wastewater streams using a rotatable bioelectrochemical contactor. Bioresour Technol. 2012;126:431-6.
- Chen H et al. Brewery wastewater treatment using an anaerobic membrane bioreactor. Biochem Eng J. 2016;105:321-31.
- Ince BK, Ince O, Sallis PJ, Anderson GK. Inert COD production in a membrane anaerobic reactor treating brewery wastewater. Water Res. 2000;34(16):3943-8.
- Parawira W, Kudita I, Nyandoroh MG, Zvauya R. A study of industrial anaerobic treatment of opaque beer brewery wastewater in a tropical climate using a full-scale UASB reactor seeded with activated sludge. Process Biochem. 2005;40(2):593-9.
- Yu H, Gu G. Biomethanation of brewery wastewater using an anaerobic upflow blanket filter. J Clean Prod. 1996;4(3):219-23.
- Alonso RM, Escapa A, Sotres A, Morán A. Integrating microbial electrochemical technologies with anaerobic digestion to accelerate propionate degradation. Fuel. 2020;267:117158.
- Feng Q, Song YC, Bae BU. Influence of applied voltage on the performance of bioelectrochemical anaerobic digestion of sewage sludge and planktonic microbial communities at ambient temperature. Bioresour Technol. 2016;220:500-8.
- Cristiani L, Leobello L, Zeppilli M, Villano M. Role of C/N ratio in a pilot scale microbial electrolysis cell for biomethane production and biogas upgrading. Renew Energy. 2023;210:355-63.
- Feng H et al. The effect of carbon sources on nitrogen removal performance in bioelectrochemical systems. Bioresour Technol. 2013;128:565-70.
- Huang B et al. The effect of C/N ratio on nitrogen removal in a bioelectrochemical system. Bioresour Technol. 2013;132:91-8.
- Al Hasani Z et al. Prospect of conductive materials in the anaerobic digester matrix for methane production: electron transfer and microbial communication. Water. 2025;17(9):1321.