This study investigated the potential role of JNK1/2 signaling in Aconitine-induced myocardial damage in rats. Increased JNK1/2 phosphorylation was associated with myocardial damage, while pharmacological inhibition of the JNK pathway partially alleviated myocardial damage, suggesting that JNK signaling may participate in Aconitine-induced cardiotoxicity.
Research Article
Aconitine Induces Myocardial Damage in Rats Associated With Activation of the JNK1/2 Signaling Pathway
In This Article
Summary
Abstract
Acute Aconitine (Acon) poisoning can cause arrhythmia and myocardial damage; however, the underlying mechanisms remain unclear. This study investigated the mechanism of myocardial injury induced by acute Acon poisoning. A rat model (n = 51) of acute Acon poisoning was established by intragastric administration. Electrocardiographic tracings were used to record changes in cardiac rhythm. Hematoxylin and eosin (HE) staining and Masson staining were performed to evaluate myocardial pathological injury and collagen deposition. The expression levels of cardiac enzymes and proteins in venous blood were detected using enzyme-linked immunosorbent assay (ELISA) kits. The structure–activity relationship between Acon and the JNK pathway was investigated by molecular docking. The expression levels of phosphorylated c-Jun N-terminal kinase 1/2 (JNK1/2) proteins were detected by Western blotting. In this study, ventricular arrhythmias were observed in rats following intragastric administration of Acon. Myocardial tissue showed a disordered arrangement of myocardial fibers and cells, accompanied by abnormal collagen deposition. Molecular docking results indicated potential interactions between Acon and JNK1/2. Meanwhile, the expression levels of cardiac enzymes and proteins, as well as phosphorylated JNK1/2, were significantly increased. Further studies demonstrated that treatment with the JNK inhibitor SP600125 partially reversed Acon-induced myocardial injury in rats. These results indicate that JNK1/2 phosphorylation is involved in the development of myocardial injury induced by acute Aconitine poisoning. The findings suggest that activation of the JNK1/2 signaling pathway contributes to Aconitine-induced myocardial damage, and that inhibition of the JNK1/2 pathway may alleviate myocardial injury caused by acute Aconitine intoxication.
Introduction
Acon is a natural diterpene alkaloid extract from the Aconitum plant of the Ranunculaceae family. It has anti-inflammatory1,2, analgesic, anti-tumor, anti-rheumatic, immune metabolism, and blood circulation promotion effects3,4,5. However, inappropriate or excessive use of Acon-containing preparations can lead to severe poisoning events. Symptoms caused by Aconitine poisoning include cardiac symptoms6, neurological symptoms7 and the gastrointestinal symptoms8. In recent years, there have been frequent reports around the world of cases involving Aconite poisoning or death9,10,11. Acon poisoning mainly manifests in the cardiovascular system, nervous system, and digestive system. Among them, the main cause of death from poisoning is cardiotoxicity. The heart damage caused by Acon is very serious; particularly, the short onset of the syndrome makes it difficult to carry out clinical treatment in a timely manner. Usually, acute Acon poisoning will cause nausea, diarrhea, dizziness, chest pain, dyspnea, and other first symptoms within a few hours8. At present, the detailed mechanism of myocardial damage caused by acute Acon poisoning is still unclear, and there are no clinically effective drugs that can effectively alleviate myocardial damage caused by Acon poisoning12,13.
Damage in acute Acon poisoning that may allow exploring the mechanism of myocardial damage could provide a significant means of a time-dependent investigation. Such a model could have the potential for future treatment of patients with acute Acon poisoning conditions and may prevent early on from the development of the syndrome early. Studies have speculated the role of the c-Jun n-terminal kinase (JNK) signaling pathway in the immune response to poisons. The JNK signaling pathway is one of the mitogen-activated protein kinase (MAPK) signaling pathways. The JNK family has three genes (JNK1/MAPK8, JNK2/MAPK9, and JNK3/MAPK10). JNK1 and JNK2 can be expressed in most tissues, including the heart, while JNK3 is mainly found in the brain14, and is mainly related to the oxidative stress and inflammatory response of cells15. Studies have found that the JNK-mediated signaling pathway plays an important role in brain and myocardial ischemia/reperfusion injury16,17. Administration of C66 alleviates high-fat diet-induced myocardial inflammation by inhibiting JNK activation in mouse hearts18. Chlorogenic acid alleviates TNF-α-induced cardiomyocyte injury by inhibiting JNK signaling19. Pinocembrin relieves LPS-induced myocardial damage and inflammatory response by inhibiting the p38/JNK MAPK signaling pathway, and alleviates cardiac dysfunction and arrhythmia20. These studies indicate that changes in JNK signaling, primarily JNK1/2, are closely related to myocardial damage. Meanwhile, JNK is also a downstream target of Acon for a series of activities. One study found that high doses of Acon exposure can mediate the JNK enzyme activation pathway, causing developmental toxicity in zebrafish embryos (juveniles) such as shortened body length, curved body shape, and brain development defects21. This study suggests that Acon may activate the JNK signaling pathway. However, the role of the JNK signaling pathway in myocardial damage caused by acute Aconitine poisoning is unclear.
This study established a rat model of acute Acon poisoning of myocardial damage by setting different intragastric doses and time intervals. Furthermore, we explored the effect of Acon on the phosphorylation level of JNK1/2 in the myocardium and the activation of the JNK signaling pathway in this model. Exploring the role of JNK1/2 phosphorylation in myocardial injury in rats induced by acute Acon poisoning provides a theoretical basis for the study of myocardial damage caused by acute Acon poisoning.
Protocol
The experimental design and implementation plan were approved by the Animal Experiment Committee of Kunming Medical University for approval (approval number: Kmmu20220652) on 06/2022. All experimental plans were carried out in accordance with the "Guidelines for Animal Experiments of Kunming Medical University". The list of all the materials used in this study is listed in the Table of Materials.
CAUTION: Due to the high toxicity of Acon, all preparation and administration procedures were conducted in accordance with institutional laboratory safety regulations. Personnel handling Acon wore appropriate personal protective equipment, including gloves, laboratory coats, and masks, and procedures involving Acon preparation were performed with appropriate precautions to minimize exposure risk. Animals were closely monitored during and after Acon administration for signs of severe toxicity and distress, and humane endpoints were applied when necessary to minimize suffering. Biological waste and Acon-contaminated materials were disposed of in accordance with institutional biosafety regulations.
Animal treatment
Adult male Sprague-Dawley (SD) rats (2 months old, 230 g) were raised in the SPF animal experiment building, experimental animal center, Kunming Medical University. The feeding conditions of all SD rats were treated according to the feeding requirements of SPF rats. They were adaptively raised for 1 week and fasted for 12 h before the experiment. Acon was dissolved in 0.05 M acetate buffer (Acet), and the SD rats were divided into 4 groups according to the principle of random control: Group 1 (Acon-1 mg) administered 1mg/kg Acon by gavage; Group 2 (Acon-2 mg) administered 2mg/kg Acon by intragastric; Group 3 (Acet), administered 2 mL 0.05 M acetate buffered by intragastric; and Group 4 (Control, no treatment applied). Samples were collected at 1, 3, and 6 h post-intragastric administration. A total of 36 rats were studied, with 3 per group at 1 h, 3 h, and 6 h. At each designated time point, ECG recordings were first performed. Subsequently, rats were anesthetized, and blood samples were collected for serum biochemical analysis. After blood collection, the rats were sacrificed, and the heart tissue was rapidly excised. Portions of myocardial tissue were fixed for histological analysis (HE and Masson staining), while the remaining tissues were stored for protein expression analysis by Western blotting. In experiments testing the JNK1/2 activators and inhibitors, SD rats will be divided into 5 groups according to the principle of random control: the model group received 2 mg/kg intragastric Acon administration, and the inhibitor group received an intraperitoneal injection of 6 mg/kg SP60012522 initially, followed by 2 mg/kg Acon by gavage 2 h later. The agonist group received initially an intraperitoneal injection of 0.1 mg/kg Anisomycin (Anis)23,24, followed by 2 mg/kg Acon by gavage 2 h later. The DMSO group received an intraperitoneal injection of 2 mL of 0.8% DMSO cosolvent mixed solution. The control group received no treatment. A total of 15 rats were studied. All staining results were analyzed in a blinded manner to minimize observational bias. During the experimental period, rats were continuously monitored for survival status and signs of severe toxicity following Aconitine administration. Mortality was recorded at each designated observation time point (1 h, 3 h, and 6 h). Death was defined as the complete cessation of respiration and heartbeat. Animals exhibiting severe distress, including persistent dyspnea, loss of righting reflex, inability to ambulate, or moribund condition, were considered to have reached humane endpoints and were euthanized immediately under deep anesthesia to minimize suffering. The number of deaths for each group of rats (Table 1–4).
Rat electrocardiogram (ECG) tracing
Rats in each group were subjected to ECG tracings. The specific method was as follows: after anesthesia by intraperitoneal injection of sodium pentobarbital at a dose of 30 mg/kg. The rats were fixed in the supine position on the animal experiment console. The computer was connected to the BL-420N biological signal acquisition and analysis system, and the ECG lead wire plug was inserted into the 3-channel input port of the BL-420N system. Pins were inserted subcutaneously into the inner side of the right forelimb, right hindlimb, and left hindlimb of the rats. The pins were soaked and sterilized in 75% alcohol before the operation, and care was taken to avoid inserting the pins into the muscles. The ECG lead wire electrode clips were then connected to the pins of each limb. The power switch and system software of the BL-420N biological signal acquisition and analysis system were turned on. Channel 3 was selected for signal acquisition, and the signal type was set as rat ECG. The parameters were set as follows: sampling rate, 1 kHz; range, 2.0 mV; time constant (high-pass filtering), 200 ms (0.80 Hz); low-pass filtering, 100 Hz; scanning speed, 200.0 ms/div; and the 50 Hz notch filter was turned off. Lead II ECG was recorded, and ECG changes were observed. After the ECG became stable, monitoring and recording were performed for 3 min, and the data were saved by groups for subsequent analysis. After the ECG recording, the electrode clips and pins were removed, and the rats were returned to their cages. The rats were kept warm, and their respiration was monitored until full recovery from anesthesia to prevent suffocation-related death. Baseline ECG recordings were performed on Day 1 prior to any treatment. On Day 2, rats were administered Acon by intragastric gavage, and ECG recordings were subsequently performed at 1 h, 3 h, and 6 h after administration using the same procedure.
Hematoxylin and Eosin (HE) staining and Masson staining
Hearts were cut at the horizontal short-axis plane, and the heart tissue from the cardiac apex of SD rats was collected and fixed in 4% polyformaldehyde at room temperature for 24 h. The fixed tissues were dehydrated, cleared in xylene, and embedded in paraffin wax. Then, sections (4 µm-thick) were stained with HE and Masson staining according to standard procedure. In HE staining, hematoxylin staining was performed for 2 min, and then the samples were soaked in warm water for 1 min, and then eosin staining was performed for 30 s. In Masson staining, stain with Weigert iron hematoxylin solution for 5 min, then with Masson blue solution for 3–5 min, and finally with aniline blue solution for 1–2 min. The slides were observed under an ordinary optical microscope. For each section, five non-overlapping microscopic fields were randomly selected at the same magnification, avoiding large vessels and obvious artifacts. The collagen volume fraction (CVF) was calculated using ImageJ, according to Equation (1):
 (1)
(1)
Enzyme-linked immunosorbent assay (ELISA)
After recording the ECG, the rats were anesthetized with sodium pentobarbital, and then a midline laparotomy was performed to collect venous blood. Blood samples were collected by puncture of the inferior vena cava using a disposable venous blood collection needle. The Blood was incubated at 4 °C overnight, and the supernatant was collected after centrifugation at 1000 × g for 20 min. Concentrations of CK-MB, AST, LDH, cTn-1, and h-FABP were determined using an ELISA assay kit. The ELISA was performed according to the manufacturer's instructions. The optical density (OD) values of each well were determined at 450 nm, using a microplate reader.
Western blotting analysis
Total protein was extracted from cardiac tissues using a protein extraction kit. A BCA Protein Assay kit was used to determine protein concentration. The total protein (The sample volume of the protein to be tested was 10 µL) was separated with 10% sodium dodecyl sulfate-polyacrylamide gel electrophoresis and transferred to PVDF membrane, blocking in 5% skimmed milk for 30 min. Subsequently, the membrane was incubated overnight with JNK1/2(1:500), p-JNK1/2 (1:1000), and GAPDH (1:4000) primary antibody. The next day, all membranes were washed with PBST three times, and then incubated with the appropriate secondary antibody (1:5000) for 1 h. Finally, enhanced chemiluminescence reagents were used for signal detection; the developing solution was evenly applied dropwise onto the PVDF membrane strips and allowed to incubate for 10 s, followed by exposure, development, and imaging. Western blot band intensities were measured using ImageJ software.
Molecular docking validation
The SDF 3D molecular structure of Aconitine was downloaded from the PubChem database, and the SDF structure was converted into a mol2 structure using OpenBabel software. The highest resolution and longest PDB protein structures of JNK1 and JNK2 were downloaded from the Uniprot and Protein Data Bank databases. Hydrogenation, ligand removal, and full hydrogen addition were performed on macromolecular proteins, while full hydrogen addition and electron loading were performed on small molecule compounds, and torsion bonds were set. Molecular docking experiments were performed via AutoDock Vina, where binding affinities ≤ -7.0 kcal/mol were defined as indicative of strong ligand-protein interactions. PyMol was used to visualize the 3D structure of the docking complex, and Discovery Studio was used to visualize the 2D structure of the docking complex.
Statistical analysis
All experiments were repeated three times independently. GraphPad Prism 8 was used to analyze and graph all data statistically. The data were all shown as mean ± standard deviation (SD). Student’s t-test was used for comparisons between two groups. For comparisons between multiple groups at the same time point or time-course analyses within the same group, one-way ANOVA was used. p < 0.05 was considered to indicate a statistically significant25.
Results
ECG results of rats following Acon gavage
Previous studies have demonstrated that the toxic effects of Aconitine occur in the early phase, typically within hours following administration26,27. Therefore, in order to capture the early occurrence and progression of acute cardiotoxicity within this time window, we selected three time points: 1 h, 3 h, and 6 h for the experiments. The electrocardiogram results showed that after 1 h, 3 h, and 6 h of Acon action, no arrhythmias occurred in the control group and the Acet group, and the ECG changes were not obvious. Rats in the Acon-1mg group had premature ventricular contractions and premature ventricular bigeminy, respectively, premature ventricular triplet, short burst ventricular tachycardia, monomorphic ventricular tachycardia, bidirectional ventricular tachycardia, and one or more ventricular arrhythmias. Rats in the Acon-2 mg group developed premature ventricular contractions, one or more ventricular arrhythmias, including premature ventricular bigeminy, short burst ventricular tachycardia, and bidirectional ventricular tachycardia (Figure 1, Supplementary Figures 1–2). Acon promotes myocardial pathological damage and increases collagen staining in rat myocardial tissue.
Myocardial tissue was evaluated by HE staining. The results showed that compared with the control group and Acet group, after 1 h, 3 h, and 6 h of Acon treatment, the myocardial tissue of SD rats in the Acon-1 mg group showed partial rupture of myocardial muscle fibers, disordered arrangement of myocardial cells, the myocardial interstitium is widened, edema occurs in the myocardial interstitium, most of the myocardial cells are swollen, the nuclei are deeply stained and condensed, a large number of myocardial cells undergo degeneration, and round vacuoles are formed in the myocardial fiber cytoplasm (indicated by arrows). The muscle fiber striations in the myocardial tissue of SD rats in the Acon-2 mg group were unclear or disappeared; the arrangement of muscle bundles was loose and disordered, the intermuscular spaces were widened, a large number of cell nuclei were deeply stained, nuclear pyknosis, intercellular edema, and myocardial cells were swollen and degenerated. The cytoplasm of myocardial fibers showed round vacuoles (shown by arrows) (Figure 2A, Supplementary Figure 3A, Supplementary Figure 4A).
Masson staining was performed to evaluate collagen deposition in myocardial tissue. In the Control and Acet groups, cardiomyocytes exhibited normal morphology, with minimal collagen deposition observed in the myocardial interstitium. In the Acon-1 mg group, mild increases in blue-stained collagen were observed in some interstitial areas. In the Acon-2 mg group, more extensive blue-stained regions were diffusely distributed throughout the myocardial tissue, accompanied by disorganized myofilament arrangement and disruption of normal myocardial structure. The extent of collagen staining in the Acon-2 mg group was greater than that in the Acon-1 mg group. Quantitative analysis showed that the collagen volume fraction (CVF) was significantly increased in both the Acon-1 mg and Acon-2 mg groups compared with the Control and Acet groups (n = 3 rats per group, one-way ANOVA, p < 0.05). Notably, the CVF value reached its highest level in the Acon-2 mg group at 6 h after intragastric administration (Figure 2B, Supplementary Figure 3B, Supplementary Figure 4B). Considering the short observation period (1–6 h), these findings are more likely to reflect acute interstitial changes, such as edema or alterations in collagen staining patterns, rather than established myocardial fibrosis. In addition, there was no significant difference in heart weight among the groups at 1 h, 3 h, and 6 h after Acon-1 mg or Acon-2 mg treatment (Table 5).
Acon promotes cardiac enzymes and cardiac protein levels in venous blood of rats
To evaluate Acon-induced myocardial damage, we measured serum levels of cardiac injury markers, including CK-MB, AST, LDH, cTn-I, and h-FABP. Compared with the Control and Acet groups, the Acon-1 mg and Acon-2 mg groups showed significantly increased levels of CK-MB, AST, LDH, cTn-I, and h-FABP at 1 h, 3 h, and 6 h (n = 3 rats per group, one-way ANOVA, p < 0.05). Moreover, at the same time points, the increases in these markers were more pronounced in the Acon-2 mg group than in the Acon-1 mg group (p < 0.05) (Figure 3).
Molecular docking results
To further examine the effect of Acon on the signaling pathway of myocardial damage in rats, we used molecular docking to identify Acon-related pathway proteins. The docking results showed that Acon could stably bind to the active pockets of both JNK1 and JNK2 through multiple non-covalent interactions. In JNK1, Aconitine formed two conventional hydrogen bonds with ALA267 and SER299, with bond distances of 2.0 Å and 2.1 Å, respectively, indicating strong directional interactions that contribute to ligand anchoring. In addition, extensive van der Waals interactions were observed between Aconitine and surrounding residues, facilitating close spatial complementarity within the binding pocket. Hydrophobic interactions, including Alkyl/π-Alkyl interactions with ILE304, further stabilized the ligand within the hydrophobic microenvironment. Carbon-hydrogen bonds were also identified, forming a cooperative interaction network that supports ligand binding (Figure 4A–C). In JNK2, Aconitine formed one conventional hydrogen bond with LEU302 (2.1 Å), serving as a key anchoring interaction. Similar to JNK1, van der Waals interactions, hydrophobic interactions, and carbon-hydrogen bonds collectively contributed to the stabilization of the ligand–protein complex (Figure 4D–F). The docking results for the tested compounds are reported as binding scores (kcal/mol) and presented in Table 6. Overall, hydrogen bonding provided specificity and anchoring, hydrophobic interactions enhanced ligand embedding and binding affinity, and van der Waals interactions contributed to overall complex stability. These findings indicate that Aconitine can form stable complexes with both JNK1 and JNK2, supporting its potential as a targeting agent.
Acon upregulates JNK phosphorylation level
To further investigate the effect of Acon on the JNK signaling pathway in myocardial tissue, the expression of JNK1/2 phosphorylation was assessed by Western blotting. Compared with the Control and Acet groups, the Acon-1 mg and Acon-2 mg groups showed significantly increased levels of p-JNK1/2 (n = 3 rats per group, one-way ANOVA, p < 0.05). Moreover, the phosphorylation level of JNK1/2 was significantly higher in the Acon-2 mg group than in the Acon-1 mg group (p < 0.05) (Figure 5A). Within the Acon-2 mg group, comparisons among different time points showed that p-JNK1/2 levels were significantly increased at 1 h, 3 h, and 6 h, with the highest level observed at 6 h (n = 3 rats per group, one-way ANOVA, p < 0.05) (Figure 5B). Based on these results, the Acon-2 mg group at 6 h was selected for subsequent experiments.
JNK inhibitor alleviates myocardial pathological damage and collagen staining in rat myocardial tissue
To further evaluate the regulatory role of the JNK signaling pathway, the expression levels of p-JNK1 and p-JNK2 in myocardial tissue were assessed by Western blotting. Compared with the Control and DMSO groups, the Acon group showed significantly increased expression levels of p-JNK1 and p-JNK2 (n = 3 rats per group, one-way ANOVA, p < 0.05). Compared with the Acon group, the Acon+SP600125 group showed significantly decreased levels of p-JNK1 and p-JNK2 (n = 3 rats per group, one-way ANOVA, p < 0.05). In contrast, compared with the Acon+SP600125 group, the Acon + Anis group showed significantly increased expression levels of p-JNK1 and p-JNK2 (n = 3 rats per group, one-way ANOVA, p < 0.05) (Figure 6).
The effects of Anis and SP600125 on myocardial damage were further investigated. The HE staining results showed that compared with the Acon group, the interstitial edema of the myocardial tissue in the Acon+SP600125 group was reduced, the swelling of some cardiomyocytes disappeared, and the cell cytoplasm was uniform. The muscle space is full, the intermuscular space becomes thinner, some myocardial fibers are arranged tightly and orderly, a small number of cell nuclei are deeply stained, and the cytoplasm of the myocardial fibers shows small round vacuoles, and myocardial pathological damage is alleviated. Compared with the Acon+SP600125 group, the Acon + Anis group had myocardial fibers broken, muscle gaps widened, myocardial fibers arranged loosely and disorderly, myocardial cells swollen and degenerated, nuclear chromatin was deeply stained, and intercellular edema occurred (Figure 7A).
Masson staining was performed to assess collagen staining in myocardial tissue. In the Acon+SP600125 group, moderate blue-stained areas were observed in the myocardial interstitium. Compared with the Acon group, the collagen volume fraction (CVF) in the Acon+SP600125 group was significantly reduced, indicating attenuation of Aconitine-induced interstitial changes. In contrast, in the Acon + Anis group, more extensive blue-stained collagen areas were observed in the myocardial interstitium compared with the Acon+SP600125 group, accompanied by a significant increase in CVF (n = 3 rats per group, one-way ANOVA, p < 0.05) (Figure 7B). In addition, there was no significant difference in heart weight among the groups (Table 5). Considering the short observation period (1–6 h), these changes are more likely to reflect acute interstitial alterations, such as edema or changes in collagen staining patterns, rather than established myocardial fibrosis. These findings suggest that SP600125 alleviates Aconitine-induced myocardial injury, whereas Anisomycin further aggravates myocardial damage under these experimental conditions.
JNK inhibitor alleviates the expression of cardiac enzymes and cardiac proteins in rat serum
ELISA results showed that compared with the Acon group, the expressions of CK-MB, AST, and LDH were significantly reduced in the Acon + SP600125 group, while the expressions of CK-MB, AST, and LDH increased after the action of Anis (n = 3 rats per group, one-way ANOVA, p < 0.05). In addition, compared with the Acon group, the expression of cTn-I and h-FABP was significantly reduced in the Acon + SP600125 group (n = 3 rats per group, one-way ANOVA, p < 0.05). Compared with the Acon + SP600125 group, the expression of cTn-I and h-FABP was significantly increased in the Acon + Anis group (n = 3 rats per group, one-way ANOVA, p < 0.05) (Figure 8A–8B).
DATA AVAILABILITY:
All the raw data used in this study are available in the supplementary files attached to the manuscript.
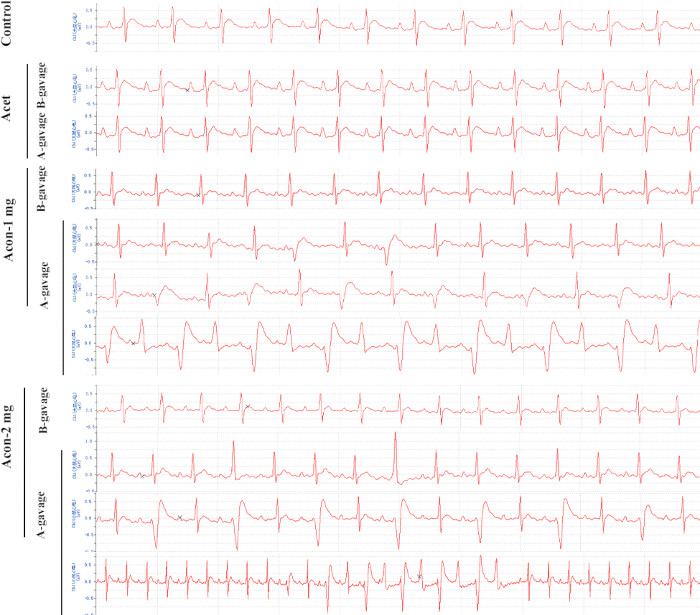
Figure 1: Electrocardiogram illustration of arrhythmia in rats (after 6 h of Acon action). From top to bottom, the Control group, the Acet group, the Acon-1 mg group, and the Acon-2 mg group. Types of arrhythmias in Acon-1mg-A-gavage and Acon-2 mg-A-gavage (in order of arrhythmia occurrence from top to bottom): Acon-1mg-A-gavage: premature ventricular contractions; premature ventricular bigeminy; bidirectional ventricular tachycardia. Acon-2 mg-A-gavage: premature ventricular contractions; premature ventricular bigeminy; short burst of ventricular tachycardia. Abbreviations; B-gavage = Before Acon gavage; A-gavage = After Acon gavage. Please click here to view a larger version of this figure.
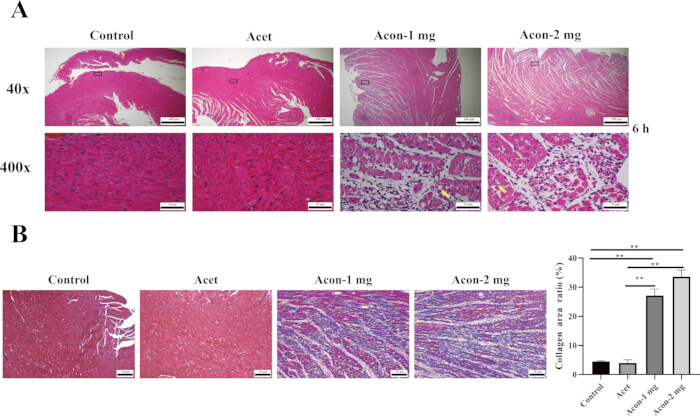
Figure 2: Myocardial damage and collagen staining in rat myocardial tissue indicated by HE and Masson staining. (A) The pathological changes in rat myocardial tissue were detected by HE staining (the yellow arrow indicates the round vacuoles formed by damaged cardiomyocytes); scale bar = 100 µm. (B) Collagen staining in rat myocardial tissue was detected by Masson staining; scale = 50 µm. Mean ± SD, n = 3. All P-values were calculated using independent one-way analysis of variance. *p < 0.05, **p < 0.01. 40x and 400x. Please click here to view a larger version of this figure.
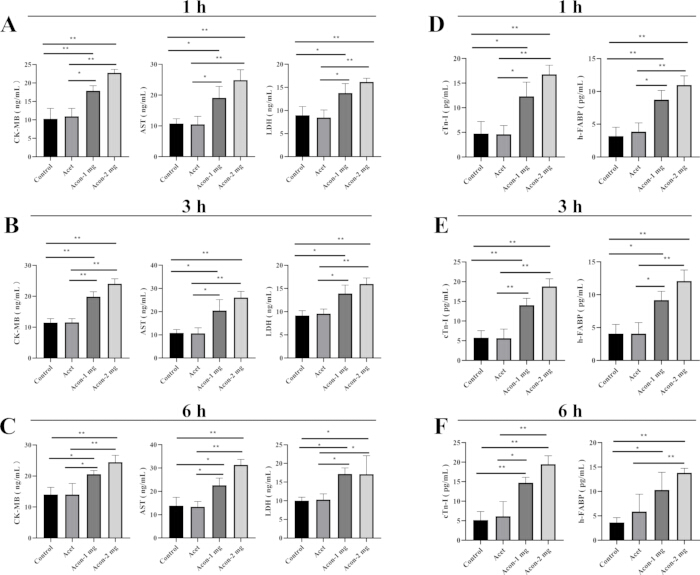
Figure 3: The levels of CK-MB, AST, LDH, cTn-I, and h-FABP in rat serum indicated myocardial damage. (A–F). The levels of CK-MB, AST, LDH, cTn-I, and h-FABP were measured using ELISA kits. Mean±SD, n = 3. All p-values were calculated using independent one-way analysis of variance. *p < 0.05, **p < 0.01. Abbreviations; CK-MB = Creatine Kinase-MB; AST = Aspartate aminotransferase; LDH = Lactate dehydrogenase; cTn-I = Cardiac Troponin I; h-FABP = heart type fatty acid binding protein. Please click here to view a larger version of this figure.
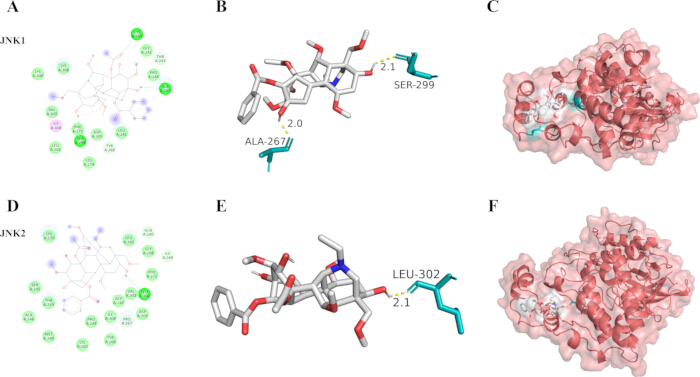
Figure 4: Results of molecular docking of Acon with the JNK pathway. (A–B) and (D–E) The 2D interaction diagrams of Acon with the JNK1/2 protein. (C) and (F) The 3D interaction diagrams of Acon with the JNK1/2 protein. Abbreviations; JNK = c-Jun N-terminal Kinase. Please click here to view a larger version of this figure.
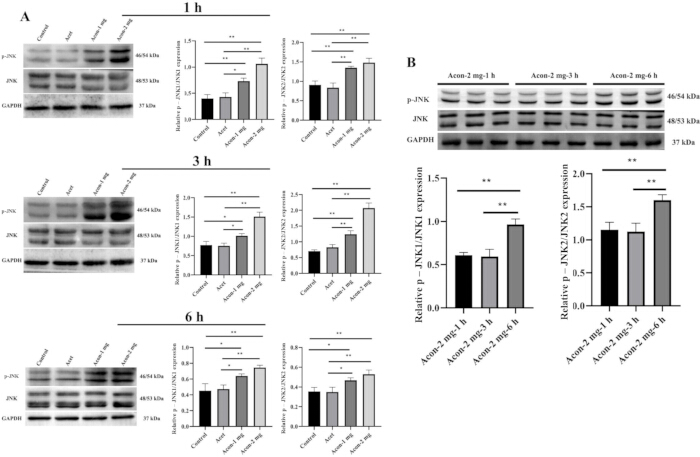
Figure 5: Acon upregulates JNK phosphorylation level. (A–B) The expression levels of p-JNK1/2 and JNK1/2 in rat myocardial tissues were detected by Western blotting. Mean ± SD, n = 3. All p-values were calculated using independent one-way analysis of variance. *p < 0.05, *p < 0.01. Please click here to view a larger version of this figure.
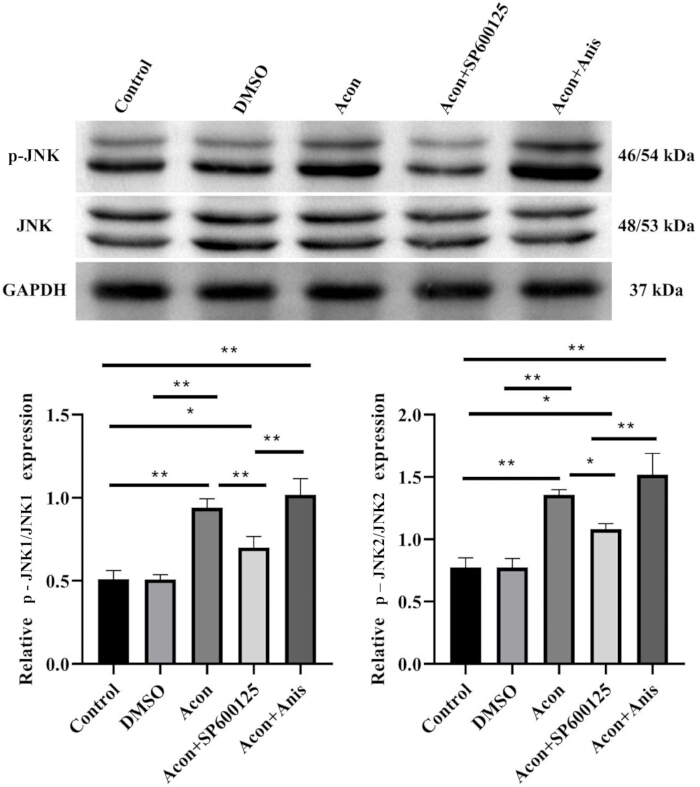
Figure 6: JNK inhibitor inhibits Acon-induced JNK phosphorylation. The expression levels of p-JNK1/2 and JNK1/2 in rat myocardial tissues were detected by Western blotting. Mean ± SD, n = 3. All p-values were calculated using independent one-way analysis of variance. *p < 0.05, **p < 0.01. Please click here to view a larger version of this figure.
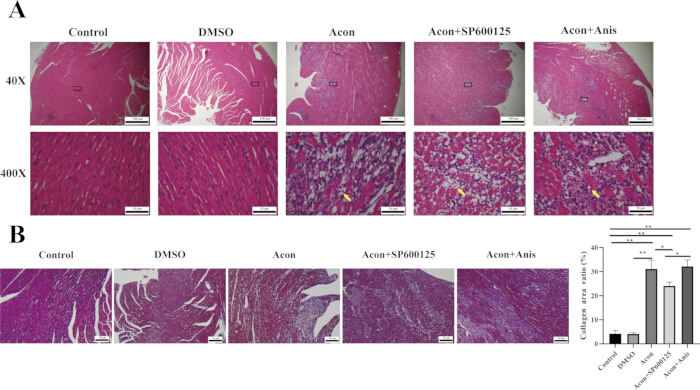
Figure 7: JNK inhibitor alleviates myocardial pathological damage and collagen staining in rats. (A) The pathological changes in rat myocardial tissues were detected by HE staining ( the yellow arrow shows the round vacuoles formed by damaged cardiomyocytes); scale = 100 µm. (B) Collagen staining in rat myocardial tissue was detected by Masson staining; scale = 50 µm. Mean±SD, n = 3. All p-values were calculated using independent one-way analysis of variance. *p < 0.05, **p < 0.01. 40 and 400x. Please click here to view a larger version of this figure.
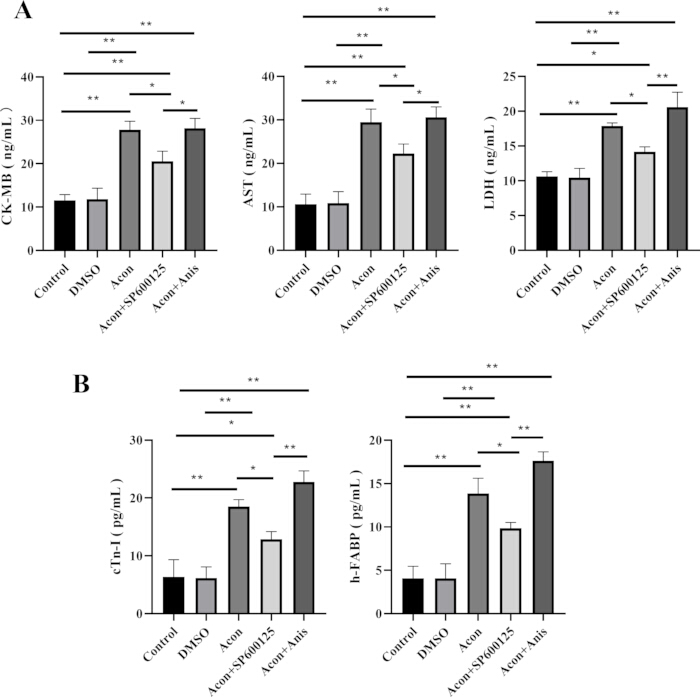
Figure 8: JNK inhibitor downregulates the levels of CK-MB, AST, LDH, cTn-I, and h-FABP in rat serum. (A–B) The levels of CK-MB, AST, LDH, cTn-I, and h-FABP expression were detected by ELISA assay kits. All p-values were calculated using independent one-way analysis of variance. Mean±SD, n = 3. *p < 0.05, **p < 0.01. Abbreviations; CK-MB = creatine kinase-MB; AST = aspartate aminotransferase; LDH = lactate dehydrogenase; cTn-I = cardiac troponin I; h-FABP = heart type fatty acid binding protein. Please click here to view a larger version of this figure.
| Control | Acet | Acon-1 mg | Acon-2 mg | |
| Rats | 9 | 9 | 9 | 9 |
| Number of rat deaths | 0 | 0 | 0 | 0 |
Table 1: Number of rat deaths after 1 h of Acon action. 1 h after Acon administration, no rats died in the Control group, Acet group, Acon-1 mg group, and Acon-2 mg group. (The number of animals finally included in the analysis per group was 3, and dead rats were not replaced).
| Control | Acet | Acon-1 mg | Acon-2 mg | |
| Rats | 9 | 9 | 9 | 9 |
| Number of rat deaths | 0 | 0 | 0 | 0 |
Table 2: Number of rat deaths after 3 h of Acon action. 3 h after Acon administration, no rats died in the Control group, Acet group, Acon-1 mg group, and Acon-2 mg group. (The number of animals finally included in the analysis per group was 3, and dead rats were not replaced).
| Control | Acet | Acon-1 mg | Acon-2 mg | |
| Rats | 9 | 9 | 9 | 9 |
| Number of rat deaths | 0 | 0 | 4 | 4 |
Table 3: Number of rat deaths after 6 h of Acon action. 6 h after Acon administration, 4 out of 9 rats died in the Acon-1 mg group, and 4 out of 9 rats died in the Acon-2 mg group. (The number of animals finally included in the analysis per group was 3, and dead rats were not replaced).
| Control | DMSO | Acon | Acon + SP600125 | Acon + Anis | |
| Rats | 9 | 9 | 9 | 9 | 9 |
| Number of rat deaths | 0 | 0 | 3 | 1 | 3 |
Table 4: Number of rat deaths after Anis and SP600125 action. The number of rat deaths varied among different treatment groups: in the Acon-2 mg group, 3 out of 9 rats died; in the Acon+SP600125 group, 1 out of 9 rats died; and in the Acon + Anis group, 3 out of 9 rats died. (The number of animals finally included in the analysis per group was 3, and dead rats were not replaced).
| Group | Heart weight (g) |
| Control | 0.71 ± 0.03 |
| Acet | 0.73 ± 0.02 |
| Acon-1mg (1 h) | 0.73 ± 0.06 |
| Acon-2mg (1 h) | 0.75 ± 0.02 |
| Acon-1mg (3 h) | 0.71 ± 0.04 |
| Acon-2mg (3 h) | 0.77 ± 0.03 |
| Acon-1mg (6 h) | 0.72 ± 0.03 |
| Acon-2mg (6 h) | 0.77 ± 0.02 |
| DMSO | 0.70 ± 0.03 |
| Acon + SP600125 | 0.74 ± 0.03 |
| Acon + Anis | 0.75 ± 0.04 |
Table 5: The heart weight of rats. There was no significant difference in heart weight among the groups.
| Ligand | JNK1 | JNK2 |
| Acon | -7.8 Kcal/mol | -8.41 Kcal/mol |
Table 6: Results of the molecular docking studies. The docking scores between Acon and JNK1 are -7.8 Kcal/mol, and the docking scores between Acon and JNK2 are -8.41 Kcal/mol.
Supplementary Figure 1: Electrocardiogram illustration of arrhythmia in rats (after 1 h of Acon action). From top to bottom, the Control group, the Acet group, the Acon-1 mg group, and the Acon-2 mg group. Types of arrhythmias in Acon-1mg-A-gavage and Acon-2 mg-A-gavage (in order of arrhythmia occurrence from top to bottom): premature ventricular contractions; premature ventricular bigeminy; premature ventricular triplet; short burst ventricular tachycardia; monomorphic ventricular heartbeat Tachycardia; bidirectional ventricular tachycardia. Acon-2 mg-A-gavage: Bidirectional ventricular tachycardia. Abbreviations; B-gavage = Before Acon gavage; A-gavage = After Acon gavage. Please click here to download this file.
Supplementary Figure 2: Electrocardiogram illustration of arrhythmia in rats (after 3 h of Acon action). From top to bottom, the Control group, the Acet group, the Acon-1 mg group, and the Acon-2 mg group. Types of arrhythmias in Acon-1mg-A-gavage and Acon-2 mg-A-gavage (in order of arrhythmia occurrence from top to bottom): Premature ventricular contractions; short bursts of ventricular tachycardia; bidirectional ventricular tachycardia. Acon-2 mg-A-gavage: Premature ventricular contractions; bidirectional ventricular tachycardia. Abbreviations; B-gavage = Before Acon gavage; A-gavage = After Acon gavage. Please click here to download this file.
Supplementary Figure 3: Acon promotes myocardial damage and collagen staining after 1 h of Acon action. (A) The pathological changes in rat myocardial tissues were detected by HE staining (Note: the yellow arrow shows the round vacuoles formed by damaged cardiomyocytes); scale = 100 µm. (B) Fibrosis in rat myocardial tissue was detected by Masson staining; scale = 50 µm. Mean ± SD, n = 3. All p-values were calculated using independent one-way analysis of variance. *p < 0.05, **p < 0.01, 40x and 400x.Please click here to download this file.
Supplementary Figure 4: Acon promotes myocardial damage and collagen staining after 3 h of Acon action. (A) The pathological changes in rat myocardial tissues were detected by HE staining (the yellow arrow shows the round vacuoles formed by damaged cardiomyocytes); scale = 100 µm. (B) Collagen staining in rat myocardial tissue was detected by Masson staining; scale = 50 µm. Mean ± SD, n = 3. All p-values were calculated using independent one-way analysis of variance. *p < 0.05, **p < 0.01. 40x and 400x.Please click here to download this file.
Discussion
Acon can induce arrhythmias and myocardial damage; however, the underlying mechanisms of Acon-induced myocardial damage remain unclear. In this study, a rat model of acute Acon poisoning with myocardial injury was successfully established. These results demonstrated that activation of the JNK signaling pathway may represent a key downstream mechanism in myocardial damage induced by acute Acon poisoning. Specifically, JNK1/2 phosphorylation levels were significantly elevated in rats with Acon-induced arrhythmias and myocardial damage. Furthermore, inhibition of the JNK pathway partially reversed the myocardial damage caused by acute Acon poisoning. These findings suggest that activation of the JNK pathway plays an important role in the pathogenesis of Aconitine-induced myocardial damage.
The main cause of death from acute Acon poisoning is cardiotoxicity. Previous studies have shown that after Acon treatment, myocardial fibers in rats became degenerated and disordered, nuclear staining deepened, neutrophil infiltration occurred, and round vacuoles appeared28. It is consistent with the research results. The HE staining revealed that myocardial tissue in the Acon-treated group exhibited pathological changes, including disordered muscle bundle arrangement, widening of muscle gaps, and rupture of muscle fibers. In addition, under normal conditions, cardiac enzymes CK-MB, AST, LDH, and cardiac proteins cTn-I and h-FABP are found in very small amounts in the serum29. When myocardial cells are damaged, these markers will be released into the blood in large amounts30,31,32,33.
The results of this study show that CK-MB, AST, LDH, cTn-I, and h-FABP in the venous serum of rats in the Acon gavage group increased to varying degrees at each observation time point. The expression level is highest after 6 h in the intragastric administration. This finding is consistent with previous studies34. They found that Acon caused damage to rat H9C2 cardiomyocytes and increased AST levels. Meanwhile, previous studies used Acon to induce myocardial damage in rats to study the effects of antidotes on myocardial damage35. They found that the levels of LDH and CK-MB in the serum of rats with myocardial damage were elevated. In short, the experimental results of the joint detection of myocardial damage markers show that the rat model of myocardial damage induced by acute Acon poisoning can be successfully established 1, 3, and 6 h after intragastric administration of 1–2 mg/kg Acon. The modeling effect of 2 mg/kg Acon after intragastric administration for 6 h is the best, which meets the requirements of subsequent experiments.
Studies have found that the effect of Acon on Na+ and Ca2+ ion channels leads to an increase in intracellular calcium ion concentration, which further activates the P38-MAPK signaling pathway and subsequently triggers the JNK cascade reaction36,37,38. JNK activation will promote myocardial damage39,40. This is consistent with the results of this experiment. In this study, we found that Acon promoted JNK1/2 phosphorylation in cardiomyocytes and activated the JNK signaling pathway. This suggests that JNK activation may represent a downstream signaling response that contributes to Aconitine-induced myocardial damage. However, the molecular and pharmacokinetic mechanisms underlying Acon's stimulation of JNK1/2 phosphorylation require further investigation.
Studies have shown that when a large amount of JNK1/2 is phosphorylated, the JNK signaling pathway is activated, which in turn mediates the uncontrolled expression of genes in the nucleus of cardiomyocytes and disrupts the cell cycle. Inhibition of the JNK signaling pathway can alleviate myocardial damage41,42. In the HE results, the JNK pathway inhibitor SP600125 can significantly reduce the pathological changes in myocardial tissue induced by Acon. Meanwhile, previous studies demonstrated that, in a rat model of acute myocardial infarction induced by coronary artery ligation, blue-stained collagen fibers and collagen deposition in myocardial tissue were markedly increased, accompanied by activation of the JNK signaling pathway. Treatment with traditional Chinese medicine granules reduced myocardial collagen deposition through inhibition of the JNK signaling pathway43,44 .
In rats with diabetic myocardial injury, the collagen fiber content (blue staining) and collagen volume fraction (CVF) were significantly increased. Concurrently, the JNK signaling pathway was activated. Low-dose ethanol has been reported to inhibit JNK pathway activation, thereby attenuating the increase in collagen fiber deposition and CVF in rat myocardial tissue45. In the present study, molecular docking analysis indicated that Aconitine may interact with JNK1 and JNK2 through multiple non-covalent interactions; however, these results should be considered supportive evidence and do not constitute direct proof of physiological binding. Furthermore, in vivo experiments demonstrated that Acon, as a stressor, upregulated JNK1/2 phosphorylation, thereby activating the JNK signaling pathway. This activation was associated with increased collagen deposition (blue staining) and elevated CVF in rat myocardial tissue, ultimately leading to myocardial damage. However, the addition of JNK inhibitor SP600125 significantly inhibited the toxic effects of Acon, reducing the increase in CVF value of myocardial tissue. Myocardial damage disrupts normal cardiac myocyte membrane integrity and loss of intracellular content into the extracellular space, which manifests as increased levels of myocardial enzymes in the blood46,47. These results showed that the increase in myocardial enzyme levels in rat blood also indicated that Acon caused myocardial damage. At the same time, JNK inhibitors inhibited the secretion of myocardial enzymes, suggesting that JNK inhibitors could partially alleviate the myocardial damage caused by Acon.
Several limitations of this study should be acknowledged. First, the sample size at each time point was relatively small (n = 3 per group), which may limit the statistical power of the analyses, and no formal power analysis was performed before sample-size determination. In addition, only a single Aconitine dose range and relatively short observation periods (1–6 h) were evaluated, which limited assessment of longer-term pathological changes and dose response relationships. Second, although increased JNK1/2 phosphorylation and pharmacological intervention suggested the involvement of the JNK signaling pathway in Aconitine-induced myocardial injury, the upstream mechanisms linking Aconitine exposure to JNK activation were not fully investigated. Aconitine is known to primarily affect voltage-gated Na⁺ channels and intracellular Ca2⁺ homeostasis, which may contribute to downstream JNK activation. However, related signaling events, including oxidative stress and calcium-overload pathways, were not directly examined in the present study. Third, the molecular docking analysis only provided supportive evidence for potential interactions between Aconitine and JNK1/2 and did not represent direct physiological binding. No additional experimental validation, such as surface plasmon resonance or pull-down assays, was performed. Furthermore, only JNK1/2 were investigated, while the potential role of JNK3 in Aconitine-induced cardiotoxicity remains unclear. Finally, an electrocardiographic assessment was not performed after SP600125 or anisin intervention. Therefore, whether the JNK pathway regulation directly affects Aconitine-induced ventricular arrhythmias requires further investigation.
In summary, Acon activates the JNK signaling pathway, as evidenced by increased phosphorylation of JNK1/2, which may contribute to myocardial damage, as indicated by enhanced collagen deposition and elevated cardiac enzyme release in rat myocardial tissue. Considering that Aconitine-induced cardiotoxicity involves multiple upstream events, including Na⁺ channel activation, Ca2⁺ overload, and oxidative stress, activation of the JNK pathway may represent a key downstream signaling event contributing to myocardial damage.
Disclosures
This manuscript has previously been posted as a preprint on Research Square prior to peer review and publication consideration. The preprint is available at: https://doi.org/10.21203/rs.3.rs-4218950/v148. The authors declare no competing interests.
Acknowledgements
This work was supported by the National Natural Science Foundation of China (82260387).
Materials
| Name | Company | Catalog Number | Comments |
|---|---|---|---|
| 4% Paraformaldehyde | Wuhan Service-bio Co., Ltd. | HJ203501 | Tissue fixation |
| Aconitine (Acon) | Chengdu DeSiTe Biological Technology Co., Ltd. | drk-0335-960330 | Toxic compound for gavage model |
| Aniline Blue Solution | Beijing Solarbio Co., Ltd. | G1350 | Masson staining |
| Anisomycin (Anis) | MedChemExpress Co., Ltd. | 153154 | JNK pathway activator/control |
| AST ELISA Kit | Wuhan Huamei Biotechnology Co., Ltd. | CSB-E13023r | Cardiac enzyme detection |
| AutoDock Vina | Open-source | N/A | Molecular docking |
| BCA Protein Assay Kit | Sangon Biotech (Shanghai, China) | Not specified | Protein quantification |
| Centrifuge | Dongguan cnzcn Co., Ltd. | TD5M-WS | 1000 × g centrifugation |
| Chem3D Software | PerkinElmer | N/A | Ligand energy minimization |
| CK-MB ELISA Kit | Wuhan Huamei Biotechnology Co., Ltd. | CSB-E14403r | Cardiac enzyme detection |
| cTn-I ELISA Kit | Wuhan Huamei Biotechnology Co., Ltd. | CSB-E08594r | Cardiac protein detection |
| Disposable Venous Blood Collection Needle | KINDLY Co., Ltd. | https://www.kdlchina.cn/specimen-collection/220.html | Blood collection |
| Enhanced Chemiluminescence (ECL) Reagent | Millipore Co., Ltd. | 21302A4 | Western blot visualization |
| Eosin | Beijing Solarbio Co., Ltd. | 20200905 | H&E staining |
| GraphPad Prism 8 | GraphPad Software, Inc. | N/A | Statistical analysis |
| Hematoxylin | Wuhan Service-bio Co., Ltd. | CR2203066 | H&E staining |
| h-FABP ELISA Kit | Wuhan Huamei Biotechnology Co., Ltd. | CSB-E16184r | Cardiac protein detection |
| ImageJ Software | National Institutes of Health (NIH) | N/A | Western blot quantification |
| JNK1/2 Primary Antibody | HuaAn Biotechnology (Hangzhou, China) | ET1609-42 | Western blot antibody |
| LDH ELISA Kit | Shanghai Enzyme-Linked Biotechnology | ml003416 | Cardiac enzyme detection |
| Masson Blue Solution | Beijing Solarbio Co., Ltd. | 20220303 | Masson staining |
| Microplate Reader | Thermo Fisher Scientific | ME001000C | ELISA OD measurement (450 nm) |
| Optical Microscope (Olympus C33) | Olympus (Tokyo, Japan) | C33 | Histology imaging |
| Paraffin Wax | Leica Co., Ltd. | 2110068 | Tissue embedding |
| PBST Buffer | Meilunbio Co., Ltd. | MA0015-Apr-27G2 | Washing buffer |
| p-JNK1/2 Primary Antibody | HuaAn Biotechnology (Hangzhou, China) | ET1601-28 | Phosphorylated JNK antibody |
| Protein Data Bank (PDB) | RCSB | https://www.rcsb.org/ | Protein structure source |
| Protein Extraction Kit | Sangon Biotech (Shanghai, China) | C510003-0050 | Tissue protein extraction |
| PubChem Database | NIH | https://pubchem.ncbi.nlm.nih.gov | Ligand structure source |
| PVDF Membrane | Millipore Co., Ltd. | R1PB81493 | Western blot transfer membrane |
| PyMOL | Schrödinger, Inc. | https://pymol.org/ | Docking visualization |
| SDS-PAGE Gel (10%) | Beijing Solarbio Co., Ltd. | 817X031 | Protein electrophoresis |
| Skimmed Milk Powder | Beijing Solarbio Co., Ltd. | http://www.solarbio-hd.com/solarbiohd-Products-23261665/ | Blocking reagent (5%) |
| Sodium Pentobarbital | Thermo Fisher Scientific Inc. | 57-33-0 | Anesthetic for animal procedures |
| SP600125 (JNK inhibitor) | MedChemExpress Co., Ltd. | 112518 | JNK pathway inhibitor |
| SPF Animal Housing Facility | Kunming Medical University | N/A | Animal housing conditions |
| Sprague-Dawley Rats (male, 2 months, ~230 g) | Beijing Huafukang Biological Technology Co., Ltd. | http://www.hfkbio.com/ | Experimental animals (n = 51) |
| Weigert Iron Hematoxylin | Guangzhou Wexis Co., Ltd. | 18092001 | Masson staining |
| Xylene | Tianjin Tjhxsj Co., Ltd. | 20220208 | Tissue clearing |