This study describes the dietary assessment protocol for the U-DINE Study, a multi-site longitudinal investigation of dietary quality, nutritional inadequacies, and modifiable risk and protective factors across the oropharyngeal cancer care continuum, from diagnosis through long-term survivorship.
Method Article
Quantifying Diet Quality Across Critical Periods of Cancer Survivorship: A Longitudinal Study
In This Article
Summary
Abstract
The uncovering the long-term impact of oropharyngeal cancer and dysphagia on dietary quality and nutrition among cancer survivors (U-DINE) Study is a multisite longitudinal investigation of diet quality and nutritional risk across the oropharyngeal cancer (OPC) care continuum. U-DINE integrates dietary, clinical, and swallowing assessments from two clinical cohorts. Adults with primary, non-recurrent OPC are assessed at diagnosis, 3–6 months post-treatment, and 18–24 months post-treatment using standardized 24-hour dietary recalls and measures of food and nutrition security, barriers to healthy eating, and malnutrition risk. Among 333 participants, poor diet quality was pervasive. Very low (HEI-2020 51–70) or critically low (HEI-2020 ≤50) diet quality was observed in 130 of 132 participants (98.5%) at diagnosis, 35 of 36 (97.2%) post-treatment, and 158 of 165 (95.8%) during long-term survivorship; none had adequate diet quality. Critically low diet quality was observed in 35 of 58 non-White versus 154 of 275 White participants (60.3% vs. 56.0%), 18 of 27 females versus 171 of 306 males (66.7% vs. 55.9%), and 163 of 283 participants with HPV-positive versus 16 of 29 with HPV-negative tumors (57.6% vs. 55.2%). Among post-treatment and long-term survivors, critically low diet quality was observed in 8 of 10 participants treated with surgery alone (80.0%), 72 of 125 receiving radiation and chemotherapy (57.6%), 17 of 33 receiving radiation only (51.5%), and 15 of 30 receiving surgery plus radiation with or without chemotherapy (50.0%). Overall, 14 participants (4.2%) were lost to follow-up or withdrew. U-DINE findings demonstrate pervasive poor diet quality across OPC survivorship and support the feasibility of comprehensive dietary assessment. Its longitudinal design provides a framework for identifying dietary risk and barriers to healthy eating and informing targeted interventions across the cancer care continuum.
Introduction
Poor diet quality is a leading modifiable contributor to morbidity, premature mortality, and disability among adults in the United States and worldwide1. Among individuals with cancer, suboptimal dietary patterns during and after treatment may compound malnutrition and functional decline2,3,4, increase risk of cardiovascular disease and mortality5,6,7, yet diet quality remains underassessed and underprioritized in routine oncology care. These concerns are particularly relevant for individuals with oropharyngeal cancer (OPC)8,9, a growing subgroup of cancer survivors who frequently experience treatment-related impairments in swallowing, taste, and salivary function that can constrain food choice and tolerability3,4. Although nutrition is increasingly recognized as central to reducing the chronic disease burden and improving the quality of life of cancer survivors10,11,12,13, diet quality across the cancer care continuum remains poorly characterized, particularly among individuals with OPC. Moreover, little is known about the clinical and functional factors that shape dietary patterns in this population or how dietary patterns relate to survivorship outcomes. Rigorous, longitudinal dietary assessments are therefore needed to characterize diet quality across the OPC care continuum and inform the development of evidence-based dietary programs, practice change, and interventions that are practical, scalable, and responsive to the challenges faced by individuals diagnosed with OPC.
The “uncovering the long-term impact of oropharyngeal cancer and dysphagia on dietary quality and nutrition among cancer survivors (U-DINE) Study is an observational, clinic-based, multi-site longitudinal study designed to address these knowledge gaps. U-DINE characterizes diet quality and related risk factors among individuals diagnosed with OPC at the time of diagnosis, 3-6 months post-treatment, and 18+ months after treatment. The U-DINE study also includes comprehensive swallowing assessments, the methodology for which has been previously described10,11,12,13,14,15. The present manuscript focuses on the U-DINE dietary assessment protocol, including strategies for timely data collection using detailed dietary assessment alongside brief, validated complementary measures of food and nutrition security screening, including barriers to healthy eating. By presenting a pragmatic and reproducible framework for assessing diet quality in individuals with OPC, this work aims to support the application of rigorous dietary assessment methods in oncology research and enable targeted interventions to improve diet quality across the survivorship continuum.
Protocol
The U-DINE Study is an ongoing prospective, open-cohort study initiated in 2021 to examine diet quality across the cancer care continuum among individuals diagnosed with OPC16,17. Eligible participants were adults aged ≥18 years with a first pathologically confirmed diagnosis of primary, non-recurrent OPC. Participants were identified and recruited at the Michael E. DeBakey Veterans Affairs Medical Center, affiliated with Baylor College of Medicine, and the University of Texas MD Anderson Cancer Center in Houston, Texas. Trained research staff screened clinic schedules to identify potentially eligible patients, who were approached during routine clinic visits or contacted by telephone. As part of the open-cohort design, participants could enter the study at diagnosis, 3–6 months after treatment completion, or during long-term survivorship (≥18 months after treatment completion). Participants enrolled at diagnosis or 3–6 months post-treatment were followed prospectively through long-term survivorship. At each of the three study timepoints, detailed dietary assessments were conducted by a registered dietitian using two nonconsecutive weekday 24-hour dietary recalls within a 7-day period. This approach was designed to balance methodological rigor with participant and clinical care team burden, an important consideration across the cancer care continuum, while supporting participation and completeness of dietary data collection. Dietary assessment was conducted in person or by telephone by a registered dietitian using the nutrition data system for research, version 202118,19. The study dietitian received centralized training through the nutrition coordinating center and completed Nutrition Data System for Research (NDSR) certification prior to conducting dietary assessments. In addition, centralized study-specific training was provided at UTHealth to ensure standardized implementation of the dietary assessment protocol across study sites. Because all dietary assessments were conducted by a single study dietitian, inter-rater reliability assessments were not applicable.
Information on sociodemographic and relevant clinical characteristics, including age, sex, race/ethnicity, smoking history, diagnosis, tumor subsite, stage, human papillomavirus (HPV) status, and treatment modality, was obtained from parent study registries16. Registry data were cross-checked against electronic health records, with chart review used to verify information and reconcile discrepancies. Baylor College of Medicine served as the single Institutional Review Board of record (protocol H-49471). The study was conducted in accordance with applicable ethical principles for research involving human participants, including the Declaration of Helsinki and the Belmont Report. All participants provided written informed consent prior to data collection. All the platforms used in this study are listed in the Table of Materials.
1. Participant scheduling and dietary recall timeline
- Schedule dietary data collection at predefined study time points or cancer survivorship stage: pre-treatment, 3-6 months post-treatment, and 18-24 months post-treatment.
- For each time point, conduct two nonconsecutive weekday 24 h dietary recalls within a 7-day period.
- Document treatment timing and cancer survivorship stage.
2. Preparation for the 24 h dietary recall interview
- Prior to the interview, complete participant identifiers and intake date in the dietary assessment software header.
- Confirm participant contact information, availability, and preferred interview modality (i.e., in person or by phone).
- For participants interviewed by telephone, confirm that they have received and have access to portion-size estimation materials prior to the interview.
- Prepare all required dietary forms and confirm secure data storage access.
3. Conducting the 24 h dietary recall using the NDSR multi-pass approach19
NOTE: Steps 3.1 through 3.7 are conducted using the NDSR software.
- Interview Introduction
- Begin the interview by establishing rapport and explaining the purpose of the recall.
- Inform participants that there are no right or wrong answers and that all reported intake is acceptable.
- Confirm readiness to proceed and answer any participant questions.
- Quick list pass
- Ask the participant to list all foods and beverages consumed during the previous day (midnight to midnight).
- Enter all reported items sequentially without interruption, recording each eating occasion as prompted by the software.
- Avoid probing for detail at this stage to allow uninterrupted recall.
- Review and probing of the quick list
- Read back the complete Quick List to the participant.
- Probe for commonly forgotten items (e.g., beverages, snacks, condiments).
- Use the multiple-pass approach to prompt recall of commonly missed items, such as sauces, condiments, caffeinated beverages, alcoholic beverages, added sugars, and fruits and vegetables consumed as snacks. Identify time gaps exceeding 4 h and ask targeted questions to assess missing intake.
- Correct errors and add omitted foods or beverages as needed.
- Collection of meal and food details
- For each eating occasion, record meal time, meal name, and meal location using participant report or standardized approximations if exact times are unavailable.
- For each food and beverage, collect detailed descriptions including preparation method, source, and ingredients.
- Ask about additions (e.g., sauces, sweeteners) for each food item before proceeding.
- If a food is not available in the database, enter it using the missing food function and document all available details.
- Portion size estimation
- Ask open-ended questions to determine the amount consumed for each item.
- Use standardized portion estimation tools only when needed to clarify reported amounts.
- Confirm whether the reported portion reflects the amount consumed rather than served.
- Document unusual portions or uncertainty using the software notes field.
- Final review of dietary intake
- Conduct a final pass through the full day’s intake, reading back foods and amounts.
- Probe again for missed items, particularly during long time gaps.
- Document skipped meals or atypical intake patterns in the notes field.
- Dietary supplement and oral nutrition supplement assessment
- Immediately following the dietary recall, assess all dietary supplements, oral nutrition supplements, tube feeding formulas, and over-the-counter antacids consumed during the same 24 h period.
- Use standardized software prompts to query supplement categories sequentially.
- Select matching products from the database using container labels when available.
- If no match is found, enter supplements using generic, default, or missing product options and document ingredient details.
- Record frequency and quantity of supplement use during the recall period.
- Identify participants reporting tube feeding formulas and document tube feeding use at the time of dietary assessment. If a participant reports no tube feeding intake in the previous 24 hours, record tube feeding status as not using tube feeding at that time.
- Additional nutrition-related assessments
- Food insecurity screening
- Administer the Vital Sign two-question screening tool20 using an electronic data capture platform.
- Interpret responses of “often true” or “sometimes true” to either item as a positive screen.
- Nutrition security screening
- Assess nutrition security using a modified Nutrition Security Screener (NSS)21, adapted to include barriers specific to OPC care (see Supplemental Table 1).
- Interpret responses of “very hard,” “hard,” or “somewhat hard” to any screener item as a positive screen for nutrition insecurity. For individuals who screen positive, obtain information on specific barriers to healthy eating.
- Normalcy of diet
- When this assessment is not included in the site-specific protocol, assess diet normalcy using the performance status scale for head and neck cancer patients(PSS-HN)22.
- Food insecurity screening
- Post-interview review and data quality assurance
- Review all dietary and supplement entries promptly following each interview to identify missing information or questionable entries.
- Resolve missing foods, missing supplements, and questionable entries using detailed interview notes.
- Conduct periodic quality assurance review of dietary data. Missing foods or other flagged entries are independently reviewed by the study statistician, with discrepancies or errors reconciled jointly with the study dietitian and corrected as needed.
- Ensure that documentation is sufficiently detailed to allow independent interpretation and verification of reported foods, beverages, supplements, and portion sizes.
- For participants who do not complete the second dietary interview within a given study period, document the incomplete assessment in the study database.
- Create secure daily backup files according to study data management procedures.
4. Estimating diet quality using the healthy eating index score (HEI-2020)
- Prepare data for scoring
- Identify the NDSR-generated output files needed to compute HEI-202023 (e.g., serving count daily intake totals file [File 09], daily intake totals file [File 04])19,24,25.
- Derive dietary constituents required for each HEI component by summing relevant subgroups as needed (e.g., Greens and Beans = dark-green vegetables + legumes).
- Ensure all dietary constituents have consistent units with the HEI-2020 index (e.g., cup equivalent for total fruits, oz equivalent for total protein). For example, convert sodium intake from milligrams to grams by dividing by 1,000.
- Calculate HEI-2020 individual component scores
- Apply the Simple HEI Scoring Algorithm Method26 to compute the HEI-2020 component scores for each recall day. A sample SAS code used to estimate the HEI-2020 scores is available on the National Cancer Institute website (https://epi.grants.cancer.gov/hei/sas-code.html).
- Convert relevant dietary constituents to density unit (amount per 1,000 kcal) for each component where applicable (e.g., total fruits, whole fruits, total vegetables).
- Compute the fatty acids component as the ratio of (monounsaturated fatty acids + polyunsaturated fatty acids) to saturated fatty acids. Express saturated fat and added sugars as a percent of total energy using standard conversions (e.g., added sugars [g] × 4 kcal/g = kcal from added sugars).
- Score each component according to the HEI-2020 minimum/maximum standards, assigning proportional scores for intermediate values.
- Calculate the total HEI-2020 score
- Sum the 13 component scores to calculate an individual’s total HEI-2020 score (range 0-100) for each recall assessment.
- Calculate the mean score of total HEI-2020 and each component score across the two recall assessments conducted for each study period (i.e., at diagnosis, post-treatment, or long-term survivorship). See Supplementary Tables 2–3 for a detailed list of HEI-2020 components and corresponding food groups.
- Statistical analysis
- Summarize participant characteristics and diet quality measures using descriptive statistics.
- Summarize age using means and standard deviations, and summarize categorical variables using frequencies and percentages.
NOTE: To facilitate interpretation of overall diet quality, HEI-2020 scores were grouped into study-defined categories as critically low (≤50), very low (51–70), moderately low (71–90), or within an adequate range (91–100). - Define these categories a priori by the study team for descriptive purposes and do not represent established HEI-2020 clinical cut points.
NOTE: The proportions of participants with critically low and very low diet quality were further described across key demographic and clinical characteristics, including race, sex, tumor HPV status, and tumor subsite and treatment modality. These subgroup analyses were conducted to illustrate how this dietary assessment approach could be used to identify groups with greater nutritional vulnerability who may benefit from targeted dietary interventions as part of cancer care. No regression modeling or formal hypothesis testing was performed because the primary objective of this analysis was descriptive. The analytic sample included all eligible participants with available dietary assessments.
Results
The mean (standard deviation [SD]) age among 333 individuals diagnosed with OPC was 64.6 (7.5) years. Most participants were male [306 (91.9%)] and White [275 (82.6%)], and 121 (36.3%) were Veterans treated at the MEDVAMC. Approximately half (167; 50.1%) reported never having smoked. Among participants with available data, 15 of 217 (6.9%) reported food insecurity, and 53 of 218 (24.3%) reported inadequate access to healthy foods. Most participants had HPV-positive tumors [283 (85.0%)], with tonsil 147 (44.1%) and base of tongue (143 (42.9%) as the most common tumor subsites. Among participants assessed during post-treatment and long-term survivorship, 125 of 201 (62.2%) received radiation and chemotherapy, whereas 10 of 201 (5.0%) were treated with surgery alone (Table 1). Overall, 14 participants (4.2%) were lost to follow-up or withdrew from the study.
Diet quality across critical periods of OPC survivorship
Poor diet quality was highly prevalent across all three survivorship groups, with no participants classified as within the adequate range of the HEI-2020 (Figure 1). At diagnosis, 76 of 132 participants (57.6%) had critically low diet quality (HEI-2020 ≤50) and 54 (40.9%) had very low diet quality (HEI-2020 51–70); together, 98.5% had an HEI-2020 score ≤70. Post-treatment, 17 of 36 participants (47.2%) had critically low diet quality, and 18 (50.0%) had very low diet quality; together, 97.2% had an HEI-2020 score ≤70. Among long-term survivors, 96 of 165 participants (58.2%) had critically low diet quality, and 62 (37.6%) had very low diet quality; together, 95.8% had an HEI-2020 score ≤70. The remaining participants in each survivorship group were classified as having moderately low diet quality.
Suboptimal diet quality by demographic and clinical characteristics
Unadjusted analyses showed consistently high proportions of very low and critically low diet quality across demographic and clinical subgroups. Overall, the proportion of individuals with critically low diet quality was slightly higher among non-White than White participants [35/58 (60.3%) vs 154/275 (56.0%)], among females than with males [18/27 (66.7%) vs 171/306 (55.9%)] and among participants with HPV-positive tumors than with HPV-negative tumors [163/283 (57.6%) vs 16/29 (55.2%)] (Figure 2). In analyses restricted to participants assessed during post-treatment and long-term survivorship, the proportion with critically low diet quality varied by treatment modality and was highest among those treated with surgery alone [8/10 (80.0%)], followed by radiation and chemotherapy [72/125 (57.6%)], radiation only [17/33 (51.5%)], and surgery plus radiation with or without chemotherapy [15/30 (50.0%)] (Figure 3).
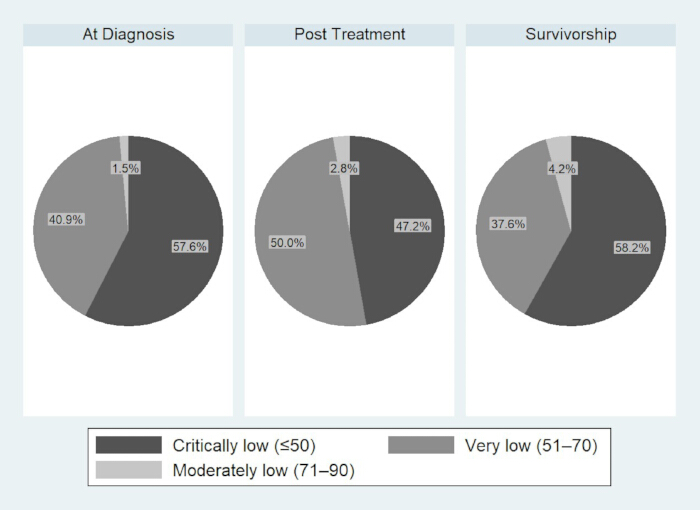
Figure 1: Suboptimal diet quality among 333 individuals diagnosed with oropharyngeal cancer by survivorship period in the U-DINE Study. Participants were assessed at diagnosis (n = 132), post-treatment (n = 36), or during long-term survivorship (n = 165). Diet quality was categorized using the Healthy Eating Index-2020 (HEI-2020; range, 0–100), with higher scores indicating greater adherence to the Dietary Guidelines for Americans: critically low (≤50), very low (51–70), moderately low (71–90), and adequate (91–100). At diagnosis: n = 132; post-treatment = 36; survivorship: n = 165. Please click here to view a larger version of this figure.
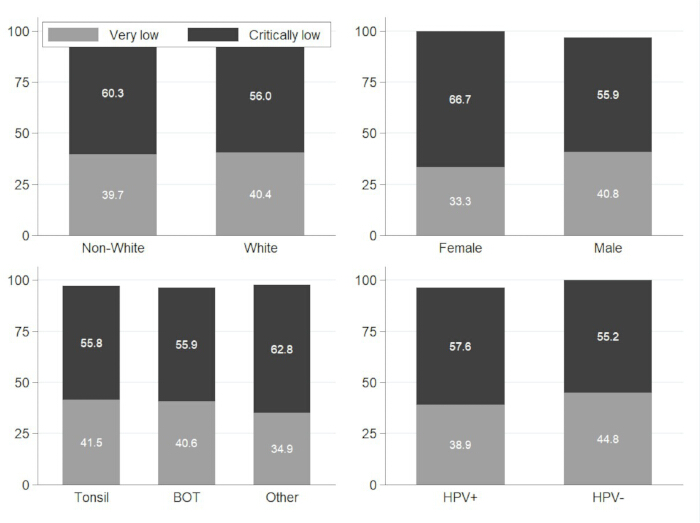
Figure 2: Proportions of participants diagnosed with oropharyngeal cancer with very low and critically low diet quality, by race, sex, HPV tumor status, and tumor subsite (n = 333). Very low diet quality was defined as an HEI-2020 score of 51–70, and critically low diet quality as an HEI-2020 score ≤50. Abbreviations: BOT, base of tongue; HEI-2020, Healthy Eating Index-2020; HPV, human papillomavirus. Please click here to view a larger version of this figure.
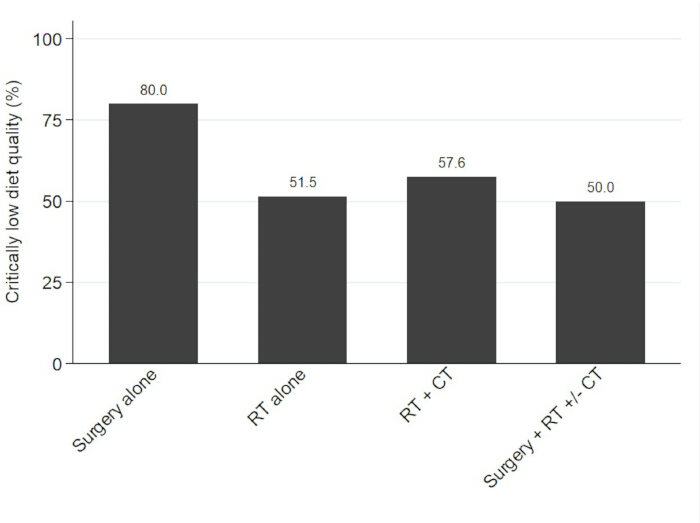
Figure 3: Proportion of participants assessed during post-treatment and long-term survivorship with critically low diet quality, by treatment modality (n = 201). Critically low diet quality was defined as an HEI-2020 score ≤50. Treatment categories were surgery alone, radiation therapy (RT) only, RT plus chemotherapy (CT), and surgery plus RT with or without CT (surgery + RT ± CT). Abbreviations: CT, chemotherapy; HEI-2020, Healthy Eating Index-2020; RT, radiation therapy. Please click here to view a larger version of this figure.
| Sociodemographic factors | |
| Age, mean (SD) years | 64.6 (7.5) |
| Sex | |
| Male | 306 (91.9) |
| Female | 27 (8.1) |
| Race | |
| White | 275 (82.6) |
| Non-white | 58 (17.4) |
| Study site | |
| MDACC | 212 (63.7) |
| MEDVAMC | 121 (36.3) |
| Recruitment Period | |
| At diagnosis | 132 (39.6) |
| Post-Treatment | 36 (10.8) |
| Long-term Survivorship | 165 (49.6) |
| Smoking status1 | |
| Current/former smoker | 165 (49.6) |
| Never smoker | 167 (50.1) |
| Missing | 1 (0.3) |
| Food-insecure1 | 15 (6.9) |
| Nutrition-insecure1 | 53 (24.3) |
| Clinical factors | |
| Tumor subsite | |
| Tonsil | 147 (44.1) |
| Base of tongue | 143 (42.9) |
| Other | 43 (12.9) |
| HPV-status | |
| Positive | 283 (85.0) |
| Negative | 29 (8.7) |
| Unknown | 21 (6.3) |
| Treatment Received2 | |
| Surgery alone | 10 (5.0) |
| RT alone | 33 (16.4) |
| RT + CT | 125 (62.2) |
| Surgery + RT ± CT | 30 (14.9) |
| Other | 3 (1.5) |
| Tube feeding at the time of dietary interview | |
| No | 301 (90.4) |
| Yes | 28 (8.4) |
| Unknown/missing | 4 (1.2) |
Table 1: Sociodemographic and clinical characteristics of the initial U-DINE study cohort (n = 333). Values are presented as N (%) unless otherwise specified. Food and nutrition insecurity status were assessed in a subgroup of participants with available data; percentages were calculated using participants with non-missing information as the denominator (n = 217 for food insecurity and n = 218 for nutrition insecurity). Treatment modality percentages were calculated using the 201 participants recruited during post-treatment or long-term survivorship periods as the denominator. Abbreviations: U-DINE = uncovering the long-term impact of oropharyngeal cancer and dysphagia on dietary quality and nutrition among cancer survivors, MDACC = The University of Texas MD Anderson Cancer Center; MEDVAMC = Michael E. DeBakey Veterans Affairs Medical Center; HPV = human papillomavirus; SD = standard deviation.
Supplementary Table 1: Healthy eating barriers. Barriers to healthy eating were assessed among participants with oropharyngeal cancer, organized across domains of cost and access, time and resources, knowledge and skills, and cultural preferences and cancer-related comorbidities. Please click here to download this file.
Supplementary Table 2: Healthy eating index-2020. Healthy eating index-2020 (HEI-2020) components and scoring criteria, including the dietary intake thresholds corresponding to the highest and lowest scores for each component. Please click here to download this file.
Supplementary Table 3: Food groups and nutrient variables. Nutrition data system for research (NDSR) food groups and nutrient variables used to derive each component of the HEI-2020. Please click here to download this file.
Discussion
In the initial U-DINE Study cohort of 333 participants assessed at different stages of the OPC cancer care continuum, poor diet quality was pervasive. Nearly all participants had very low or critically low diet quality at diagnosis, during the post-treatment period, and in long-term survivorship, and none met the study-defined adequate HEI-2020 range. This burden was observed across demographic and clinical subgroups, although the prevalence of critically low diet quality varied modestly by race, sex, and HPV status and more substantially by treatment modality. Collectively, these findings indicate that the substantial burden of suboptimal diet quality at the time of diagnosis and treatment persists into long-term survivorship, highlighting opportunities to address diet quality throughout the cancer care continuum.
The high study retention observed in U-DINE supports the feasibility of systematically assessing diet quality and nutritional vulnerability at clinically relevant points across the OPC care continuum. U-DINE extends previous studies by combining detailed dietary assessment with information on tube-feeding use, dietary supplements, food and nutrition insecurity, barriers to healthy eating, and malnutrition risk, all obtained using brief, validated screening tools. This integrated approach provides a more comprehensive characterization of dietary intake and its potential determinants and may help identify specific nutritional vulnerabilities and modifiable barriers that can be targeted by the cancer care team.
Successful implementation required close coordination with clinical site collaborators to ensure timely identification of newly diagnosed patients and scheduling of dietary assessments prior to treatment initiation. Minimizing participant burden during a highly stressful period was also critical and was supported through flexible scheduling, short, validated assessment tools, and trained dietitians to efficiently conduct dietary assessments. Collectively, this work highlights poor diet quality as an underrecognized yet potentially modifiable determinant of survivorship health and provides a foundation for developing patient care.
A key limitation is the use of two nonconsecutive weekday 24-hour recalls rather than repeated assessments spanning both weekdays and weekends. However, 24-hour recalls allow comprehensive capture of all foods and beverages consumed and may be particularly valuable in this cancer population, for which commonly used dietary questionnaires have not been specifically validated and may not adequately represent the foods typically consumed following an OPC diagnosis and treatment. Restricting data collection to weekdays may nevertheless fail to capture day-to-day variation and systematic differences in intake between weekdays and weekends27,28. As previously mentioned, this approach was selected to balance comprehensive dietary assessment with the burden on participants and the clinical care team, while supporting participation and the completeness of data collection. Future analyses incorporating weekend assessments could quantify the magnitude and direction of potential bias associated with weekday-only data collection and inform an efficient dietary assessment approach to identify dietary inadequacies and characterize diet quality in this population.
In conclusion, initial findings from U-DINE highlight poor diet quality as an under-recognized yet modifiable determinant of survivorship health. Unlike conventional oncology nutrition care, which largely focuses on identifying and treating established malnutrition, the U-DINE protocol enables early identification of suboptimal diet quality and barriers to healthy eating that may precede severe nutritional complications and represent actionable targets for intervention29. The detailed dietary assessments also provide a foundation for evaluating established and hypothesized dietary risk factors in relation to treatment outcomes, quality of life, chronic disease risk following cancer treatment, and mortality. Future phases of U-DINE will leverage its longitudinal design to address these questions across the cancer care continuum and inform systematic dietary risk screening and the development of patient-centered interventions. It is hoped that identifying dietary patterns, protective factors, and modifiable barriers will hold promise for improved recovery, functional well-being, and longevity beyond cancer treatment, with increasing relevance as the cancer survivor population continues to grow.
Disclosures
The views expressed in this article are those of the authors and do not necessarily reflect the position or policy of the Department of Veterans Affairs or the United States Government. VCS reports on consulting and equity ownership in Femtovox Inc. The remaining authors had no conflicts of interest to disclose. During the preparation of this manuscript, the authors used ChatGPT to assist with language editing and text refinement. All content was reviewed and critically evaluated by the authors. The authors take full responsibility for the content and accuracy of the published article.
Acknowledgements
This work was funded by the Department of Defense Peer Reviewed Cancer Research Program (PRCRP) Behavioral Health Science Award (W81XWH-21-1-0243) and supported in part by the cohort infrastructure from The Charles and Daneen Stiefel Oropharyngeal Cancer Fund and OPC-SURVIVOR Research Program 5P01CA285249-02. The authors sincerely thank the patients and research personnel who participated in this study. We are grateful for their time, effort, and contributions, which were essential to the completion of this research.
Materials
| Name | Company | Catalog Number | Comments |
|---|---|---|---|
| Nutrition Data System for Research (NDSR) software and training | Nutrition Coordinating Center, University of Minnesota. Nutrition Data System for Research (NDSR) 2021 User Manual. Minneapolis, MN: University of Minnesota; 2021 | URL: https://www.ncc.umn.edu/products/ndsr-user-manual/ | |
| Healthy Eating Index (HEI) scoring using NDSR data | Miller PE, Mitchell DC, Harala PL, Pettit JM, Smiciklas-Wright H, Hartman TJ. Development and evaluation of a method for calculating the Healthy Eating Index-2005 using the Nutrition Data System for Research. Public Health Nutr. 2011;14(2):306–313. | DOI: 10.1017/S1368980010001655 | |
| Hunger Vital Sign™ 2-item food insecurity screener | Hager ER, Quigg AM, Black MM, et al. Development and validity of a 2-item screen to identify families at risk for food insecurity. Pediatrics. 2010;126(1):e26–e32. | DOI: 10.1542/peds.2009-3146 | |
| Nutrition Security Screener (NSS) | Craig HC, Sharib JR, Ridberg R, et al. Development and validation of a brief Nutrition Security Screener (NSS) for clinical and public health settings. Am J Clin Nutr. 2025;122(6):1689–1700. The published paper describes the NSS and its barrier items. | DOI: 10.1016/j.ajcnut.2025.08.017 | |
| Performance Status Scale for Head and Neck Cancer Patients (PSS-HN) | List MA, Ritter-Sterr C, Lansky SB. A performance status scale for head and neck cancer patients. Cancer. 1990;66(3):564–569. | DOI: 10.1002/1097-0142(19900801)66:3<564 |
References
- Rehm CD, Penalvo JL, Afshin A, Mozaffarian D. Dietary intake among US adults, 1999-2012. JAMA. 2016;315(23):2542-2553.
- Greten FR, Grivennikov SI. Inflammation and cancer: triggers, mechanisms, and consequences. Immunity. 2019;51(1):27-41.
- Talwar B, Donnelly R, Skelly R, Donaldson M. Nutritional management in head and neck cancer: United Kingdom National Multidisciplinary Guidelines. J Laryngol Otol. 2016;130(S2):S32-S40.
- Kamal M, et al. Modeling symptom drivers of oral intake in long-term head and neck cancer survivors. Support Care Cancer. 2019;27(4):1405-1415.
- Global Burden of Disease Study 2013 Collaborators. Global, regional, and national incidence, prevalence, and years lived with disability for 301 acute and chronic diseases and injuries in 188 countries, 1990-2013: a systematic analysis for the Global Burden of Disease Study 2013. Lancet. 2015;386(9995):743-800.
- Cheng E, et al. Long-term survival and causes of death after diagnoses of common cancers in 3 cohorts of US health professionals. JNCI Cancer Spectr. 2022;6(2):pkac021.
- Zaorsky NG, et al. Causes of death among cancer patients. Ann Oncol. 2017;28(2):400-407.
- Chaturvedi AK, et al. Human papillomavirus and rising oropharyngeal cancer incidence in the United States. J Clin Oncol. 2011;29(32):4294-4301.
- Zhang Y, Fakhry C, D'Souza G. Projected association of human papillomavirus vaccination with oropharynx cancer incidence in the US, 2020-2045. JAMA Oncol. 2021;7(10):e212907.
- Chen AY, et al. The development and validation of a dysphagia-specific quality-of-life questionnaire for patients with head and neck cancer: the M. D. Anderson Dysphagia Inventory. Arch Otolaryngol Head Neck Surg. 2001;127(7):870-876.
- Rosenthal DI, et al. Measuring head and neck cancer symptom burden: the development and validation of the M. D. Anderson Symptom Inventory, Head and Neck Module. Head Neck. 2007;29(10):923-931.
- Rosenthal DI, et al. Patterns of symptom burden during radiotherapy or concurrent chemoradiotherapy for head and neck cancer: a prospective analysis using the University of Texas MD Anderson Cancer Center Symptom Inventory-Head and Neck Module. Cancer. 2014;120(13):1975-1984.
- Cleeland CS, et al. Assessing symptom distress in cancer patients: the M.D. Anderson Symptom Inventory. Cancer. 2000;89(7):1634-1646.
- Hutcheson KA, et al. Dynamic Imaging Grade of Swallowing Toxicity (DIGEST): scale development and validation. Cancer. 2017;123(1):62-70.
- Hunter KU, et al. Aspiration pneumonia after chemo-intensity-modulated radiation therapy of oropharyngeal carcinoma and its clinical and dysphagia-related predictors. Head Neck. 2014;36(1):120-125.
- de Oliveira Otto M, et al. Quantifying suboptimal diet quality among oropharyngeal cancer survivors in two cohorts: interim findings from the U-DINE Study. In: 11th International Conference on Head and Neck Cancer; 2023; Montreal, Canada. American Head and Neck Society.
- Manduchi B, et al. Examining the relationship between dysphagia, eating-related symptoms, and diet quality among oropharyngeal cancer patients during critical stages of cancer survivorship: the U-DINE Study. Head Neck. 2025;47(10):2816-2826.
- Harnack L. Nutrition Data System for Research (NDSR). In: Gellman MD, Turner JR, editors. Encyclopedia of Behavioral Medicine. New York: Springer; 2013. p. 1348-1350.
- Nutrition Coordinating Center. Nutrition Data System for Research (NDSR) 2021 User Manual. Minneapolis (MN): University of Minnesota; 2021.
- Hager ER, et al. Development and validity of a 2-item screen to identify families at risk for food insecurity. Pediatrics. 2010;126(1):e26-e32.
- Craig HC, et al. Development and validation of a brief Nutrition Security Screener (NSS) for clinical and public health settings. Am J Clin Nutr. 2025;122(6):1689-1700.
- List MA, Ritter-Sterr C, Lansky SB. A performance status scale for head and neck cancer patients. Cancer. 1990;66(3):564-569.
- Shams-White MM, et al. Healthy Eating Index-2020: review and update process to reflect the Dietary Guidelines for Americans, 2020-2025. J Acad Nutr Diet. 2023;123(9):1280-1288.
- Miller PE, et al. Development and evaluation of a method for calculating the Healthy Eating Index-2005 using the Nutrition Data System for Research. Public Health Nutr. 2011;14(2):306-313.
- Nutrition Coordinating Center. Guide for Calculating HEI-2015 Total and Component Scores Using SAS Code. Minneapolis (MN): University of Minnesota; 2019.
- National Cancer Institute. Steps for Calculating Healthy Eating Index Scores [Internet]. Bethesda (MD): National Cancer Institute. https://epi.grants.cancer.gov/hei/calculating-hei-scores.html
- Willett W. Nature of variation in diet. In: Willett W, editor. Nutritional Epidemiology. 2nd ed. New York: Oxford University Press, 1998. p. 33-49.
- Buzzard M. 24-hour dietary recall and food record methods. In: Willett W, editor. Nutritional Epidemiology. 2nd ed. New York: Oxford University Press, 1998. p. 50-73.
- de Oliveira Otto MC, et al. Disproportionate burden of poor diet quality among individuals diagnosed with oropharyngeal cancer during critical periods of cancer care: The U-DINE study. Nutrition. 2025;137:112820.