This article demonstrates a controlled experimental method for investigating hydrogen explosion dynamics in unconfined environments with obstacles. Using synchronized high-speed imaging and pressure measurements, the protocol captures flame acceleration, turbulence generation, and pressure buildup resulting from the delayed ignition of under‑expanded hydrogen jets.
Method Article
High-Speed Visualization and Pressure Measurement of Hydrogen Explosion Dynamics in Obstructed and Unconfined Geometries
In This Article
Summary
Abstract
This article presents a detailed experimental method for studying hydrogen explosion behavior under varying obstacle layouts and confinement conditions. The procedure involves controlled release of a hydrogen jet, delayed ignition, and systematic adjustment of obstacle geometry and confinement distances to replicate realistic industrial scenarios. High-speed cameras capture flame propagation and jet-fire transition, while pressure transducers record explosion severity and pressure buildup. The method highlights key parameters, such as nozzle diameter, upstream pressure, obstacle spacing, and confinement, that govern turbulence generation and flame acceleration. Representative results validate the approach and illustrate how geometric configurations influence explosion intensity. This reproducible workflow is designed to support both research and education by providing clear, step-by-step documentation of the experimental process. Beyond its immediate application in experimental hydrogen safety studies, the protocol provides valuable data for validating computational fluid dynamics (CFD) models and developing engineering guidelines for risk mitigation. By integrating visualized methods with structured data collection, this protocol supports reproducible experimentation and can aid future studies aimed at improving hydrogen system safety in industrial and maritime environments.
Introduction
Hydrogen has emerged as a promising energy carrier due to its high energy density and environmental benefits. However, its storage and use in high-pressure systems present significant safety challenges, particularly in industrial and maritime environments where unintentional leaks can lead to hazardous situations. When hydrogen leaks from high-pressure systems, it escapes as a high-velocity, under-expanded jet that rapidly entrains surrounding air, forming a flammable hydrogen-air mixture1,2. The jet's momentum and mixing behavior strongly influence the resulting flame and explosion dynamics.
Because hydrogen can escape as a high‑momentum jet, mix rapidly with air, and produce an explosive cloud, robust safety measures are required3. In confined or obstructed settings, the geometry and spacing of obstacles significantly influence the development of turbulence, flame propagation, and explosion severity4,5. Although unconfined hydrogen release configurations are widely recommended because they reduce the risk of pressure buildup and severe explosions. Complete openness is often not achievable in industrial or maritime settings. However, in industrial or maritime environments, physical confinement is often unavoidable, leading to increased risks of flow entrainment and turbulence development. Such conditions have a direct impact on jet behavior, mixing phenomena, and, ultimately, flame propagation5. Understanding these parameters is essential for designing safer hydrogen systems and establishing effective safety distances6,7. Despite advancements in computational fluid dynamics (CFD) simulations, experimental data remain indispensable for validating these models and developing reliable engineering guidelines8,9.
Compared with other diagnostic approaches used in hydrogen jet‑ignition studies, such as schlieren imaging, planar laser‑induced fluorescence (PLIF), or single‑point pressure measurements, synchronized high‑speed imaging combined with multi‑location pressure sensing provides a more comprehensive characterization of flame structure, transient jet development, and explosion strength10,11,12. Techniques such as schlieren or PLIF usually capture only density gradients or species concentration fields and may not resolve rapid transitions in flame morphology after delayed ignition. Likewise, pressure‑only diagnostics offer limited insight into flame geometry or propagation modes. The combined imaging‑and‑pressure approach used in this study enables detailed tracking of ignition regimes, flame acceleration, and pressure buildup with high temporal resolution, offering clear advantages for validating CFD models and identifying hazardous flame behavior.
This paper presents the methodology and results of experiments investigating the effects of a pipe‑shaped obstacle on flame propagation and explosion dynamics following delayed ignition of high-pressure hydrogen jets in an open atmosphere. An under-expanded jet occurs when the hydrogen exit pressure exceeds the ambient pressure, leading to the formation of a shock structure near the nozzle. This phenomenon significantly affects the mixing characteristics of the jet and the subsequent flame behavior upon ignition. During the experiment, hydrogen was discharged through a 1.69 mm circular orifice at supply pressures ranging from 30 to 80 bar(g). The influence of delayed ignition location and two obstacle standoff distances on jet evolution and flame propagation was examined. Using synchronized high‑speed imaging and pressure measurements, the experiments provide insights into flow regimes, flame behavior, and conditions contributing to explosion severity. The experimental setup is shown in Figures 1 and 2. Pictures of a hydrogen bottle and its valves are included in the Supplementary Figure 1 and Supplementary Figure 2. The experimental data are intended to complement CFD simulations by providing validation points for flame speed, pressure buildup, and turbulent mixing within the jet.
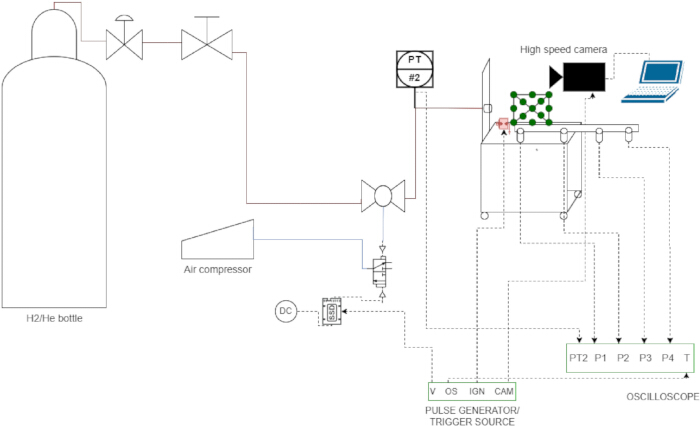
Figure 1: Simplified piping and instrumentation diagram (P&ID) of the experimental setup. The diagram shows the hydrogen supply, PT, pressure sensors (P1–P4), pneumatic valve (V), IGN, CAM, and OS. Abbreviations; PT = pressure transmitters; IGN = ignition unit; CAM = high speed camera; OS = data acquisition/oscilloscope connection; T = trigger signal; DC = direct current; SSD = solid state relay device. Please click here to view a larger version of this figure.
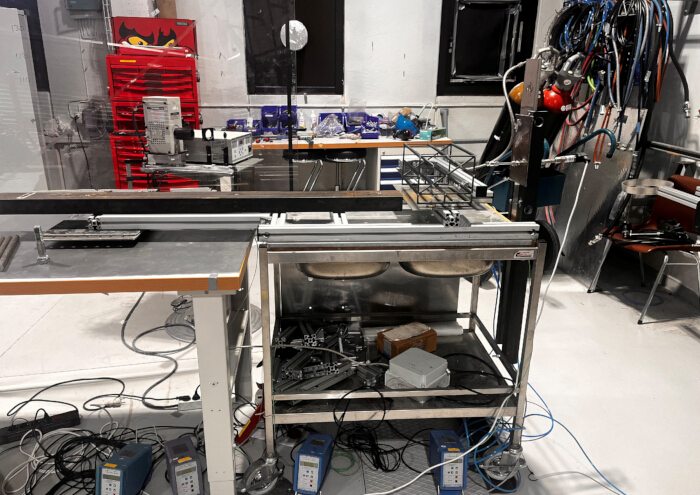
Figure 2: Experimental setup. Photograph of the laboratory configuration, showing the nozzle, obstacle structure, pressure sensors, and camera mounting arrangement used during hydrogen‑jet explosion tests. Please click here to view a larger version of this figure.
The hydrogen supply pressure was measured using a pressure transmitter (0–250 bar(g)) installed upstream of the nozzle. The obstacle geometry (configured as a series of green circles, see attached) was positioned at two distances from the nozzle: 29 cm and 54 cm. The selected distances correspond to different stages of jet evolution, during which the hydrogen concentration changes from 60% to 30% (Figure 3). The ignition source was placed in three distinct locations to assess the effect of ignition position on jet development and flame propagation. The ignition locations were chosen to investigate whether the flame initiated in regions of high hydrogen concentration (near the nozzle) or regions of lower concentration (further downstream).
The concentration field of the hydrogen jet was not measured experimentally. Instead, it was estimated using the notional nozzle model described in another study13 together with the concentration decay contours presented in another study14, as shown in Figure 3. This modeling approach assumes that the jet transitions from an under-expanded state to a fully developed turbulent jet with a Gaussian concentration profile. The notional nozzle model simplifies the complex flow field near the nozzle by representing it as an equivalent ideal jet with known properties. As a result, the actual concentration distribution within the obstacle geometry remained unknown during the tests. Although this modelling approach provides a reasonable estimate of the overall jet behavior, the concentration field was not experimentally validated, and therefore, local mixture composition at the ignition point may differ from the predicted values.
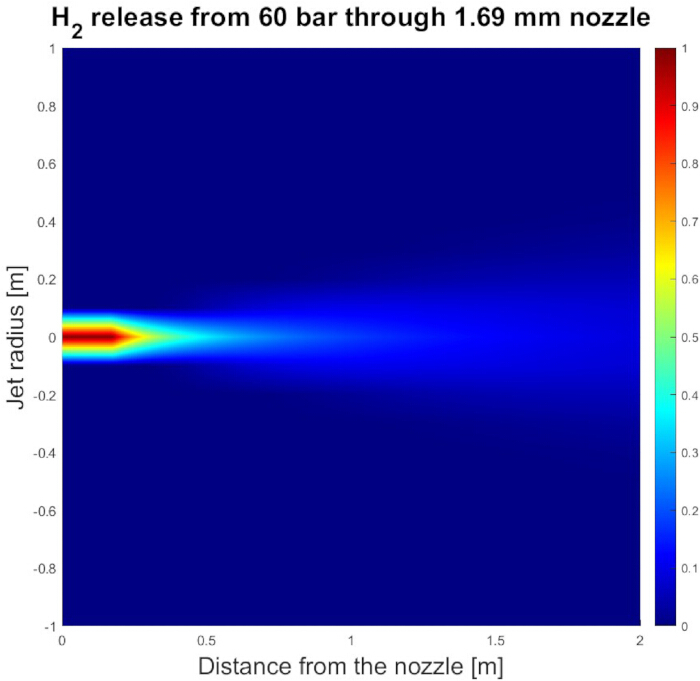
Figure 3: Concentration contour of the hydrogen jet. Simulated hydrogen concentration distribution for a 60‑bar release through a 1.69 mm nozzle, illustrating radial and axial decay of hydrogen mass fraction. Please click here to view a larger version of this figure.
The mass flow rate was determined from the discharge pressure using choked-flow relations at an assumed gas temperature of 293 K, ensuring stable and reproducible release conditions. Ignition occurred 2.5 s after valve opening, and the high‑speed camera was synchronized with the ignition system to capture early flame development and enable accurate post‑processing of flame propagation dynamics.
Protocol
This protocol provides a step‑by‑step description of the experimental procedure used to investigate hydrogen‑jet ignition and explosion dynamics. All materials, equipment, and software used in the procedure are listed in the Table of Materials. Additional procedural templates, including the start‑up and shutdown checklist (Supplementary File 1) and the experimental data‑recording template (Supplementary File 2), are provided to support reproducibility and laboratory implementation. The experiments were conducted under typical laboratory ambient conditions at room temperature (around 22 °C), with standard mechanical ventilation operating at the building’s regulated air‑change rate. Although temperature and ventilation were not actively controlled, future studies may benefit from monitoring these parameters
1. Experimental setup preparation
CAUTION: Secure the experimental area by closing access doors and posting warning signs, and prohibit unauthorized personnel from entering the laboratory. Put on appropriate personal protective equipment (PPE), including a helmet with a face shield and hearing protection, before starting any hydrogen‑related operations. Ground the entire experimental rig to a verified earth connection to reduce the risk of electric shock from the spark ignition system.
- Equipment connections
- Connect the high‑pressure regulator to the hydrogen cylinder, then attach a high‑pressure hose between the outlet of the regulator and the inlet of the experimental setup.
CAUTION: Use piping and fittings rated for at least 100 bar(g) and compatible with hydrogen service. Inspect all connections visually before pressurization. - Connect the pneumatic valve to the air compressor using an air hose, and set the compressor outlet pressure to the value required for full valve actuation according to the valve specifications.
- Connect all electronic devices (data acquisition system, high‑speed camera, pulse generator, and ignition unit) to their respective power supplies, and switch them on.
- Connect the trigger output of the pulse generator to the pneumatic valve control, high‑speed camera trigger input, pressure data acquisition trigger input, and ignition unit trigger input using appropriate signal cables.
- Position the obstacle array at the selected distance (for example, 29 cm or 54 cm) downstream of the nozzle by measuring from the nozzle exit plane, and align the obstacles with the jet centerline.
- Place the ignition source at the desired location relative to the obstacle and the nozzle (for example, near‑nozzle, mid‑jet, or downstream), and fix it securely in position.
- Adjust the distance between ignition electrodes to a spark gap of approximately 1–3 mm using a feeler gauge or ruler.
- Perform a leak test on all hydrogen connections by pressurizing the system with an inert gas (for example, nitrogen) to a pressure slightly above the planned operating pressure and applying a soap‑water solution to each fitting using a brush or spray bottle. Inspect for bubble formation. Tighten or remake any connection where bubbles appear and repeat the test until no leaks are detected.
- Connect the high‑pressure regulator to the hydrogen cylinder, then attach a high‑pressure hose between the outlet of the regulator and the inlet of the experimental setup.
- Calibration and configuration
- Set the data acquisition system to sample all pressure channels at a rate of at least 50 kHz. Configure the time base to cover the entire release and combustion event (e.g., 5 s total duration) and set an appropriate voltage range for each pressure sensor based on its calibration. Configure the system to trigger on a rising‑edge signal from the pulse generator.
- Set the high‑speed camera to a resolution of 1024 × 1024 pixels and 5,000 frames per second (fps). Set the exposure time to a value that avoids motion blur while maintaining sufficient brightness (for example, 100–200 µs) and select a trigger mode that records a short pre‑trigger period (for example, 10–20% of the total recording time).
NOTE: Adjust the resolution, frame rate, and exposure time based on the camera's capabilities and the required level of flame detail. - Program the pulse generator to send a single trigger sequence that simultaneously activates the pneumatic valve, high‑speed camera, pressure data acquisition, and ignition unit. Set the hydrogen release duration to 2.03 s and the ignition delay to 2.00 s relative to the valve opening, with an ignition pulse duration of 0.03 s.
- Configure the camera trigger to start recording at the same time as the ignition trigger, with the selected pre‑trigger period, and configure the data acquisition system to start recording on the same trigger signal.
- Verify the trigger configuration by sending a test trigger while the hydrogen cylinder valve is closed and confirming that the valve opens, the camera records, and the data acquisition system stores a test trace.
2. Experimental execution
- Hydrogen release and ignition
- Open the main valve on the hydrogen cylinder slowly, then adjust the pressure regulator to the desired upstream pressure (for example, 30–80 bar(g)), as specified in the experimental matrix. Wait until the regulator pressure stabilizes within ±0.5 bar for at least 10 s before proceeding.
- Move to the designated safe location behind the protective barrier or outside the hazard zone, maintaining visual contact with the experiment through cameras or observation windows.
- Turn off unnecessary room lighting to improve high‑speed video contrast.
- Activate the visual or audible laboratory safety signal according to local procedures to indicate that hydrogen release is about to begin.
- Start the pulse generator to initiate the synchronized trigger sequence.
- Data collection.
- Save the measured explosion pressure signals from all pressure sensors, as well as the upstream supply pressure trace, using the data acquisition software.
- Save the high‑speed video file showing the ignition behavior and flame propagation through the obstacle geometry. Confirm that the recording includes the pre‑trigger period and that the ignition moment is visible in the footage.
- Transfer all recorded data to the designated experiment folder and back it up to an external drive.
3. Shutdown and data management
- End of experiment
- Close the hydrogen cylinder needle valve fully by turning it clockwise until resistance is felt.
- Disconnect the ignition unit from its power supply to eliminate the possibility of accidental activation.
- Vent the remaining hydrogen from the piping system by opening the pneumatic valve through a manual trigger signal– check on the pressure regulator valve if the pressure drops to 0.
- Turn off all remaining equipment, including the pulse generator, data acquisition system, high‑speed camera, lighting, and air compressor.
- Post-experiment safety
- Verify the closure of the hydrogen bottle.
- Disconnect all power supplies and cables.
- Secure the experimental area and document any anomalies or observations.
Results
The experimental protocol captures the key dynamics of hydrogen explosions, as demonstrated by the synchronized high‑speed video and pressure measurements (see Figures 4 and 5). In successful experiments, high‑speed videos capture the ignition moment and subsequent flame propagation through the obstacle geometry, as illustrated in the sequential frames of Figure 4.
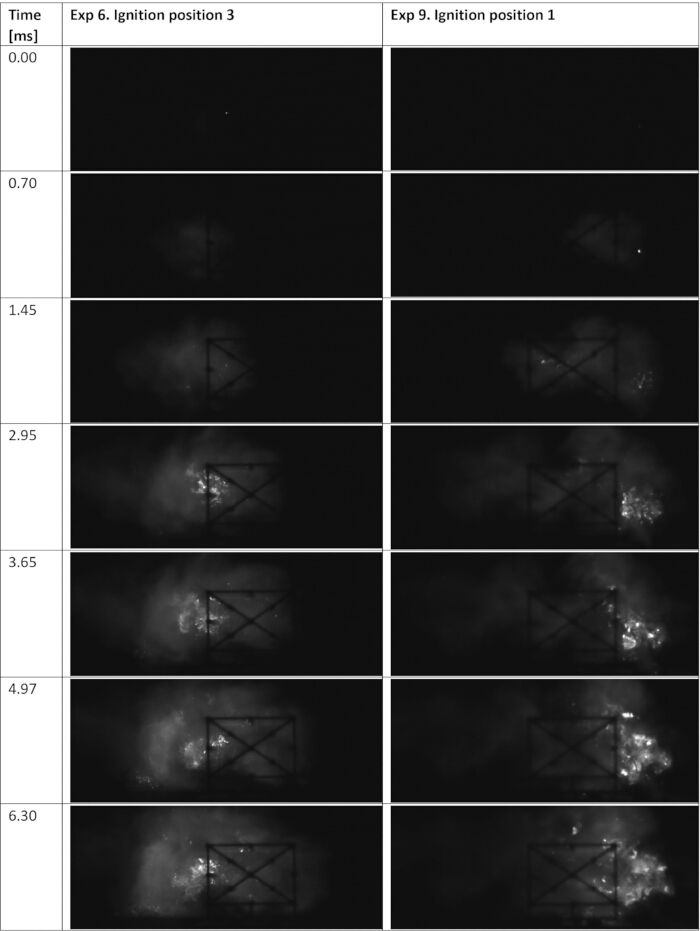
Figure 4: High‑speed images showing the flame front as it propagates through the obstacle region. Sequential frames illustrate ignition, early flame development, and turbulence‑enhanced propagation through the obstacle geometry. Please click here to view a larger version of this figure.
For example, when the obstacle was placed 29 cm from the nozzle, the flame accelerated rapidly due to turbulence generated by the obstacle. The corresponding pressure transducer data showed a sharp peak at the ignition moment, with explosion pressure first observed at sensor P0, reaching and progressively moving downstream at the sensors (see Figure 5). The colored curves correspond to pressure sensors located at increasing distances from the nozzle, and the timing shift between the peaks reflects the flame front propagating past each sensor location.
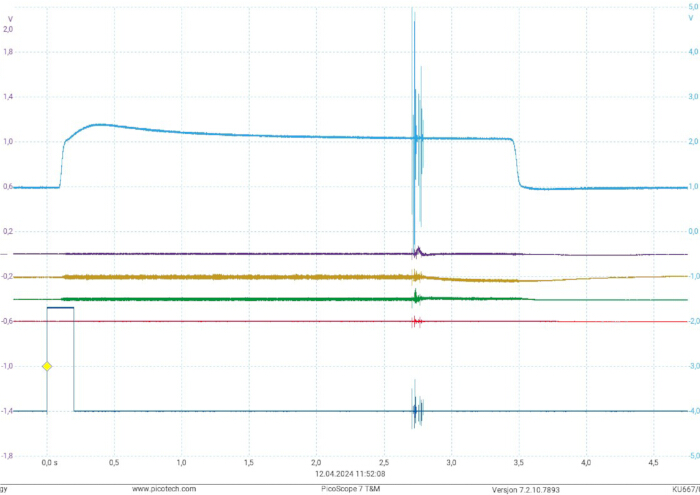
Figure 5: Time‑resolved pressure traces recorded during a representative hydrogen explosion test. Colored curves correspond to pressure sensors at increasing distances from the nozzle, showing the timing sequence of pressure peaks as the flame front passes each sensor. Please click here to view a larger version of this figure.
The parameters investigated in this protocol, such as obstacle distance, ignition location, and mass flow rate, can be adjusted within the ranges tested in this study (Figures 4–5), enabling the method to address different research questions. The investigation may focus on other possible variables, such as obstacle size, shape, and configuration, as well as delay time. For instance, different obstacle layouts or ignition positions may be used to focus on turbulence generation or flame acceleration under specific conditions. As illustrated in Figures 4–5, shifting the ignition position results in measurable changes in flame development and the timing of pressure‑peak arrival at downstream sensors. Within the examined ranges, this adaptability enables the method to be applied to multiple release and ignition scenarios relevant to industrial and educational settings, reflecting the complexities of real-world applications.
Challenges such as inappropriate camera exposure, electrical noise in pressure measurements, or misaligned ignition electrodes may lead to suboptimal recordings or incomplete data (as occasionally observed during preliminary tests). For instance, poorly configured camera parameters (e.g., low frame rate or incorrect exposure) can result in blurry or underexposed videos, while unsynchronized signals may lead to incomplete data capture. Similarly, ignition failures caused by improper placement of the ignition source or insufficient spark energy can result in no flame initiation or inconsistent pressure readings. These issues can typically be resolved by recalibrating sensors, repositioning the ignition source, and/or/and polishing the wires, or double-checking synchronization settings prior to the experiment.
Successful experiments are characterized by clear video footage, synchronized pressure recordings, and consistent pressure‑peak sequences (as seen in Figures 4–5), whereas issues such as signal noise or minor leaks can reduce data quality. The protocol's flexibility to modify key parameters makes it a versatile tool for studying hydrogen explosion dynamics under various conditions. The experimental data provide potential validation points for computational fluid dynamics (CFD) models of hydrogen jet ignition, particularly in predicting flame acceleration and pressure buildup under varying obstacle and confinement conditions. Additionally, the insights gained from this method can be applied to improve the design of safer hydrogen storage and transport systems, particularly in industrial and maritime environments, and to support student training.
Supplementary Figure 1: Hydrogen supply system. Photograph of the hydrogen cylinder, regulator, and high‑pressure piping used to deliver the controlled hydrogen release.Please click here to download this file.
Supplementary Figure 2: Pneumatic actuation and control system. Photograph showing the pneumatic valve that controls the hydrogen release, operated by a solenoid valve triggered by a voltage signal from the pulse generator. The air supply hose and control‑signal connections are also visible.Please click here to download this file.
Supplementary File 1: Start‑up and shutdown procedure template. A PDF checklist outlining the safety and operational steps used before and after hydrogen‑jet experiments.Please click here to download this file.
Supplementary File 2: Experimental procedure template. A PDF template used during each experiment to document trigger settings, ignition timing, pressure readings, and experiment metadata.Please click here to download this file.
Discussion
The choice of equipment and the design of the setup influence the accuracy and reliability of the recorded flame and pressure data, consistent with best practices reported in hydrogen explosion research. A piezoelectric pressure sensor was selected due to its high sensitivity and fast response time, which are essential for capturing the rapid pressure changes that occur during hydrogen explosions15. Unlike other pressure sensors, such as standard piezoresistive sensors, the Kistler 603B uses piezoelectric technology, making it well-suited for dynamic pressure measurements in experiments involving transient phenomena, such as flame propagation and explosions.
A multi‑channel high‑speed data acquisition system was employed because of its high resolution and the availability of multiple synchronized channels, which allow simultaneous recording of pressure signals and synchronization with high‑speed video. Proper selection of piping and fittings is paramount for handling the high operating pressures in the system. The piping must be rated to withstand the maximum upstream pressure supplied by the pressure regulator and transducers, ensuring structural integrity during hydrogen release. Failure to use appropriately rated components could lead to catastrophic leaks or system failure. The pneumatic valve was chosen for its ability to operate rapidly and pneumatically, which serves two critical purposes: (1) synchronization of all experimental actions, including hydrogen release and data acquisition, and (2) enhanced safety, as the valve can be remotely controlled to minimize the operator's exposure to hazards.
A leak test is essential after assembling the system, as recommended in hydrogen safety guidelines16. This ensures that all connections are airtight, preventing unintended hydrogen release. A simple mixture of water and dish soap, or laboratory-grade soap, can be applied to fittings to detect leaks by forming bubbles. If bubbles are observed, the fittings must be tightened and re-tested until no leaks are detected. For the leak test, the nitrogen bottle must replace the hydrogen one and raise the pressure gradually above the planned operating pressure with hydrogen. Maintaining consistent high‑speed video settings improves comparability between experiments and enhances the visibility of early flame development (Figure 4). Maintaining uniform resolution, frame rate, and exposure settings across all videos ensures comparable footage. This consistency simplifies post-processing and analysis, facilitating accurate interpretation of flame propagation and explosion dynamics.
By standardizing key components and synchronizing the recording systems, the experimental design produces reproducible pressure and imaging data under the conditions tested (Figures 4–5). To address timing accuracy, the synchronization between the high‑speed camera, pressure acquisition system, pneumatic valve, and ignition unit was verified using test triggers prior to each experiment. Although minor timing jitter may occur, the trigger system used here operates on sub‑millisecond timescales, and this level of precision is sufficient for resolving the flame development and pressure rise trends reported in Figures 4–5.
Compared with diagnostics that rely solely on schlieren imaging or planar laser‑induced fluorescence, this protocol emphasizes synchronized high‑speed imaging of the visible flame and simultaneous multi‑point pressure measurements. While schlieren and PLIF techniques can resolve density or concentration fields in greater detail, they typically require more complex optical setups and are less suited for routine safety studies in industrial environments. In contrast, the combined imaging‑and‑pressure approach described here provides a robust and relatively simple framework for identifying ignition regimes, flame acceleration, and explosion severity, and generates data that can be readily used to validate computational fluid dynamics simulations of hydrogen releases.
The protocol can be extended to study the influence of alternative obstacle geometries, such as grids, perforated plates, or more complex pipework, on flame acceleration and explosion loading. Future work may also apply the same measurement approach to partially confined or ventilated enclosures, providing data for risk assessments in industrial and maritime hydrogen applications. In an educational context, the methodology can be adapted as a laboratory exercise to train students in hydrogen safety, experimental design, and the use of high‑speed diagnostics for combustion research. In addition, the data generated in this study—and from any future expansion of the parameter matrix—can be used to support CFD model validation and to examine the sensitivity of explosion behavior to ignition location and local hydrogen–air mixture composition. This highlights the method’s suitability not only for demonstrating specific cases but also for informing safety‑relevant analyses when broader parameter sets are explored.
Common issues encountered with this protocol include ignition failure, incomplete flame visualization, and noisy pressure signals. If ignition does not occur, verify the spark gap (approximately 1–3 mm), check the electrical connections of the ignition unit, and confirm that the ignition electrodes are fully immersed in the flammable portion of the hydrogen–air cloud. If the recorded frame is underexposed or blurred, increase the camera exposure time slightly, adjust the lens aperture, or increase the external lighting while maintaining the desired frame rate. Noisy pressure traces can often be mitigated by improving electrical grounding, shortening sensor cables, or applying appropriate digital filtering during post‑processing. The protocol can be adapted to alternative obstacle layouts or nozzle diameters by recalibrating the pressure sensors and re‑establishing safe operating envelopes for pressure and release durations.
This protocol is limited to open‑atmosphere releases and ignition scenarios and does not represent confined or semi‑confined hydrogen explosions. Using a single nozzle diameter and a specific range of supply pressures limits the direct applicability of the results to other geometries and operating conditions. Furthermore, the hydrogen jet's concentration field is not measured directly; instead, it is estimated using a notional nozzle model, which introduces uncertainty in the local equivalence ratio at the ignition point.
An additional source of uncertainty arises from the fact that the notional nozzle model and the literature‑based concentration contours are derived for free, unobstructed jets. In the present experiments, the ignition point may be located upstream of the obstacle, within the obstacle array, or downstream of it, and the presence of obstacles is expected to distort the local concentration field through enhanced entrainment, turbulence generation, and wake formation. As a result, the estimated concentration contours do not accurately represent the mixture composition at the ignition location once obstacles are introduced.
For this reason, the concentration contour shown in Figure 3 is used only to justify the selection of obstacle distances—by indicating approximate hydrogen‑rich and hydrogen‑lean regions in a free‑jet baseline—and not to quantify the local mixture fraction during the actual tests. The actual concentration distribution near the ignition source remains unknown, and this limitation should be considered when interpreting ignition behavior, flame acceleration, and combustion regime transitions. Direct concentration diagnostics (e.g., PLIF, Raman techniques, or gas sampling) represent an important direction for future work to reduce this uncertainty. Finally, the high‑speed imaging is restricted by the selected frame rate, resolution, and viewing angle, which may prevent detailed visualization of three‑dimensional flame structures. Although repeated trials show consistent behavior, the limited number of repetitions means that the results should be interpreted as methodological demonstrations rather than statistically averaged datasets. A full quantification of uncertainty would require a larger number of repetitions, which lies beyond the scope of this protocol‑focused article.
Disclosures
The authors declare that they have no competing financial interests.
Acknowledgements
This publication was funded by the Norwegian Directorate for Higher Education and Skills under the program UTFORSK through the project HyTack: “Tackling the Challenges in Hydrogen Economy through Education and Research” (project number UTF-2021/10198). The results presented in this work were undertaken as part of the research project Safe Hydrogen Fuel Handling and Use for Efficient Implementation 2 (SH2IFT-2), and the authors would like to acknowledge the financial support of the Research Council of Norway under the ENERGIX programme (Grant No. 327009).
Materials
| Name | Company | Catalog Number | Comments |
|---|---|---|---|
| Pressure transducer | American Sensor Team | AST4000C00250B4I1000 | Range 0–250 bar, 4–20 mA |
| Pneumatic valve | Swagelock | SC00015-3 F04-N-D-11 A | Max operating pressure 8 bar |
| Pressure regulator | Swagelock | KPF1PWF8A8P20020 | max 414 bar |
| Pressure sensors | Kistler | 603B | |
| Pulse generator | Quantum Composers | model 9518 | |
| osciloscope / data logger | Pico Technology | PicoScope 4824A | |
| Camera | Photron | FastCam SA-Z 2100K-M-32GB |
References
- Molkov, V., Saffers, J. B. Hydrogen jet flames. Int J Hydrogen Energy. 38 (19), 8141-8158 (2013).
- Lach, A. . Hydrogen safety in confined spaces. , (2022).
- Cirrone, D., Makarov, D., Friedrich, A., Grune, J., Takeno, K., et al. Blast wave generated by delayed ignition of under expanded hydrogen free jet at ambient and cryogenic temperatures. Hydrogen. 3 (4), 433-449 (2022).
- Henriksen, M., Vaagsaether, K., Lundberg, J., Forseth, S., et al. Numerical study of premixed gas explosion in a 1 m channel partly filled with 18650 cell-like cylinders with experiments. J Loss Prev Process Ind. 77, 104761 (2022).
- Dorofeev, S. B., Kuznetsov, M. S., Alekseev, V. I., Efimenko, A. A., et al. Evaluation of limits for effective flame acceleration in hydrogen mixtures. J Loss Prev Process Ind. 14, 583-589 (2001).
- An, Y., et al. Review of safety regulations, codes, and standards (RCS) for hydrogen distribution and application. Int J Green Energy. 21 (8), 1757-1765 (2023).
- Alfasfos, R., Sillman, J., Soukka, R. Lessons learned and recommendations from analysis of hydrogen incidents and accidents to support risk assessment for the hydrogen economy. Int J Hydrogen Energy. 60, 1203-1214 (2024).
- Middha, P., Hansen, O. R., Storvik, I. E. Validation of CFD model for hydrogen dispersion. J Loss Prev Process Ind. 22 (6), 1034-1038 (2009).
- Hansen, O. R. Hydrogen infrastructure-efficient risk assessment and design optimization approach to ensure safe and practical solutions. Process Saf Environ Prot. 143, 164-176 (2020).
- Asahara, M., Iwatsuki, K., Kang, D., Kambayashi, I., Saburi, T., et al. Characterization of hydrogen jets considering leakage from high-pressure storage tanks using shadowgraphy. Int J Hydrogen Energy. 61, 1456-1472 (2024).
- Johansen, C. T., McRae, C. D., Danehy, P. M., Gallo, E. C. A., Cantu, L. M. L., et al. . OH-PLIF visualization of the UVa supersonic combustion experiment: Configuration A [technical report AIAA-2012-0114]. , (2013).
- Ciccarelli, G., Dorofeev, S. Flame acceleration and transition to detonation in hydrogen systems: An overview. Prog Energy Combust Sci. 34, 499-550 (2008).
- Birch, A. D., Hughes, D. J., Swaffield, F. Velocity decay of high-pressure jets. Combust Sci Technol. 52 (1-3), 161-171 (1987).
- Schefer, R. W., Houf, W. G., Bourne, B., Colton, J. Spatial and radiative properties of an open-flame hydrogen plume. Int J Hydrogen Energy. 31 (10), 1332-1340 (2006).
- Inspection: Best practices for hydrogen systems. H2Tools Available from: https://h2tools.org/bestpractices/maintenance-and-inspection/inspection (2026)
Reprints and Permissions
This article has been published
Video Coming Soon