This study aimed to use an integrative bioinformatic reanalysis of public GEO datasets, combined with single-cell contextualization, to identify candidate shared genes between major depressive disorder and dermatomyositis and to characterize their distribution across immune cell subsets in a dermatomyositis-related single-cell dataset.
A subscription to JoVE is required to view this content. Sign in or start your free trial.
Research Article
Reanalysis of Public Transcriptomes Reveals Shared Immune Signatures Between Major Depressive Disorder And Dermatomyositis With Single-Cell Context
* These authors contributed equally
In This Article
Summary
Abstract
This study aimed to identify candidate shared transcriptomic signals between major depressive disorder and dermatomyositis through an integrative bioinformatic reanalysis of public GEO datasets with single-cell contextualization. The analytical workflow included Weighted Gene Co-expression Network Analysis (WGCNA) for key module identification, Gene Ontology (GO) and Kyoto Encyclopedia of Genes and Genomes (KEGG) enrichment analyses for functional characterization, GeneMANIA- and a network visualization platform-based network analysis for candidate-gene prioritization, and evaluation of 113 machine-learning models combined with SHapley Additive exPlanations (SHAP) for diagnostic feature selection. Gene Set Enrichment Analysis (GSEA), immune infiltration analysis, and single-cell RNA-seq-based contextualization were subsequently performed to further characterize the immune-related cellular context of the identified signals. Integration of dermatomyositis-related GEO datasets identified 570 differentially expressed genes, from which 33 candidate shared genes were obtained via WGCNA. Functional enrichment and network analyses highlighted immune defense, cytotoxicity, and pathways including PPAR, IL-17, and antigen processing, with ELANE, PPBP, and CTSG emerging as highly connected nodes. Machine-learning-based feature prioritization retained 8 candidate model-selected genes, namely KIF4A, OLR1, KIR2DL4, KRT23, KIR3DS1, AZU1, SCG5, and LRRC37E. Immune infiltration analysis associated these shared genes with regulatory T cells (Tregs), resting mast cells, resting dendritic cells, and both classically activated (M1) and alternatively activated (M2) macrophages. Single-cell RNA-seq contextualization further suggested that CD8⁺ T-cell subsets with different candidate-gene score states showed distinct intercellular communication patterns. Among these, the MIF–(CD74+CD44) axis and signals from naive/central memory T cells were notable features requiring further validation. Overall, this study identified candidate shared transcriptomic signals between major depressive disorder and dermatomyositis and highlighted immune-related cellular contexts that warrant further validation in true comorbid cohorts.
Introduction
Dermatomyositis is a chronic systemic autoimmune disease characterized by inflammatory involvement of the skin and skeletal muscle, clinically manifested by symmetrical proximal muscle weakness and distinctive cutaneous lesions, and, in severe cases, multiorgan dysfunction1. Accumulating clinical evidence highlights that patients with dermatomyositis frequently experience psychiatric comorbidities, most notably major depressive disorder2,3,4. The pathogenesis of dermatomyositis-associated major depressive disorder is multifactorial, arising from a complex interplay between psychosocial distress, neuroendocrine dysregulation, and systemic immunoinflammation. Persistent pain, fatigue, and progressive muscular weakness can substantially impair physical function and quality of life. These burdens may lead to social role disruption, chronic psychological stress, and reduced autonomy5. In addition, long-term glucocorticoid exposure may perturb the hypothalamic-pituitary-adrenal (HPA) axis and impair hippocampal plasticity, thereby increasing vulnerability to depression-related manifestations6. Moreover, sustained immune activation and systemic inflammation in dermatomyositis are increasingly recognized as potential contributors to depression-related symptoms7. These peripheral mediators may influence the central nervous system by modulating neurotransmitter metabolism and neuroplasticity, thereby linking systemic autoimmunity with neuropsychiatric manifestations7,8,9,10.
Importantly, this rationale does not imply that either disease is biologically homogeneous. Dermatomyositis comprises clinically and serologically distinct subsets, including anti-MDA5- and anti-TIF1-γ-associated phenotypes with different inflammatory and clinical profiles11,12,13. Major depressive disorder is likewise increasingly recognized as a heterogeneous condition, and current evidence supports the existence of an immune-inflammatory subtype rather than a single universal inflammatory signature14,15. Accordingly, the present study was not designed to assume a one-size-fits-all shared molecular program, but rather to screen for candidate overlapping immune-associated transcriptomic signals detectable at the cohort level across independent public datasets.
Beyond psychosocial stress and treatment exposure, a more biologically testable link between major depressive disorder and dermatomyositis is shared immune-inflammatory dysregulation. Major depressive disorder is a heterogeneous condition and should not be assumed to have a single universal transcriptomic profile. However, converging evidence supports an inflammation-related subtype of major depressive disorder, and peripheral transcriptomic studies have identified dysregulation of innate immune, neutrophil-related, interferon, and complement pathways in subsets of affected individuals14,16,17. In parallel, MAPK-related stress signaling has also been implicated in depressive phenotypes18. Dermatomyositis, by contrast, is a well-recognized interferon-driven autoimmune disease, and transcriptomic studies in blood and affected tissues have consistently demonstrated activation of type I interferon and broader immune-inflammatory programs; recent multi-omic analyses have further highlighted ERK- and p38 MAPK-related pathway activity in dermatomyositis19,20,21. Collectively, these findings provide a biologically plausible rationale to examine whether a subset of immune-associated transcriptomic signals may overlap between major depressive disorder and dermatomyositis across independent public datasets.
Despite these observations, the molecular basis underlying the overlap between major depressive disorder and dermatomyositis remains insufficiently understood. Importantly, currently available public datasets do not provide a true cohort of patients simultaneously diagnosed with major depressive disorder and dermatomyositis. Therefore, rather than directly analyzing depression in patients with dermatomyositis, the present study was designed to identify candidate shared transcriptomic signals across separate public datasets of major depressive disorder and dermatomyositis through an integrative bioinformatic reanalysis framework22. Specifically, publicly available transcriptomic datasets were analyzed using differential expression analysis, weighted gene co-expression network analysis (WGCNA), functional enrichment analysis, network-based analysis, and machine-learning-based feature prioritization to identify cross-disease candidate genes and pathways23. In addition, a dermatomyositis-related single-cell dataset was analyzed to contextualize these candidate genes at the immune-cell level. As illustrated in Figure 1, the overall analytical workflow is summarized in a stepwise flowchart. Rather than establishing a definitive comorbidity mechanism, this study aimed to generate a hypothesis-guided framework for identifying candidate shared molecular signals between major depressive disorder and dermatomyositis.
Accordingly, this study adopted a stepwise prioritization framework. Disease-associated co-expression modules were first identified separately in major depressive disorder and dermatomyositis datasets, and their overlap was used to define candidate cross-disease shared signals. These candidates were then functionally contextualized by enrichment and GeneMANIA-based network analysis, prioritized within a dermatomyositis-centered classification framework using machine-learning methods, and finally examined in a dermatomyositis-related single-cell dataset to provide cellular contextualization.
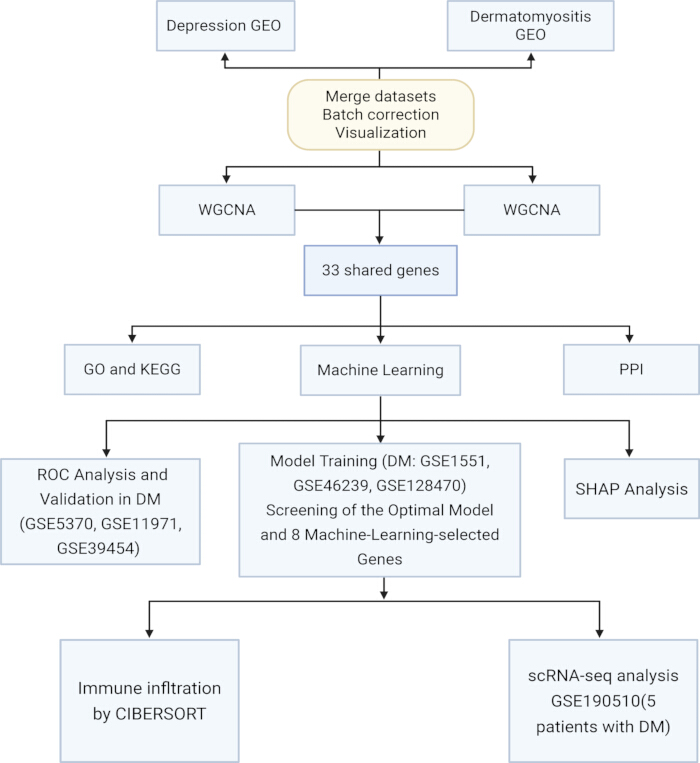
Figure 1: Flowchart of the data collection and analysis process. Please click here to view a larger version of this figure.
Several alternative approaches have been used to investigate cross-disease molecular overlap. Simple intersection of differentially expressed gene (DEG) lists is computationally straightforward but lacks the module-level contextual information provided by co-expression analysis and is sensitive to arbitrary fold-change and P-value thresholds. Traditional meta-analysis pools effect sizes across studies of the same disease but is not designed to identify shared signals across two distinct conditions. The present workflow integrates multiple complementary analytical layers—co-expression module overlap, functional enrichment, network analysis, machine-learning-based feature prioritization, immune deconvolution, and single-cell contextualization—each serving a distinct purpose within a sequential prioritization framework. This multi-layered design helps reduce the number of candidate genes stepwise and provides cross-validated biological contextualization at multiple levels. The protocol is applicable to any pair of diseases for which publicly available bulk transcriptomic and, optionally, single-cell datasets exist, particularly when true comorbid cohorts are unavailable. However, the workflow is observational and does not incorporate formal causal-inference frameworks; all findings should be interpreted as hypothesis-generating and require independent experimental validation.
Overall, the analytical workflow was designed as a sequential prioritization strategy rather than a direct causal-inference framework. Each step served a distinct purpose: WGCNA-based module overlap for candidate shared-signal identification, enrichment/network analysis for biological contextualization, machine learning for feature prioritization in dermatomyositis-related classification, and single-cell analysis for cell-type-level contextualization.
Access restricted. Please log in or start a trial to view this content.
Protocol
This study used only publicly available, deidentified datasets from the Gene Expression Omnibus (GEO) database. Because the work involved secondary analysis of existing public data and did not include direct participant contact, intervention, or access to identifiable personal information, additional ethics committee approval and informed consent were not required.
Data sources and preprocessing
All gene expression and single‑cell dataset were obtained from the GEO database24. For major depressive disorder, dataset GSE98793 was used, which comprises peripheral blood samples from 128 patients and 64 healthy controls. For dermatomyositis, datasets were selected based on predefined criteria, including Homo sapiens expression profiling, clearly identifiable disease and control groups, available platform annotation for probe-to-gene mapping, and suitability for discovery or validation analysis. When a GEO series contained multiple inflammatory myopathy subtypes, only dermatomyositis and normal control samples were extracted for the present study. GSE1551, GSE46239, and GSE128470 were used as the discovery/training datasets, whereas GSE5370, GSE39454, and GSE11971 were used as independent validation datasets. The dermatomyositis datasets analyzed in this study were derived mainly from affected muscle or skin tissues rather than peripheral blood. Single‑cell data for dermatomyositis were sourced from dataset GSE190510.
Raw expression matrices were downloaded from the GEO database together with the corresponding platform annotation files. Probe IDs were mapped to official gene symbols according to the manufacturer-provided GPL annotation. Probes that could not be mapped unambiguously to a single official gene symbol were removed. When multiple probes mapped to the same gene, they were collapsed at the gene level using the average expression value implemented by the `avereps` function in the limma package, thereby generating a gene-by-sample expression matrix.
To reduce intensity-dependent bias and stabilize variance, log2 transformation was applied when appropriate according to the distribution of expression values. Between-array normalization was then performed using the `normalizeBetweenArrays` function in the limma package. Missing values, when present, were imputed using K-nearest neighbor imputation. For the integrated dermatomyositis training datasets, batch correction was performed using the `ComBat` function in the sva package, with dataset/platform origin treated as the batch variable and sample group (dermatomyositis versus healthy control) included in the design matrix to preserve the biological variation of interest during batch adjustment.
All analyses were performed in R using an Integrated development environment for R on a desktop operating system. The limma package was used for probe summarization and normalization. The sva package was used for ComBat batch correction. Missing values were imputed using K-nearest neighbor imputation with k = 10.
Weighted gene co-expression network analysis
Weighted Gene Co-expression Network Analysis (WGCNA) was performed separately for the major depressive disorder and dermatomyositis datasets using the WGCNA R package25,26. Samples were hierarchically clustered using flashClust to identify outliers; samples exceeding a dendrogram height of 100 and genes in the bottom 25% of variance were excluded. For each network, a soft-thresholding power (β) was selected using pickSoftThreshold to achieve approximate scale-free topology (R2 > 0.8). The adjacency matrix was transformed into a Topological Overlap Matrix (TOM), and modules were identified via dynamic tree cutting with a minimum module size of 60 and a merge cut height of 0.2527. The WGCNA R package was used together with flashClust for hierarchical clustering. The random seed was set to 12345 for reproducibility. Module eigengenes were correlated with disease status using Pearson correlation, with P-values adjusted by the Benjamini–Hochberg method. For each disease, the module showing the strongest and most significant association with disease status was retained as the key disease-associated module. The overlap between the key module genes from the major depressive disorder dataset and those from the dermatomyositis dataset was defined as the candidate shared gene set for downstream analyses. Differential expression analysis of the integrated dermatomyositis cohort was performed separately to characterize dermatomyositis-related transcriptional changes.
Functional enrichment analysis
Gene Ontology (GO) enrichment analysis was performed using R. Gene symbols were converted to Entrez IDs using org.Hs.eg.db, and significantly enriched GO terms (p < 0.05) were identified using enrichGO in clusterProfiler. For multi‑dimensional visualization of the results, bar plots and bubble plots were generated using the enrichplot package, while a circular plot was constructed with the circlize package to display GO categories, gene counts, and enrichment factors. Legends were added with the ComplexHeatmap package. Kyoto Encyclopedia of Genes and Genomes (KEGG) pathway enrichment analysis of differentially expressed genes was also conducted in R. Gene symbols were converted to Entrez IDs based on the org.Hs.eg.db database, and significantly enriched pathways (FDR < 0.05) were identified using the enrichKEGG function from the clusterProfiler package28,29,30,31. Enrichment results were visualized using bar and bubble plots.
GeneMANIA-based functional association network analysis
Based on the previously identified shared genes, a GeneMANIA-based functional association network was constructed to explore the interaction context among these genes and their related partners. The gene list was submitted to GeneMANIA using Homo sapiens as the reference species. GeneMANIA integrates multiple evidence types, including co-expression, physical interactions, pathways, co-localization, genetic interactions, and shared protein domains. The resulting network was exported and imported into a network visualization platform for visualization and analysis. Topological analysis of the network was then performed in a network visualization platform for visualization and analysis to identify highly connected candidate nodes32,33,34.
Machine learning-based diagnostic model construction
Multiple machine-learning algorithms were used for diagnostic classification, including Random Forest (RF), Support Vector Machine (SVM), Linear Discriminant Analysis (LDA), Naive Bayes, Gradient Boosting Machine (GBM), XGBoost, glmBoost, Elastic Net (Enet), Ridge, Least Absolute Shrinkage and Selection Operator (LASSO), Stepwise Generalized Linear Model (Stepglm), and Partial Least Squares Regression Generalized Linear Model (plsRglm)35. A two-stage modeling framework was applied to generate 113 candidate model combinations. In the first stage, the initial algorithm was used for variable screening in the training cohort; in the second stage, the retained variables were used to fit a diagnostic classification model. Models with ≤5 selected variables were excluded from further comparison. The combined dermatomyositis datasets served as the training cohort, with labels defined as dermatomyositis versus healthy controls, whereas the independent validation cohort(s) were used for external performance evaluation. Internal resampling and tuning were algorithm-specific: glmnet-based models (LASSO, Ridge, and Elastic Net) used 10-fold cross-validation to select lambda.min; GBM used 10-fold internal cross-validation to determine the optimal number of trees; XGBoost used 5-fold resampling to select the final boosting round according to the minimum test log-loss; glmBoost used cvrisk-based internal cross-validation to determine the stopping iteration; and LDA was fitted under the caret cross-validation framework. For algorithms without explicit tuning steps in the present implementation, fixed or package-default settings were used. To reduce information leakage, feature selection, model fitting, and internal tuning were performed using the training cohort only, while the validation cohort(s) were used solely for independent prediction and AUC-based performance assessment. The caret package was used for machine-learning workflow management, with glmnet , randomForest , e1071 , gbm , xgboost , mboost , plsRglm , and MASS for individual algorithms. SHAP analysis was performed using the shapviz package . The random seed was set to 12345 before each model fitting. Models with fewer than 5 selected features were excluded. Model interpretability and gene-level contribution were further assessed using SHapley Additive exPlanations (SHAP), and the most informative genes were prioritized as candidate model-selected features for downstream biological interpretation.
Evaluation of the diagnostic performance
Receiver operating characteristic (ROC) curves were generated using the “pROC” R package to assess the diagnostic performance of candidate biomarkers. Expression levels and predictive accuracy of the candidate markers were validated in independent datasets (GSE5370, GSE11971, and GSE39454). Model performance was further assessed using confusion matrices. Differential expression of key module genes was visualized using volcano and box plots, and ROC curves were constructed to evaluate the diagnostic value of individual genes.
Gene set enrichment analysis
To explore coordinated functional changes associated with the candidate shared transcriptomic signals, Gene Set Enrichment Analysis (GSEA) was performed using clusterProfiler36,37. Gene expression data from dermatomyositis and control samples were ranked according to differential expression. Predefined gene sets corresponding to KEGG pathways (c2.cp.kegg.Hs.symbols.gmt) were used to evaluate whether genes within each pathway exhibited a coordinated trend of up- or down-regulation. Statistical significance was defined as P < 0.05.
Immune cell infiltration analysis
The normalized, log2-transformed, and batch-corrected dermatomyositis matrix was used for immune deconvolution. The CIBERSORT algorithm was applied to estimate the relative abundance of immune cell subtypes using the LM22 reference matrix38. Samples with deconvolution P < 0.05 were retained for downstream analysis. Differences in inferred immune-cell proportions between groups were visualized using box plots, and Spearman correlation analysis was conducted to assess associations between immune cell subsets and candidate shared genes.
Single-cell RNA sequencing analysis for cellular contextualization
Single-cell RNA-seq analyses were performed in R using Seurat. Harmony was used for batch correction, DoubletFinder for doublet detection, celda/decontX for ambient RNA estimation, Monocle for pseudotime trajectory analysis, CellChat for cell-cell communication analysis, AUCell for gene-set activity scoring, and GSVA for ssGSEA scoring. Raw count matrices were imported into Seurat objects with the parameters min.cells = 5 and min.features = 300. Quality-control metrics, including mitochondrial, ribosomal, and hemoglobin gene proportions, were calculated for each cell. Cells were retained only if they satisfied all of the following criteria: nFeature_RNA > 500, nCount_RNA < 5,000, percent_mito < 25, percent_ribo > 3, and percent_hb < 1. Genes detected in fewer than 3 cells were excluded. In addition, MALAT1 and mitochondrial genes were removed prior to downstream analysis. After initial filtering, doublets were identified in each sample using DoubletFinder, with PCs = 1:30 and pN = 0.25; expected doublet rates were set according to sample-specific cell numbers (<4,000 cells: 2.5%; 4,000–8,000 cells: 5%; >8,000 cells: 6.5%). Only singlets were retained. Ambient RNA contamination was further estimated using decontX, and cells with contamination scores < 0.2 were retained.
The filtered data were normalized using the LogNormalize method with a scale factor of 10,000, followed by identification of variable genes, data scaling, and principal component analysis. Batch effects across samples were corrected using Harmony with orig.ident as the batch variable. The first 15 Harmony dimensions were used for UMAP visualization and neighbor-graph construction. Clustering was performed using FindNeighbors and FindClusters, and the final clustering result was defined at a resolution of 0.05. Cell types were annotated manually according to canonical marker genes together with FindAllMarkers results39.
For downstream functional contextualization, candidate-gene activity was evaluated at the single-cell level, and the relevant immune-cell subset was subjected to trajectory and intercellular communication analyses. Pseudotime analysis was performed using Monocle with DDRTree-based dimensionality reduction followed by cell ordering. Cell-cell communication analysis was conducted using CellChat with the human ligand–receptor database, restricted to the Secreted Signaling category, and communications involving fewer than 10 cells were filtered out.
For each cell, candidate-gene activity was quantified using three complementary approaches: AUCell, ssGSEA, and AddModuleScore. AUCell scores were calculated based on gene-ranking matrices, and ssGSEA scores were generated using the GSVA framework. AddModuleScore was computed using the Seurat built-in function. The resulting AUCell, ssGSEA, and AddModuleScore values were then combined into a single score matrix. Each score type was first standardized by Z-score transformation and subsequently rescaled to a 0–1 range using min–max normalization. The final composite score (“Scoring”) for each cell was defined as the sum of the three normalized scores:
Scoring = normalized AUCell + normalized ssGSEA + normalized AddModuleScore.
For downstream subgroup analyses, the CD8⁺ T-cell subset was extracted, and cells were dichotomized according to the median Scoring value within this subset. Cells with Scoring values greater than the median were assigned to the High_Hub_genes group, whereas the remaining cells were assigned to the Low_Hub_genes group.
Access restricted. Please log in or start a trial to view this content.
Results
Identification of candidate shared genes between major depressive disorder and dermatomyositis
Following data merging, normalization, and batch correction of dermatomyositis-related GEO datasets (Figure 2A,B), a total of 570 differentially expressed genes were identified (Figure 2C,D), comprising 517 up-regulated and 53 down-regulated genes. This dermatomyositis differential expressio...
Access restricted. Please log in or start a trial to view this content.
Discussion
Dermatomyositis is a chronic systemic autoimmune disease with prominent skin and muscle involvement, and accumulating clinical observations suggest that patients with dermatomyositis may also experience substantial psychiatric burden, including symptoms consistent with major depressive disorder. In this context, the present study applied an integrative bioinformatic reanalysis framework to identify candidate shared transcriptomic signals between major depressive disorder and dermatomyositis, with additional immune-infilt...
Access restricted. Please log in or start a trial to view this content.
Disclosures
The authors report no conflicts of interest in this work.
Acknowledgements
The authors gratefully acknowledge the financial support from the Beijing Municipal Health Commission's Excellence Clinical Research Program (Grant number: BRWEP2024072120118), “Cultivation Program” of Beijing Municipal Hospital Management Center (Grant number: PZ2025030), Youth Project of China-Japan Friendship Hospital (No.2020-1-QN-8).
Access restricted. Please log in or start a trial to view this content.
Materials
| Name | Company | Catalog Number | Comments |
|---|---|---|---|
| AddModuleScore | Seurat function | version 4.4.0 | Module-score calculation within Seurat RRID: NA |
| AUCell | Bioconductor | version 1.32.0 | Single-cell gene-set activity scoring RRID: SCR_021327 |
| caret | CRAN | version 7.0.1 | Machine-learning workflow support RRID: SCR_022524 |
| celda / decontX | Bioconductor | version 1.24.0 | Ambient RNA contamination estimation RRID: NA |
| CellChat | GitHub / CellChat | version 2.2.0 | Cell-cell communication analysis RRID: SCR_021946 |
| CIBERSORT / LM22 signature matrix | CIBERSORT | LM22 | Immune-cell infiltration estimation RRID: NA |
| clusterProfiler | Bioconductor | version 4.12.6 | Functional enrichment analysis RRID: SCR_016884 |
| Cytoscape | Cytoscape Consortium | version 3.10 | a network visualization platform for visualization and analysis RRID: SCR_003032 |
| DoubletFinder | GitHub / McGinnis Lab | version 2.0.4 | Doublet detection in single-cell datasets RRID: NA |
| e1071 | CRAN | version 1.7.16 | Support Vector Machine and Naive Bayes modeling RRID: NA |
| gbm | CRAN | version 2.2.2 | Gradient Boosting Machine modeling RRID: NA |
| Gene Expression Omnibus (GEO) database | National Center for Biotechnology Information (NCBI) | GSE98793 | Major depressive disorder bulk transcriptome dataset RRID: NA |
| Gene Expression Omnibus (GEO) database | NCBI | GSE1551 | Dermatomyositis training dataset; skeletal muscle biopsy samples RRID: NA |
| Gene Expression Omnibus (GEO) database | NCBI | GSE46239 | Dermatomyositis training dataset; skin biopsy samples RRID: NA |
| Gene Expression Omnibus (GEO) database | NCBI | GSE128470 | Dermatomyositis training dataset; dermatomyositis samples extracted from inflammatory myopathy cohort RRID: NA |
| Gene Expression Omnibus (GEO) database | NCBI | GSE5370 | Independent dermatomyositis validation dataset; untreated adult muscle samples RRID: NA |
| Gene Expression Omnibus (GEO) database | NCBI | GSE11971 | Independent dermatomyositis validation dataset RRID: NA |
| Gene Expression Omnibus (GEO) database | NCBI | GSE39454 | Independent dermatomyositis validation dataset; dermatomyositis samples extracted from inflammatory myopathy cohort RRID: NA |
| Gene Expression Omnibus (GEO) database | NCBI | GSE190510 | Dermatomyositis-related single-cell RNA-seq dataset RRID: NA |
| GeneMANIA | University of Toronto / GeneMANIA | web server version accessed in this study | Functional association network construction RRID: RRID:SCR_005709 |
| glmnet | CRAN | version 4.1.8 | LASSO, Ridge, and Elastic Net modeling RRID: NA |
| GSVA | Bioconductor | version 2.0.7 | ssGSEA scoring RRID: NA |
| Harmony | CRAN | version 1.2.4 | Batch correction for single-cell data integration RRID: NA |
| limma | Bioconductor | version 3.60.6 | Differential expression analysis, probe summarization, and normalization utilities RRID: SCR_010943 |
| MASS | CRAN | version 7.3.61 | Linear discriminant analysis RRID: NA |
| mboost | CRAN | version 2.9.11 | glmBoost modeling RRID: NA |
| Monocle | Bioconductor | version 2.38.0 | Pseudotime trajectory analysis RRID: SCR_016339 |
| org.Hs.eg.db | Bioconductor | version 3.19.1 | Human gene annotation database RRID: NA |
| plsRglm | CRAN | version 1.5.1 | Partial least squares generalized linear modeling RRID: NA |
| pROC | CRAN | version 1.18.5 | ROC curve analysis RRID: SCR_024286 |
| R statistical software | R Foundation for Statistical Computing | version 4.4.2 | Main statistical computing environment RRID: SCR_001905 |
| randomForest | CRAN | version 4.7.1.2 | Random Forest modeling RRID: SCR_015718 |
| RStudio | Posit Software, PBC | version 2024.4.1.748 | Integrated development environment for R RRID: SCR_000432 |
| Seurat | CRAN / Satija Lab | version 4.4.0 | Single-cell RNA-seq preprocessing, clustering, and visualization RRID: SCR_016341 |
| shapviz | CRAN | version 0.10.2 | SHAP-based model interpretability analysis RRID: NA |
| sva | Bioconductor | version 3.52.0 | Batch-effect correction using ComBat RRID: NA |
| WGCNA | CRAN | version 1.73 | Weighted gene co-expression network analysis RRID: SCR_003302 |
| xgboost | CRAN | version 1.7.8.1 | Extreme gradient boosting RRID: NA |