This study develops a diagnostic scoring model for gallbladder polyps based on conventional ultrasound and contrast-enhanced ultrasound (CEUS) features, integrating grayscale morphology with vascular and perfusion features. The system enhances differentiation between cholesterol and neoplastic polyps, improves risk stratification and diagnostic accuracy, and supports individualized clinical decision-making.
Research Article
A Retrospective Ultrasound-Based Classification Model for Differentiating Cholesterol and Neoplastic Gallbladder Polyps
1Department of General Surgery, Central Hospital of Panzhihua City, 2Department of Bile Duct Surgery, Sichuan University West China Hospital, 3Department of Hepatology, Affiliated Hospital of Panzhihua University, 4Lung Cancer Center, Sichuan University, 5Department of Internal Medicine, The Second People's Hospital of Dujiangyan City, 6Department of Neurosurgery, Affiliated Hospital of Panzhihua University
Opens in a new tab
In This Article
Summary
Loading...
$$\rightleftharpoonup{xx}$$
$$\longleftharp{xx}$$,
$$\longrightharp{xx}$$,
Abstract
Loading...
$$\rightleftharpoonup{xx}$$
$$\longleftharp{xx}$$,
$$\longrightharp{xx}$$,
A retrospective analysis was conducted using ultrasonographic data from 554 patients with pathologically confirmed gallbladder polyps, with the primary endpoint of distinguishing cholesterol from neoplastic polyps. Conventional ultrasound features were evaluated, followed by contrast-enhanced ultrasound (CEUS) to characterize vascular and perfusion patterns. CEUS was performed using a standardized approach, with the arterial phase as the primary phase and enhancement referenced to the adjacent gallbladder wall. Independent risk factors were identified using multivariate logistic regression, and diagnostic performance was evaluated by receiver operating characteristic (ROC) curve analysis. Among the included patients, 272 were diagnosed with cholesterol polyps and 282 with neoplastic polyps, including 233 gallbladder adenomas and 49 polypoid gallbladder carcinomas. Patients with neoplastic polyps were significantly older (mean age: 53 vs. 42 years) and had larger lesions (mean diameter: 10.2 vs. 6.5 mm) than those with cholesterol polyps (all p < .001). Neoplastic polyps were more frequently solitary (75.1% vs. 39.3%), hypoechoic or heterogeneous (24.9% vs. 10.7%), and associated with rich intralesional blood flow (45.9% vs. 14.3%) (p < .05). On CEUS, neoplastic polyps demonstrated hyper-enhancement (79.4% vs. 28.6%), branched or irregular vascular morphology (70.8% vs. 21.7%), wider basal width (4.5 vs. 2.2 mm), and gallbladder wall disruption (12.4% vs. 3.7%) (all p < .05). Multivariate logistic regression identified branched vascular morphology (odds ratio (OR) = 5.39), hyper-enhancement (OR = 4.37), and increased basal width (OR = 2.96) as independent risk factors (all p < .001). The combination of these indicators yielded superior diagnostic performance (area under the curve (AUC) = 0.935), significantly outperforming polyp diameter alone (AUC = 0.825; p < .01), with exploratory ROC-derived cut-points. This study proposes a diagnostic scoring model based on multimodal ultrasonographic features, demonstrating improved differentiation between cholesterol and neoplastic polyps.
Introduction
Loading...
$$\rightleftharpoonup{xx}$$
$$\longleftharp{xx}$$,
$$\longrightharp{xx}$$,
Gallbladder polyps are frequently encountered incidental findings on abdominal ultrasonography. With the widespread adoption of health screening programs and the increasing use of ultrasonography, the detection rate has been rising annually. Large population-based studies report a prevalence ranging from 3% to 9% in the general population1. Pathological types include cholesterol polyps, inflammatory polyps, adenomatous polyps, and adenomyomatosis, among others, with varying biological behavior and clinical significance. Accurate differentiation between clinically relevant categories, particularly cholesterol and neoplastic polyps, is essential for appropriate clinical management.
Cholesterol polyps are predominantly benign. Abnormal biliary cholesterol metabolism is linked to cholesterol polyp formation. These lesions generally exhibit slow growth and low malignant potential and are typically managed with follow-up surveillance. In contrast, adenomatous polyps are true neoplastic lesions and represent important precancerous stages in the gallbladder carcinogenesis pathway. Their risk of malignant transformation is highly dependent on lesion size and other risk factors. Current evidence and guidelines favor cholecystectomy for polyps greater than 10 mm, especially those larger than 15 mm or with other risk factors such as age, sessile morphology, or primary sclerosing cholangitis. However, recommendations vary across guidelines, particularly regarding surveillance intervals and risk stratification criteria for smaller lesions, reflecting limitations of size-based approaches2,3,4,5.
Due to its high sensitivity, non-invasiveness, simplicity of operation, and low cost, ultrasonography remains the primary imaging modality for the detection and initial characterization of gallbladder polyps6,7,8. High-resolution ultrasound enables the detection of small lesions and the evaluation of polyp number, size, morphology, and attachment. Cholesterol polyps are usually characterized as hyperechoic mucosal polyps with a small stalk, whereas neoplastic lesions may present as sessile or heterogeneous nodules in echogenicity9. It has been demonstrated that endoscopic ultrasonography (EUS) provides high-resolution analysis of the stratified gallbladder wall and improves delineation of the polyp–wall interface compared with transabdominal ultrasound, thereby improving diagnostic accuracy in differentiating neoplastic from non-neoplastic lesions, especially when polyps measure 6–15 mm10,11.
Color Doppler flow imaging provides complementary functional information by assessing intralesional vascularity12. Neoplastic polyps often demonstrate increased vascularity due to enhanced angiogenesis. However, Doppler findings are not specific, as inflammatory polyps may also exhibit increased vascularity; therefore, these findings should be interpreted in conjunction with other morphological and clinical variables to reduce false-positive diagnoses13.
Although imaging technology has advanced, ultrasonographic assessment of gallbladder polyps remains heavily dependent on size-based criteria (usually the 10-mm cutoff). Large-scale studies indicate that size alone is not specific, which may lead to unnecessary cholecystectomies for benign lesions while failing to detect malignant or premalignant changes in smaller neoplastic polyps7. Importantly, there is currently no standardized ultrasound-based classification system for gallbladder polyps. This lack of standardization results in significant interobserver variability in terminology, measurement techniques, and diagnostic emphasis, leading to inconsistent interpretation and variability in clinical decision-making, and an increased risk of both overtreatment of benign lesions and underdiagnosis of potentially malignant polyps.
Recent imaging studies suggest that individual sonographic characteristics, such as polyp size, echogenicity, or Doppler flow, show only moderate diagnostic value when considered independently. Several studies have demonstrated considerable overlap in grayscale and Doppler features between benign and neoplastic polyps, especially in lesions measuring 7–15 mm, which limits the discriminatory ability of single-parameter evaluation14,15. Given the limitations of both grayscale ultrasound and Doppler imaging in accurately characterizing lesion vascularity and morphology, advanced perfusion-based techniques such as contrast-enhanced ultrasound (CEUS) have been increasingly investigated to improve diagnostic precision. Emerging evidence suggests that CEUS may provide incremental diagnostic value by enabling evaluation of vascular architecture, enhancement kinetics, and lesion–wall interface characteristics, which are less apparent on conventional ultrasound16,17. However, despite promising results, CEUS-derived parameters remain inconsistently defined and reported across studies, with limited standardization in enhancement interpretation, phase selection, and vascular morphology classification. This lack of methodological consistency reduces reproducibility and limits integration into routine clinical algorithms and standardized reporting frameworks.
Therefore, there is a critical need for a standardized and reproducible ultrasound-based classification framework with clearly defined operational criteria to reduce diagnostic variability, improve risk stratification, and enhance clinical decision-making. Addressing this gap may improve diagnostic accuracy and support clinical decision-making. This study hypothesizes that integrating conventional ultrasound and CEUS features can improve differentiation between cholesterol and neoplastic gallbladder polyps. The present study was designed to develop a diagnostic classification model based on multimodal ultrasonographic features using a retrospective cohort of pathologically confirmed gallbladder polyps, with the primary endpoint of differentiating cholesterol and neoplastic polyps.
Protocol
Loading...
$$\rightleftharpoonup{xx}$$
$$\longleftharp{xx}$$,
$$\longrightharp{xx}$$,
This study was approved by the Biomedical Ethics Committee of West China Hospital, Sichuan University (Approval No.: 2024-1186). The study was conducted in accordance with the principles of the Declaration of Helsinki and relevant national ethical guidelines for biomedical research. The requirement for informed consent was waived in accordance with institutional policies, given the study's retrospective nature.
1. Study population
Ultrasonographic data from 554 patients with gallbladder polyps, confirmed by postoperative pathological examination, were retrospectively collected at a single tertiary-care center between June 2019 and June 2024. The study aimed to analyze the associations between conventional ultrasound and CEUS features and pathological classification (cholesterol vs. neoplastic polyps). Postoperative pathology revealed that cholesterol polyps were the most common type, followed by adenomatous polyps and polypoid gallbladder carcinomas.
Only patients who underwent cholecystectomy based on surgical indications (e.g., polyp diameter ≥10 mm or the presence of high-risk features such as sessile morphology, patient age, or suspected malignancy) were eligible for pathological confirmation and inclusion in the study. Therefore, the study cohort represents a surgically selected population enriched for higher-risk lesions. Polyps <10 mm were generally managed conservatively and were not included due to a lack of pathological confirmation. Consequently, the findings of this study are primarily applicable to patients with surgically relevant gallbladder polyps and are not intended for screening or surveillance of incidentally detected small polyps. A patient flow diagram illustrating the selection process is provided in Figure 1.
2. Inclusion and exclusion criteria
Patients were included if they met surgical indications (e.g., polyp diameter ≥10 mm or high-risk features) and underwent preoperative conventional ultrasound and CEUS. Conventional ultrasound provided baseline morphological assessment, whereas CEUS evaluated vascular and perfusion characteristics to support differentiation between cholesterol and neoplastic polyps. Postoperative pathological confirmation of cholesterol polyp, adenoma, or polypoid gallbladder carcinoma was required, with pathology serving as the diagnostic gold standard.
Patients were excluded if clinical or ultrasonographic data were incomplete, if surgical treatment was not performed (preventing pathological confirmation), or if no polyp was identified on postoperative pathology.
3. Reagents and equipment
Ultrasound examinations were performed using a high-resolution ultrasound system equipped with a convex probe (1–5 MHz). An ultrasound contrast agent was used for CEUS to enhance visualization of lesion vascularity. All equipment and materials are detailed in the Table of Materials with manufacturer and model information.
4. Study methods
All patients meeting surgical indications underwent cholecystectomy and received preoperative conventional ultrasound and CEUS. Imaging findings were compared with postoperative pathological results to investigate the association between sonographic features and pathological types. Color Doppler imaging mode was enabled using standardized acquisition parameters. Color Doppler imaging was performed using a predefined and standardized low-flow protocol applied uniformly across all examinations. The pulse repetition frequency was fixed at 800 Hz, the wall filter was set to low, and color gain was adjusted to the highest level not associated with background speckle noise, then reduced slightly until the noise disappeared. The insonation plane and focal zone were standardized to maximize visualization of intralesional flow while maintaining a stable frame rate. These parameters were applied consistently across all examinations to ensure reproducibility of vascularity assessment. All images were stored for subsequent analysis.
5. Examination protocol
5.1 Conventional ultrasonography
Patients fasted for at least 8 hours before examination and were positioned in the supine or left lateral decubitus position. The gallbladder was adequately distended for optimal visualization. In patients with multiple polyps, the largest lesion was selected for assessment. Documentation was made of grayscale images and color Doppler flow signals.
5.2 Contrast-enhanced ultrasound (CEUS)
CEUS was performed immediately after conventional ultrasonography. Patients were instructed on breathing coordination. A low mechanical index (<0.10) contrast mode was used. The ultrasound contrast agent (prepared according to manufacturer instructions) was administered as a bolus injection at 0.02 mL/kg through an antecubital vein, followed by a 10 mL saline flush. Dynamic cine-loop recording of the target lesion was performed for at least 2 minutes, and all images were stored for analysis. Continuous real-time imaging was performed to capture arterial (10–30 s), portal venous (31–60 s), and late phases (>120 s) for standardized qualitative assessment of enhancement characteristics, with predefined phase prioritization applied across all cases.
6. Image analysis protocol
Two experienced physicians independently reviewed all images and were blinded to pathological results, clinical data, and each other’s interpretations. Discrepancies were resolved by consensus. This blinded assessment minimized interpretation bias and ensured objective evaluation of ultrasonographic and CEUS features.
6.1 Conventional ultrasound
Polyp diameter, number (single vs. multiple), location, morphology (regular vs. irregular), echogenicity (hyperechoic, hypoechoic, isoechoic), and Doppler flow signals were documented. Intralesional vascularity was classified as absent (no detectable signal), sparse (1–2 discrete signals), or rich (≥3 signals or diffuse vascular distribution).
6.2 Contrast-enhanced ultrasound (CEUS)
Enhancement intensity (hyper-, iso-, or hypo-enhancement), enhancement pattern (centripetal or centrifugal), vascular morphology (dot-like, linear, branched, or irregular patterns), basal width, and gallbladder wall integrity (intact or disrupted) were assessed. Enhancement intensity was assessed primarily relative to the adjacent normal gallbladder wall in the same imaging plane and at a comparable depth. Surrounding hepatic parenchyma was used only as a secondary contextual reference when the adjacent gallbladder wall was incompletely visualized. To ensure reproducibility, this reference hierarchy was applied consistently across all cases. Hyper-enhancement was defined as greater enhancement than reference tissue, iso-enhancement as similar to reference tissue, and hypo-enhancement as lower than reference tissue.
Enhancement intensity and vascular morphology were classified using the arterial phase (10–30 s) as the primary assessment phase. The portal venous phase (31–60 s) and late phase (>60 s) were reviewed as ancillary phases to assess enhancement persistence, washout tendency, and lesion–wall interface clarity, but were not used as the primary basis for categorical classification. To reduce inter-case variability, the same reference hierarchy and phase priority were applied in all examinations. Basal width was defined as the maximal width of the lesion base at its attachment to the gallbladder wall, measured on the CEUS image plane demonstrating the clearest tumor–wall interface. Measurements were obtained in millimeters using electronic calipers.
Vascular morphology was categorized into four patterns: a dot-like pattern, defined as punctate or focal enhancement without visible vessel continuity on sequential frames; a linear pattern, defined as a single or slightly curved vessel-like enhancing structure without side branches; a branched pattern, defined as an organized vessel-like structure showing a main trunk with one or more clearly visible side branches and preserved hierarchical architecture; and an irregular pattern, defined as disorganized, tortuous, heterogeneous, or non-hierarchical enhancing vascular structures lacking a recognizable trunk-and-branch pattern. When classification was uncertain on a single frame, morphology was determined from the dynamic cine loop rather than a single still image. All vascular morphology classifications were based on dynamic cine-loop assessment to minimize misclassification from static frames. Representative examples of each vascular pattern are provided in Supplementary Figure 1.
6.3 Standardization
Before the study, all personnel involved in image acquisition and interpretation received standardized training at the study center. Image review was performed independently by two physicians with more than 5 years of experience in abdominal ultrasonography. This approach reduced variability and improved consistency in interpretation. Interobserver agreement for key imaging features was assessed using kappa statistics. The interobserver agreement was good to excellent, with kappa values ranging from 0.72 to 0.86 for key imaging features, indicating high consistency between observers.
7. Statistical analysis
Statistical analyses were conducted using Statistical analysis software. Normally distributed continuous variables were expressed as mean ± standard deviation and compared using the independent-samples t-test. Non-normally distributed variables were presented as median (Q1, Q3) and compared using the Mann–Whitney U test. Categorical variables were presented as frequencies and percentages and compared using the chi-square test or Fisher’s exact test, as appropriate. Pairwise comparisons employed the Bonferroni correction. Independent predictors of neoplastic gallbladder polyps were determined using multivariate logistic regression analysis following univariate screening. Variables significant in univariate analysis were entered into the multivariable logistic regression model; only predictors retained in the final model were used for score derivation.
Diagnostic performance was assessed using the DeLong test to compare the areas under the receiver operating characteristic (ROC) curves. A p-value < 0.05 was considered statistically significant. Odds ratios (ORs) with 95% confidence intervals (CIs) were reported for all independent predictors. To assess model robustness, internal validation was performed using bootstrap resampling (1,000 iterations). The optimism-corrected area under the ROC curve (AUC) was calculated to evaluate model stability and reduce potential overfitting.
Model calibration was evaluated using the Hosmer–Lemeshow goodness-of-fit test; a non-significant result indicated good agreement between predicted and observed outcomes. In addition, calibration curves were constructed to visually assess agreement between predicted probabilities and actual event rates across deciles of risk. Cases with incomplete variables required for multivariable analysis were excluded; no imputation was performed.
Results
Loading...
$$\rightleftharpoonup{xx}$$
$$\longleftharp{xx}$$,
$$\longrightharp{xx}$$,
Patient baseline characteristics
This study included 554 patients with gallbladder polyps, consisting of 272 cholesterol polyps and 282 neoplastic polyps (233 gallbladder adenomas and 49 polypoid gallbladder carcinomas). The male-to-female ratio was 1:1.6 (214 males and 340 females), and patient age ranged from 22 to 78 years, with a mean age of 48 years. These baseline findings are presented descriptively, and variables not included in the regression model were not used for predictive analysis.
Comparison between cholesterol polyps and neoplastic polyps
Univariate analysis was performed to compare clinical, conventional ultrasound, and contrast-enhanced ultrasound (CEUS) features between cholesterol and neoplastic polyps. Although cholesterol polyps demonstrated a smaller mean diameter than neoplastic polyps, this finding should be interpreted in the context of a surgically selected cohort, in which lesion selection was influenced by combined clinical and imaging risk factors rather than size alone. Accordingly, polyp diameter was analyzed both as a continuous variable and as a candidate predictor in the multivariable model, rather than as an isolated determinant.
Significant differences (p < 0.05) were observed between the two groups across several clinical and imaging parameters. Patients with neoplastic polyps tended to be older, and their lesions were more frequently solitary, larger (>10 mm), heterogeneous in echogenicity, and showed relatively abundant blood flow signals. In contrast, cholesterol polyps were more commonly multiple, smaller, predominantly hyperechoic, and associated with sparse flow signals.
On CEUS, neoplastic polyps often demonstrated branched vascular patterns, hyper-enhancement, and a broad base, with some cases showing heterogeneous enhancement and evidence of gallbladder wall destruction. Although gallbladder wall disruption was observed in a small proportion (3.7%) of cholesterol polyps, cholesterol polyps typically exhibited dot-like or single-vessel enhancement patterns, moderate enhancement, a narrow base, and preserved gallbladder wall integrity (p < 0.001). No statistically significant differences were found between the two groups regarding gender distribution, polyp location, or gross morphology (p > 0.05). These findings are summarized in Table 1 and illustrated in Figure 2 and Figure 3.
A secondary descriptive comparison between gallbladder adenomas and polypoid gallbladder carcinomas was performed as a supplementary analysis to further illustrate biological differences within the neoplastic group.
Multivariate logistic regression analysis
Variables identified as significant in univariate analysis were entered into a multivariable logistic regression model to determine independent predictors of neoplastic polyps. The final model identified branched vascular morphology (β = 1.685, OR = 5.392), hyper-enhancement (β = 1.472, OR = 4.367), and basal width (β = 1.086, OR = 2.961) as independent predictors of neoplastic polyps (all p < 0.001). Odds ratios (ORs) with 95% confidence intervals (CIs) for all predictors are presented in Table 2. These three variables comprised the final multivariable model and were subsequently used to derive scores.
The regression equation was defined as:
Logit(P) = -5.324 + 1.685 × (branched vascular morphology) + 1.472 × (hyper-enhancement) + 1.086 × (basal width).
Internal validation using bootstrap resampling (1,000 iterations) yielded an original AUC of 0.88 and an optimism-corrected AUC of 0.86, indicating limited performance decrement after resampling.
Calibration analysis showed acceptable agreement between predicted and observed outcomes, with a non-significant Hosmer–Lemeshow test (p = 0.47). The calibration curve is presented in Figure 4, and detailed validation and calibration metrics are summarized in Table 3.
Diagnostic performance analysis
ROC analysis identified cohort-specific exploratory cut-points of 14 mm for polyp diameter and 3.5 mm for basal width; these values are reported descriptively and should not be interpreted as fixed clinical thresholds. When the three model-derived predictors (enhancement intensity, vascular morphology, and basal width) were combined, the resulting sensitivity, specificity, and overall accuracy were superior to those of any single parameter. Compared with polyp diameter alone, the combined indicators produced a significantly larger area under the curve (AUC) (p < 0.01), demonstrating that a multi-parameter approach may improve diagnostic accuracy for differentiating cholesterol from neoplastic gallbladder polyps. These results are summarized in Table 4 and Figure 5.
Development of a risk prediction scoring system
A point-based exploratory scoring system was derived from the β coefficients of the final multivariable logistic regression model. Only predictors retained in the final multivariable logistic regression model—branched vascular morphology, hyper-enhancement, and basal width—were used for score derivation. Additional ultrasonographic features were analyzed descriptively but were not included in the final model and did not contribute to the scoring system. Coefficients were scaled relative to the smallest β coefficient and rounded to generate simplified integer point values. Supplementary ultrasonographic features were analyzed descriptively but were not incorporated into the core model-derived score.
The cumulative score provided an estimate of the likelihood of neoplastic pathology in individual patients based on the independent predictors identified in the multivariable regression model. In addition, supplementary ultrasonographic features (such as polyp diameter, echogenicity, intralesional flow signals, and concomitant gallbladder abnormalities) were incorporated as descriptive variables to enhance clinical interpretability; however, these variables were not included in the final regression model and therefore did not contribute to the core model-derived risk estimation.
Concomitant gallbladder abnormalities—such as gallbladder wall thickening >3 mm, porcelain gallbladder, or gallstones—were evaluated as supplementary descriptive features and were not retained in the final multivariable model. The scoring system was constructed using regression coefficient-based weighting, providing a preliminary and exploratory tool for clinical risk assessment. These findings are presented in Table 5.
Quantitative risk prediction scoring system
The standardized scoring system assigns 0–2 points to each predictor based on the relative magnitude of its regression coefficient (β), with higher coefficient-derived weights corresponding to higher scores. In clinical practice, physicians can evaluate cases using the core model-derived predictors, while supplementary ultrasonographic features may be considered separately for contextual interpretation (Table 6). A higher cumulative score indicates a greater likelihood of neoplastic pathology. This system provides a quantitative, intuitive framework for clinical risk stratification.
DATA AVAILABILITY:
All data supporting the findings of this study are provided within the manuscript and Supplementary File 1.
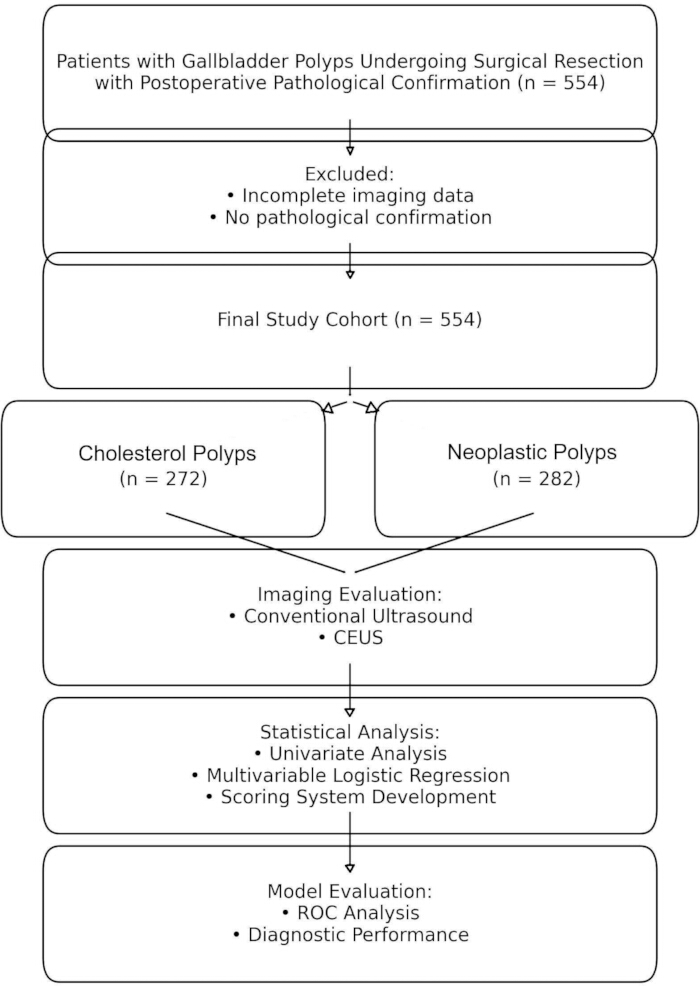
Figure 1: Patient flow diagram illustrating cohort selection and analysis workflow. Patient flow diagram illustrating study cohort selection, classification into cholesterol and neoplastic polyps, imaging evaluation, and statistical analysis workflow. Please click here to view a larger version of this figure.
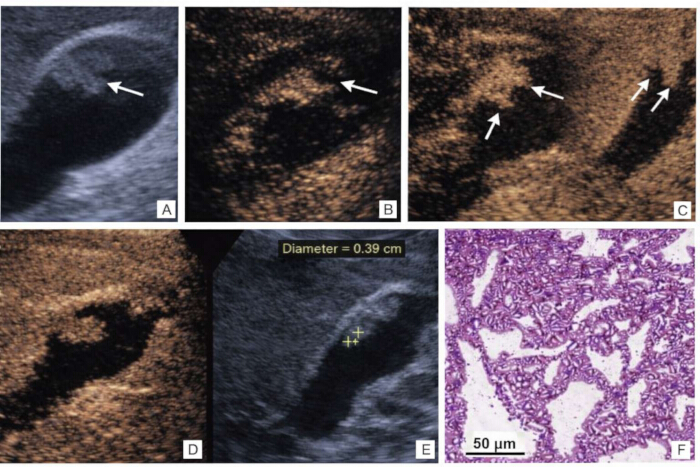
Figure 2: Representative conventional ultrasound and contrast-enhanced ultrasound (CEUS) findings of a cholesterol gallbladder polyp with corresponding histopathology. (A) Conventional ultrasound image showing a hyperechoic polypoid lesion with a narrow stalk (arrow). (B–D) CEUS images demonstrating homogeneous iso- to mild hyper-enhancement (arrows). (E) Measurement of polyp diameter on ultrasound imaging. (F) Histopathological image (hematoxylin–eosin staining) confirming a cholesterol polyp. Please click here to view a larger version of this figure.
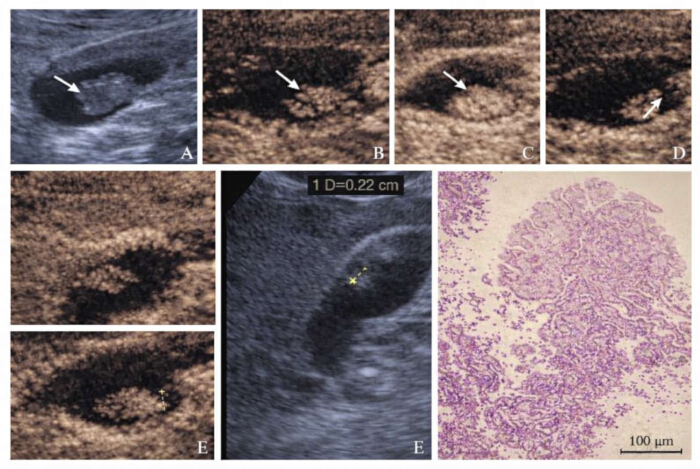
Figure 3: Representative conventional ultrasound and contrast-enhanced ultrasound (CEUS) findings of a neoplastic gallbladder polyp with corresponding histopathology. (A) Conventional ultrasound image showing a heterogeneous echogenic lesion with a broad base (arrow). (B–D) CEUS images demonstrating hyper-enhancement and branched or irregular vascular morphology (arrows). (E) Measurement of lesion size and basal width. (F) Histopathological image (hematoxylin–eosin staining) confirming a neoplastic polyp. Please click here to view a larger version of this figure.
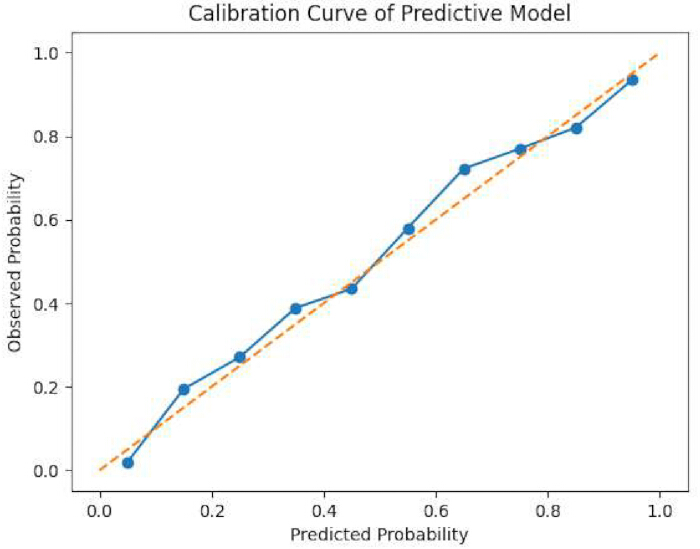
Figure 4: Calibration curve of the multivariable predictive model. Predicted probabilities were grouped by deciles of risk and compared with observed event rates. The dashed diagonal line indicates ideal calibration. Please click here to view a larger version of this figure.
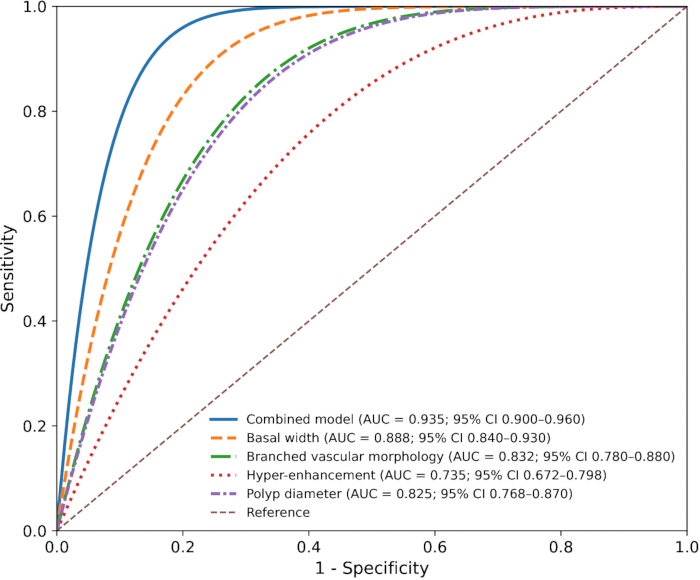
Figure 5: ROC curves for diagnostic performance of the model and predictors. Receiver operating characteristic (ROC) curves comparing diagnostic performance of the combined model and individual ultrasonographic predictors for differentiating cholesterol and neoplastic gallbladder polyps. The combined model showed the highest diagnostic performance (AUC = 0.935, 95% CI 0.900–0.960), followed by basal width (AUC = 0.888, 95% CI 0.840–0.930), branched vascular morphology (AUC = 0.832, 95% CI 0.780–0.880), polyp diameter (AUC = 0.825, 95% CI 0.768–0.870), and hyper-enhancement (AUC = 0.735, 95% CI 0.672–0.798). The x-axis represents 1 − specificity, and the y-axis represents sensitivity. Please click here to view a larger version of this figure.
| Variable | Cholesterol Polyps (n = 272) | Neoplastic Polyps (n = 282) | χ² Value | P Value | |
| Gallbladder Adenomas (n = 233) | Polypoid Gallbladder Carcinomas (n = 49) | ||||
| Sex [n (%)] | 0.389 | 0.533 | |||
| Male | 97 (35.7) | 97 (41.6) | 20 (40.7) | ||
| Female | 175 (64.3) | 136 (58.4) | 29 (59.3) | ||
| Age (years, mean ± SD) | 42 | 53 | 58 | -4.012 | <0.001 |
| Polyp Number [n (%)] | 13.462 | <0.001 | |||
| Solitary | 107 (39.3) | 175 (75.1) | 39 (80.0) | ||
| Multiple | 165 (60.7) | 58 (24.9) | 10 (20.0) | ||
| Polyp Location [n (%)] | 1.025 | 0.599 | |||
| Fundus | 78 (28.6) | 58 (24.9) | 10 (20.4) | ||
| Body | 126 (46.4) | 116 (49.8) | 20 (40.8) | ||
| Neck | 68 (25.0) | 59 (25.3) | 19 (38.8) | ||
| Polyp Diameter (mm, mean ± SD) | 6.5 | 10.2 | 12.5 | -5.367 | <0.001 |
| Polyp Morphology [n (%)] | 0.6438 | 0.727 | |||
| Regular | 165 (60.7) | 136 (58.4) | 29 (59.2) | ||
| Irregular | 107 (39.3) | 97 (41.6) | 20 (40.8) | ||
| Echogenicity [n (%)] | 10.212 | 0.006 | |||
| Hypoechoic | 29 (10.7) | 58 (24.9) | 29 (59.2) | ||
| Isoechoic | 97 (35.7) | 88 (37.8) | 10 (20.4) | ||
| Hyperechoic | 146 (53.6) | 87 (37.3) | 9 (18.4) | ||
| Flow Signals [n (%)] | 18.756 | <0.001 | |||
| Absent | 175 (64.4) | 48 (20.6) | 10 (20.4) | ||
| Sparse | 58 (21.3) | 78 (33.5) | 9 (18.4) | ||
| Rich | 39 (14.3) | 107 (45.9) | 30 (61.2) | ||
| CEUS | |||||
| Enhancement Intensity (arterial phase) [n (%)] | 20.321 | <0.001 | |||
| Iso-enhancement | 194 (71.4) | 48 (20.6) | 10 (20.4) | ||
| Hyper-enhancement | 78 (28.6) | 185 (79.4) | 39 (79.6) | ||
| Enhancement Pattern [n (%)] | 6.841 | 0.033 | |||
| Centripetal | 253 (93.0) | 204 (87.5) | 39 (79.6) | ||
| Centrifugal | 19 (7.0) | 29 (12.5) | 10 (20.4) | ||
| Vascular Morphology [n (%)] | 22.534 | <0.001 | |||
| Dot-like | 155 (57.0) | 29 (12.4) | 0 (0.0) | ||
| Linear | 58 (21.3) | 39 (16.7) | 0 (0.0) | ||
| Branched | 39 (14.3) | 117 (50.2) | 20 (40.8) | ||
| Irregular | 20 (7.4) | 48 (20.6) | 29 (59.2) | ||
| Gallbladder Wall Integrity [n (%)] | 4.218 | 0.04 | |||
| Intact | 262 (96.3) | 204 (87.6) | 39 (79.6) | ||
| Disrupted | 10 (3.7) | 29 (12.4) | 10 (20.4) | ||
| Basal Width [mm] | 2.2 | 4.5 | 6 | 9.123 | <0.001 |
Table 1: Comparison of baseline clinical and ultrasonographic (including CEUS) features between cholesterol and neoplastic gallbladder polyps.
Baseline characteristics and imaging features were compared between the two groups.
| Characteristic | Regression Coefficient (β) | Standard Error | Wald χ2 Value | p- Value | OR | 95% CI |
| Branched Vascular Morphology | 1.685 | 0.482 | 13.85 | <0.001 | 5.392 | 2.185~13.206 |
| Hyper-enhancement | 1.472 | 0.428 | 12.98 | <0.001 | 4.367 | 2.005~9.508 |
| Basal Width | 1.086 | 0.258 | 20.63 | <0.001 | 2.961 | 1.865~4.698 |
| Constant | -5.324 | 0.865 | 42.35 | <0.001 | 0.005 | - |
Table 2: Multivariable logistic regression analysis of independent predictors of neoplastic polyps. Regression coefficients, odds ratios, confidence intervals, and p-values for identified predictors.
| Metric | Value |
| Original AUC | 0.88 |
| Bootstrap-corrected AUC | 0.86 |
| Optimism (AUC difference) | 0.02 |
| Hosmer–Lemeshow χ² | 7.12 |
| Hosmer–Lemeshow p-value | 0.47 |
| Calibration slope | 0.94 |
| Calibration intercept | 0.03 |
Table 3: Internal validation and calibration performance of the multivariable predictive model. Model performance metrics, including AUC and calibration statistics.
| Indicator | Area Under Curve (AUC) (95% CI) | Sensitivity (%) | Specificity (%) | Accuracy (%) | Optimal Cut-off Value | p-Value |
| Diameter | 0.825 (0.768 - 0.870) | 80.2 | 73.5 | 76.8 | 14mm | <0.001 |
| Enhancement Intensity | 0.735 (0.672 - 0.798) | 77.5 | 70.8 | 74.2 | - | <0.001 |
| Vascular Morphology | 0.832 (0.780 - 0.880) | 85 | 75.5 | 81 | - | <0.001 |
| Basal Width | 0.888 (0.840 - 0.930) | 78 | 82 | 80.5 | 3.5mm | <0.001 |
| Combined Indicators | 0.935 (0.900 - 0.960) | 89 | 86 | 87.5 | - | <0.001 |
Table 4: Diagnostic performance of individual ultrasonographic and CEUS predictors and their combined model. Sensitivity, specificity, accuracy, and AUC values for each parameter and the combined model.
| Variable | Significance | β (Coefficient) | OR |
| Maximum Diameter | <0.001 | 1.6 | 5 |
| Basal Morphology | <0.001 | 1.3 | 3.7 |
| Internal Echogenicity | 0.002 | 0.9 | 2.5 |
| Flow Signals | <0.001 | 0.7 | 2 |
| Concomitant Gallbladder Abnormalities | 0.023 | 1.1 | 3 |
Table 5: Independent predictors retained in the final multivariable logistic regression model used for score derivation. Variables included in the final model and their corresponding regression parameters.
| Scoring Criterion | Scoring Criterion | Points |
| Maximum Diameter | <5 mm 0 points | 0/1/2 |
| 5-0mm 1 point | ||
| ≥10 mm 2 points | ||
| Basal Morphology | Pedunculated (stalk width ≤4 mm) 0 points. Wide stalk (stalk width >4 mm) 2 points | 0/2 |
| Internal Echogenicity | Homogeneous hyperechoic/isoechoic 0 points | 0/1 |
| Hypoechoic/heterogeneous 1 point | ||
| Flow Signals | No flow 0 points | 0/1/2 |
| Dot-like flow 1 point← | ||
| Rich flow 2 points | ||
| Concomitant Gallbladder Abnormalities | No abnormalities 0 points | 0/1 |
| Gallbladder wall thickening (>3 mm) 1 point | ||
| Porcelain gallbladder 1 point | ||
| Gallstones 1 point |
Table 6: Exploratory point-based scoring system derived from the final multivariable model. Assigned point values for each predictor based on regression coefficients.
Supplementary Figure 1: Representative contrast-enhanced ultrasound (CEUS) vascular morphology patterns used for classification. (A) Dot-like pattern: punctate focal enhancement without visible vascular continuity. (B) Linear pattern: a single vessel-like linear enhancement without branching. (C) Branched pattern: organized vascular architecture with a main trunk and visible side branches. (D) Irregular pattern: disorganized, tortuous, and non-hierarchical vascular structures lacking a clear branching pattern. Patterns were classified based on dynamic cine-loop assessment rather than single-frame evaluation.Please click here to download this file.
Supplementary File 1: The Supplementary materials include variable definitions, full regression outputs, scoring system derivation, and interobserver agreement analysis Please click here to download this file.
Discussion
Loading...
$$\rightleftharpoonup{xx}$$
$$\longleftharp{xx}$$,
$$\longrightharp{xx}$$,
Ultrasonography remains the first-line modality for evaluating gallbladder polyps owing to its accessibility, real-time imaging capability, and lack of ionizing radiation7. Nevertheless, despite these advantages, the lack of a standardized ultrasonographic reporting system contributes to inconsistencies in interpretation and clinical decision-making across institutions, which may negatively affect diagnostic accuracy and subsequent management3. Similar issues have been noted in recent guideline and consensus reviews, which underscore that non-standardized descriptors and size-based thresholds alone may result in either overtreatment or delayed treatment4,5.
In this study, a large cohort of 554 pathologically confirmed gallbladder polyps was analyzed to propose a structured ultrasound-based classification and risk assessment framework. Consistent with prior investigations, neoplastic polyps (adenomas and carcinomas) were more frequently solitary, larger, and occurred in older patients, whereas cholesterol polyps were predominantly multiple and smaller12,15. Beyond size, neoplastic polyps demonstrated heterogeneous or hypoechoic echogenicity and increased vascularity, features linked to increased cellular density and angiogenesis in histopathologic correlation studies18,19. Notably, a small proportion of cholesterol polyps in the present cohort demonstrated apparent gallbladder wall disruption. This atypical finding may be related to localized inflammation, partial-volume effects, or imaging artifacts rather than to true pathological invasion. These imaging characteristics may reflect underlying microvascular proliferation associated with neoplastic transformation.
Contrast-enhanced ultrasound further improved lesion characterization by enabling real-time assessment of perfusion dynamics and vascular architecture. In the present study, CEUS assessment was standardized using the arterial phase as the primary evaluation phase, with enhancement intensity referenced to the adjacent gallbladder wall, thereby improving interpretability and reproducibility. Neoplastic polyps demonstrated hyper-enhancement, branched or irregular vascular morphology, wider basal attachment, and occasional disruption of the gallbladder wall, whereas cholesterol polyps typically showed iso-enhancement, dot-like or linear vascular patterns, narrower basal attachments, and intact wall structures. These findings are in agreement with prior CEUS-based studies and radiomics analyses, which have demonstrated that abnormal neovascular architecture and broad-based attachment are key imaging hallmarks of neoplastic gallbladder lesions17. Such vascular patterns may correspond to tumor-induced angiogenesis and invasive growth behavior. Future studies incorporating direct correlation between ultrasound imaging planes and corresponding gross pathological sections (including loupe-level visualization) are warranted to strengthen imaging–pathology concordance.
In addition to vascular and perfusion characteristics, specific structural ultrasonographic features have also been reported to aid in differentiating benign polyps from polypoid gallbladder carcinoma. Notably, the presence of a deep hypoechoic area within the lesion or a conically thickened outermost hyperechoic layer has been associated with malignant transformation and may help distinguish early-stage (T1) from more invasive (T2) gallbladder carcinoma. These findings likely reflect subserosal invasion and disruption of normal wall stratification, thereby providing additional diagnostic value beyond conventional size and vascular criteria. Incorporating such structural features into ultrasonographic assessment may further improve diagnostic accuracy and should be considered in comprehensive imaging evaluation20.
Multivariate logistic regression identified branched vascular morphology, hyper-enhancement, and basal width as independent predictors of neoplastic polyps. The combined model incorporating these three predictors demonstrated improved diagnostic performance compared with individual parameters, including polyp diameter alone. Internal validation demonstrated stable model performance with minimal optimism, indicating robustness. These findings are consistent with accumulating evidence that diameter-based criteria, especially the conventional ≥10 mm threshold, are not sufficiently specific and require incorporation of additional morphologic and perfusion-related features8,21.
In this study, adenomatous polyps and polypoid gallbladder carcinomas were grouped as neoplastic lesions. This classification is biologically and clinically justified because they represent stages of the adenoma–carcinoma sequence and should be considered as such when detected. Similar grouping strategies have been adopted in previous predictive modeling and guideline-oriented studies to enhance clinical applicability22. However, larger cohorts enriched for carcinoma cases are needed to further refine differential prediction between premalignant and malignant lesions.
The scoring system was derived exclusively from predictors retained in the final multivariable model. Additional ultrasonographic features were evaluated descriptively and may support clinical interpretation, but were not incorporated into the model23. This scoring system provides a structured approach to risk stratification beyond size-based criteria. Clinically, this model may assist in exploratory risk stratification and identification of patients who may benefit from closer follow-up or further evaluation; however, its role in guiding surgical decision-making requires prospective validation.
Overall, this study's findings suggest that integrating conventional ultrasound with CEUS-derived vascular and morphologic features can improve differentiation between cholesterol polyps and neoplastic gallbladder lesions. This structured, multiparametric approach provides a foundation for future external validation and may inform the development of standardized reporting systems to improve diagnostic consistency and patient-centered management. Importantly, the proposed model should be interpreted as a diagnostic support tool derived from retrospective data rather than a validated clinical standard.
This study has several limitations. First, its retrospective single-center design may introduce selection bias and limit generalizability. Second, the cohort represents a surgically selected population, excluding conservatively managed small polyps lacking pathological confirmation. Third, adenomas and carcinomas were combined into a single neoplastic category, potentially obscuring biological differences between premalignant and malignant lesions. Fourth, external validation was not performed, and the absence of multicenter validation may limit broader applicability. Additionally, although CEUS demonstrated high diagnostic accuracy, its availability and operator dependence may limit widespread implementation. Fifth, due to the retrospective nature of this study, direct one-to-one correlation between ultrasound imaging planes and corresponding pathological sections could not be systematically performed, which may limit direct imaging–pathology concordance.
Future studies should focus on prospective validation, multicenter cohort analysis, and external testing of the proposed scoring model. Further studies are required to refine risk thresholds and validate the clinical applicability of the proposed model. The incorporation of advanced imaging analytics, such as radiomics, may further enhance predictive accuracy and clinical applicability.
Conclusion:
This study proposes an exploratory ultrasound-based risk stratification system for gallbladder polyps that incorporates both grayscale and contrast-enhanced imaging parameters. By integrating CEUS-derived vascular morphology, enhancement patterns, and basal width with conventional sonographic characteristics, the model demonstrates improved diagnostic performance within this cohort compared with size-based criteria alone. This approach may support exploratory clinical decision-making; however, the model requires external validation before routine clinical application. The findings should be considered hypothesis-generating rather than practice-changing, and prospective multicenter studies are needed to confirm clinical utility.
Disclosures
Loading...
$$\rightleftharpoonup{xx}$$
$$\longleftharp{xx}$$,
$$\longrightharp{xx}$$,
The authors declare no conflicts of interest.
Author Contributions:
F.C. conceptualized the study, developed the methodology, performed formal analysis and investigation, curated the data, and drafted the original manuscript. J.X. contributed to validation. W.L., X.H., and S.H. contributed to manuscript review and editing. H.Y. provided resources, supervised the study, and managed project administration. All authors have read and approved the final manuscript.
Acknowledgements
Loading...
$$\rightleftharpoonup{xx}$$
$$\longleftharp{xx}$$,
$$\longrightharp{xx}$$,
The authors declare that no external funding was received for this study.
Materials
| Name | Company | Catalog Number | Comments |
|---|---|---|---|
| Ultrasound Diagnostic System | Resonance Medical | Resonance R9 / Resonance 7 | Used for conventional transabdominal ultrasonography and contrast-enhanced ultrasound (CEUS) examinations |
| High-Frequency Ultrasound Probe | Resonance Medical | Integrated with Resonance R9 / 7 system | Used for detailed grayscale imaging of gallbladder polyps |
| Ultrasound System with Contrast-Enhanced Imaging Capability | Resonance Medical | Resonance R9 / Resonance 7 (CEUS mode) | Enabled real-time contrast-enhanced imaging |
| Ultrasound Contrast Agent | Bracco Imaging | SonoVue® (59 mg/vial) | Used for CEUS perfusion and vascular assessment; reconstituted with 5 mL saline prior to intravenous administration |
| Intravenous Cannula | Becton, Dickinson and Company (BD) | Standard peripheral IV cannula | Used for intravenous administration of contrast agent |
| Image Analysis Software | Manufacturer-integrated | System-integrated software | Used for measurement of polyp diameter, basal width, and enhancement patterns |
| Pathology Processing System | Leica Biosystems | Automated tissue processor | Used for postoperative histopathological confirmation |
| Hematoxylin and Eosin (H&E) Staining Kit | Sigma-Aldrich | Standard H&E staining reagents | Used for standard histological staining for diagnostic confirmation |
| Statistical analysis software | IBM | SPSS 26.0 | Used for statistical analysis |
| Statistical analysis software | MedCalc Software Ltd | MedCalc 20.0 | Used for ROC analysis |
Reprints and Permissions
Request permission to reuse the text or figures of this JoVE article
Request Permission