This retrospective study developed an exploratory recurrence-risk model and compared model-informed risk-guided with routine follow-up after ESD. Risk-guided follow-up was associated with lower 12-month recurrence and better psychological, self-management, nutritional, satisfaction, and resource-use outcomes, although the nonrandomized design and lack of external validation limit causal and predictive interpretation.
Research Article
A Nursing Protocol for Risk-Guided Follow-Up After Endoscopic Submucosal Dissection in Early Gastrointestinal Cancer
50 views
⸱
September 11th, 2026
In This Article
Summary
Abstract
Endoscopic submucosal dissection (ESD) is widely used for early gastrointestinal cancer, although postoperative recurrence remains clinically relevant. We conducted a two-stage retrospective cohort study. The model-development cohort included 124 patients treated between January 2022 and January 2023, of whom 22 experienced recurrence. Seven nursing-relevant postoperative indicators were entered into a multivariable logistic regression model. Because several indicators were recorded during postoperative follow-up, the model was interpreted as an exploratory recurrence-risk model rather than a baseline prognostic tool. The apparent area under the receiver operating characteristic curve was 0.922 (95% CI, 0.872-0.972); at a probability threshold of 0.1484, sensitivity was 95.45%, and specificity was 84.31%, while bootstrap internal validation yielded an optimism-corrected AUC of 0.884. A separate retrospective comparative cohort included 84 patients treated in 2024: 42 had received model-informed risk-guided follow-up, and 42 had received routine fixed-interval follow-up. During 12 months, recurrence occurred in 5 of 42 patients (11.90%) and 13 of 42 patients (30.95%), respectively, corresponding to a risk difference of −19.05 percentage points (95% CI, -35.55 to -1.37) and a relative risk of 0.38 (95% CI, 0.15-0.98). Generalized estimating equations showed more favorable changes in psychological status, self-management, and nutritional indicators in the risk-guided group, whereas group-by-time interactions for compliance indicators were not significant. The risk-guided group also had lower measured resource use and higher nursing satisfaction. These findings are observational associations; the limited event count, possible temporal overlap between predictors and recurrence, the absence of external validation, and nonrandomized comparisons limit predictive and causal interpretation.
Introduction
Early gastrointestinal cancer remains a major global health burden, with roughly 2 million new cases reported each year, of which more than 40% occur in China1. Endoscopic submucosal dissection (ESD) has become a cornerstone treatment because it allows en bloc removal while preserving gastrointestinal anatomy and function, and its uptake in China has been reported to exceed 150,000 procedures annually. However, recurrence is still reported in 15-22% of patients within 1–3 years after ESD, and delayed recognition of recurrent disease may result in nearly 60% of these patients presenting with advanced lesions, thereby adversely affecting long-term outcomes2. In routine practice, surveillance is commonly delivered as a fixed schedule (e.g., “6 months-1 year-2 years”)3, largely determined by pathological staging, with limited attention to nursing-intervenable contributors such as dietary adherence and psychological status. Data indicate that this traditional model results in a 30% missed detection rate among high-risk populations and over 40% unnecessary follow-up among low-risk groups, leading to not only wasted medical resources (with redundant per capita annual examination costs exceeding 2,000 RMB) but also increased psychological and economic burdens on patients4,5.
Previous studies of recurrence after ESD have primarily examined lesion characteristics, histopathology, resection-related factors, Helicobacter pylori status, background mucosal changes, and selected lifestyle factors, and several site-specific risk models have been reported6,7,8,9. However, nursing-relevant behaviors and care-process indicators have rarely been linked directly to follow-up intensity10. In the present study, dietary behavior, medication adherence, psychological distress, smoking, glycemic control, and follow-up attendance were regarded as potentially modifiable or monitorable targets, whereas incomplete wound-exudate documentation was treated as a care-process marker rather than a presumed causal determinant of recurrence. Because recurrence mechanisms and surveillance requirements differ among esophageal, gastric, and colorectal lesions, the pooled analysis was considered exploratory.
This study used two retrospective cohorts with distinct purposes: an earlier cohort was used to develop and internally evaluate an exploratory recurrence-risk model, whereas a later cohort was used to retrospectively compare outcomes between patients who received model-informed, risk-guided follow-up and those who received routine, fixed-interval follow-up. The study was intended to examine whether nursing-relevant postoperative indicators could be linked to a practical follow-up pathway, rather than to establish externally validated predictive performance or a definitive causal effect of the intervention.
Protocol
The retrospective review of both cohorts was approved by the Taikang Tongji (Wuhan) Hospital (approval No. 128/06/2025). All data were anonymized before analysis, and informed consent was waived. Clinical trial registration was not required because both cohorts were retrospective, all exposures and follow-up strategies had occurred as part of routine clinical care before data extraction, and no prospective enrollment or research-directed assignment of interventions was undertaken.
Study design
This study used a two-stage retrospective cohort design. The cohort treated between January 2022 and January 2023 was used for model development and bootstrap internal validation, whereas the cohort treated between January and December 2024 was used to retrospectively compare outcomes between patients who received model-informed, risk-guided follow-up and those who received routine, fixed-interval follow-up. The second cohort evaluated the documented care pathway and did not constitute external validation of model performance. Figure 1 presents patient selection for both retrospective cohorts.
Study population
Retrospective cohort
The model-development cohort comprised 124 patients with early gastrointestinal cancer who underwent ESD in the Department of Gastroenterology between January 2022 and January 2023. The inclusion criteria were: (1) pathologically confirmed early esophageal, gastric, or colorectal cancer, classified as T1a or T1b without vascular invasion; (2) first-time ESD with complete R0 resection; (3) postoperative survival of at least 6 months; and (4) complete clinical and nursing records, including the specified dietary, medication, psychological, and follow-up information. The exclusion criteria were: (1) distant metastasis or multiple primary malignant tumors; (2) neoadjuvant chemoradiotherapy; (3) a severe postoperative complication requiring reoperation within 3 months; (4) cognitive impairment or mental illness that precluded follow-up cooperation; and (5) loss to follow-up or incomplete data. No formal a priori sample-size calculation was performed because this was a retrospective model-development cohort, and all eligible records available during the prespecified period were included. For binary clinical prediction models, however, sample-size adequacy depends on the number of outcome events, the number of candidate predictor parameters, anticipated model performance, and the need to limit overfitting, rather than on the total sample size alone. The cohort contained 22 recurrence events across seven predictor parameters, corresponding to 3.1 events per parameter; given this low event-to-parameter ratio, the model was considered vulnerable to coefficient instability and overfitting11,12.
Retrospective comparative cohort
The retrospective comparative cohort comprised 84 patients with early gastrointestinal cancer who underwent ESD between January and December 2024 and had complete documentation of the follow-up strategy received and the prespecified 12-month outcomes. The inclusion criteria were: (1) pathologically confirmed early esophageal, gastric, or colorectal cancer; (2) ESD performed during the prespecified study period; (3) complete documentation of the follow-up strategy received; and (4) complete 12-month outcome data. The exclusion criteria were: (1) distant metastasis or multiple primary malignant tumors; (2) neoadjuvant chemoradiotherapy; (3) a severe postoperative complication requiring reoperation within 3 months; (4) cognitive impairment or mental illness that precluded follow-up participation; and (5) incomplete follow-up or outcome data. Based on the follow-up strategy documented in the medical and nursing records, 42 patients were classified into the model-informed, risk-guided follow-up group and 42 into the routine, fixed-interval follow-up group. No random allocation, allocation concealment, or research-directed assignment was performed. The cohort size was determined by the number of eligible records with complete 12-month outcome data during the prespecified period; consequently, no prospective power-based sample size calculation was applicable.
Data collection
Retrospective data extraction
Baseline variables included age, sex, body mass index (BMI), and pathological type. Nursing-relevant postoperative indicators were abstracted using the prespecified definitions in the database: high-salt or spicy food intake at least twice per week during the first 3 postoperative months; incomplete daily wound-exudate documentation during the first postoperative month; a Hospital Anxiety and Depression Scale score (HADS)13 ≥11 at 1 month; at least two missed doses of sucralfate per week during the first 3 postoperative months; at least two missed follow-up appointments during the first 6 months; smoking at least 10 cigarettes per day for at least 6 months; and a mean fasting blood glucose concentration ≥7.0 mmol/L during the first 3 postoperative months among patients with diabetes. The outcome was recurrence within 12 months, defined as local recurrence or metachronous cancer confirmed by endoscopic biopsy and histopathology. Because the assessment windows for several postoperative indicators overlapped with the recurrence-observation period, temporal precedence could not be verified for every patient; these variables were therefore analyzed as postoperative correlates of recurrence, and the resulting model was not interpreted as a baseline prognostic tool.
Model development and internal validation
Seven binary nursing-relevant variables—high-salt or spicy food intake, incomplete wound-exudate documentation, HADS score ≥11, irregular sucralfate use during the first 3 postoperative months, at least two missed follow-up appointments, smoking exposure, and uncontrolled diabetes—were entered simultaneously into a multivariable logistic regression model. Logistic regression was selected because the outcome was binary and the study sought an interpretable probability equation that could be applied in routine records. Alternative statistical or machine-learning algorithms were not compared because only 22 recurrence events were available, making reliable algorithm development and tuning unlikely. Multicollinearity was assessed using variance inflation factors, with values >5 regarded as unacceptable.
Model discrimination was assessed using the area under the receiver operating characteristic curve, with the 95% confidence interval calculated using the DeLong method. The operating threshold was selected by maximizing the Youden index, after which sensitivity and specificity were calculated. Calibration was evaluated using the Hosmer-Lemeshow goodness-of-fit test, the Brier score, and a calibration plot based on predicted risk quintiles. Apparent and bootstrap-corrected calibration were displayed, with optimism estimated from 1,000 bootstrap resamples in which the full model was refitted; the same bootstrap procedure was used to estimate optimism in the AUC14. Regression coefficients, odds ratios, confidence intervals, the intercept, and the complete probability equation were reported to permit independent calculation of the model score.
Intervention protocol
Risk-guided follow-up group: Medical and nursing records indicated that patients in this group had received follow-up and nursing support linked to the model-derived recurrence probability. The probabilities were categorized using the operational thresholds retained in the original institutional pathway: low risk, <20%; intermediate risk, 20% to <40%; and high risk, ≥40%. These thresholds reflected local clinical practice and multidisciplinary review rather than cutoffs derived from a published guideline, previous validation study, or formal Delphi consensus; they were used to determine nursing intensity and were distinct from the ROC-derived threshold of 0.1484, which was used solely to summarize model sensitivity and specificity.
The pathway was implemented through routine follow-up by gastroenterology nursing staff. Low-risk patients received one annual review, a standardized booklet covering diet, daily lifestyle, and warning symptoms, and brief reinforcement messages every 3 months. Intermediate-risk patients received semi-annual review, including one outpatient endoscopic reassessment, together with monthly nurse-led telephone contacts, review of food diaries, individualized dietary plans, and reinforcement of medication adherence. High-risk patients received an eight-session structured cognitive-behavioral support program delivered once weekly, video-based wound-care instruction, daily recording of bleeding, pain, abdominal distension, and other warning symptoms, weekly submission of the records to the nursing team, monthly family meetings to clarify supervision responsibilities, and coordinated diabetes management with endocrinology consultation and scheduled glucose monitoring.
The archived pathway described the psychological component as cognitive behavioral therapy (CBT) but did not retain the provider’s mental-health credentials or a treatment manual; it is therefore reported conservatively as structured cognitive-behavioral support rather than formal therapist-delivered CBT. The risk-guided follow-up pathway was developed primarily as a local institutional pathway, drawing on the hospital’s routine post-ESD procedures and published recommendations supporting scheduled endoscopic surveillance after curative ESD15,16. The published guidance informed the general surveillance framework but did not specify the model-based probability thresholds or the nursing actions assigned to each risk tier. These elements were developed locally by mapping nursing-relevant indicators to corresponding care actions and were reviewed by the hospital’s multidisciplinary clinical team without a formal Delphi process. Delivery was documented in the existing nursing and follow-up records; no separate fidelity checklist, prespecified fidelity threshold, or independent fidelity assessment was retained (Table 1).
Routine follow-up group: Records indicated that patients in this group had received fixed-interval follow-up, including endoscopic examinations at 6 months, 1 year, and 2 years after surgery, as well as routine health education without model-informed, individualized guidance.
Outcome indicators
Model performance indicators
Model performance was summarized using the AUC and its 95% confidence interval; the selected probability threshold; sensitivity, specificity, and the Youden index; the Hosmer-Lemeshow statistic and P value; the Brier score; bootstrap-estimated optimism; and the optimism-corrected AUC.
Comparative outcome in the retrospective comparative cohort
The principal comparative outcome was recurrence confirmed by endoscopic biopsy and histopathology within 12 months after ESD. Results were reported as absolute numbers and percentages, together with the risk difference, relative risk, odds ratio, and their 95% confidence intervals. Exact recurrence dates were not retained in the 2024 analysis dataset; therefore, recurrence-free survival, Kaplan-Meier curves, Cox regression, and recurrence-time distributions were not analyzed.
Nursing management quality indicators
Nursing compliance was evaluated at 1, 6, and 12 months and included dietary compliance, defined as high-salt or spicy food intake fewer than twice per week; wound-care execution, defined as completion of standardized daily wound records; medication adherence, defined as fewer than two missed doses per week; and follow-up adherence, defined as no missed scheduled appointments.
Psychological status was assessed at the same time points using the Chinese version of the 14-item Hospital Anxiety and Depression Scale, which comprises 7-item anxiety and depression subscales, each scored from 0 to 21, with higher scores indicating greater symptom burden. Anxiety, depression, and total scores were analyzed as continuous variables. The Chinese version of the HADS has demonstrated satisfactory psychometric properties, including construct validity, internal consistency, and concurrent validity, in a multicenter sample of Chinese cancer patients13.
Self-management was assessed using the Gastrointestinal Disease Self-Management Scale recorded in the original study database. The retained scale comprised four scored domains—dietary management, symptom monitoring, medication management, and emotional regulation—and a total score calculated as the sum of the four domain scores; higher scores indicated better self-management. The original study documentation recorded a Cronbach’s α of 0.85. Item-level responses, the original instrument manual, and an independent external validation reference were not retained; the scale was therefore treated as a study instrument rather than described as a fully externally validated measure.
Nursing satisfaction was assessed at 12 months using the hospital-developed 100-point satisfaction scale recorded in the study database. Scores were categorized as very satisfied (≥90), satisfied (80–89), fair (60-79), or dissatisfied (<60). The original study documentation reported a Cronbach’s α of 0.87, but item-level responses and the original scale-development records were not retained; therefore, satisfaction findings were considered exploratory.
Medical resource efficiency indicators
Resource use was evaluated over the 12-month observation period from a hospital direct medical resource perspective. Examination costs were expressed in nominal Chinese yuan as recorded in the hospital database and included charges for endoscopic, imaging, and laboratory examinations; no inflation adjustment or discounting was applied because the analysis covered a single 12-month follow-up period. Hospitalizations attributable to recurrence or postoperative complications were identified from the electronic medical records. Follow-up time was analyzed using the composite variable retained in the database, which combined healthcare provider follow-up time with patient travel and consultation time; the individual time components were not stored separately. Because cost and utilization variables may be skewed, between-group mean differences and 95% confidence intervals were estimated using 10,000 nonparametric bootstrap resamples.
Statistical methods
Data were analyzed using SPSS and R. Continuous single-time-point variables were assessed for normality using the Shapiro-Wilk test and summarized as mean ± standard deviation or median (interquartile range), as appropriate. Between-group comparisons used independent-samples t tests or Mann-Whitney U tests. Categorical variables were summarized as n (%) and compared using Pearson’s χ2 test or Fisher’s exact test when expected cell counts were <5. Ordered satisfaction categories were compared using the Mann-Whitney rank-sum test, while the overall satisfaction rate was compared using Fisher’s exact test.
Repeated continuous outcomes were analyzed using generalized estimating equations with a Gaussian distribution, identity link, exchangeable working correlation, and robust standard errors; fixed effects comprised group, time, and the group-by-time interaction. Repeated binary compliance outcomes were analyzed using generalized estimating equations with a binomial distribution and logit link. Group-by-time interaction P values were adjusted within each outcome family using the Benjamini-Hochberg false-discovery-rate procedure, and 12-month between-group differences or odds ratios were reported with 95% confidence intervals.
One missing 6-month self-management total score in the routine-follow-up group was reconstructed as 72 because all four domain scores were available and summed exactly to that total. Recurrence comparisons were reported using the risk difference, relative risk, and odds ratio with 95% confidence intervals. Resource-use mean differences and confidence intervals were estimated using 10,000 nonparametric bootstrap resamples. The seven-variable logistic model was evaluated using the procedures described above, including 1,000 bootstrap resamples for internal validation. Because the comparative cohort was nonrandomized and contained only 18 recurrences, its results were interpreted as unadjusted observational associations rather than causal effect estimates. All tests were two-sided, and p < 0.05 was considered statistically significant.
Results
Univariate associations between nursing-relevant indicators and recurrence
Among the 124 patients in the model-development cohort, 22 experienced recurrence and 102 did not. High-salt or spicy food intake, incomplete wound-exudate documentation, HADS score ≥11, irregular sucralfate use, at least two missed follow-up appointments, smoking exposure, and uncontrolled diabetes were more frequent among patients with recurrence than among those without recurrence. Age, BMI, lesion size ≥2 cm, and poor differentiation did not differ significantly between the groups (Table 2). These univariate findings were interpreted as associations rather than evidence of causal effects (Table 2).
Model development and internal validation
The seven-variable logistic model included high-salt or spicy food intake, incomplete documentation of wound exudate, HADS score ≥11, irregular sucralfate use, at least two missed follow-up appointments, smoking exposure, and uncontrolled diabetes. Let X1-X7 denote these variables in the order listed, coded as 1 when present and 0 when absent. The linear predictor was LP = −6.0438 + 1.3123X1 + 1.6194X2 + 2.2870X3 + 0.9335X4 + 1.3526X5 + 1.1080X6 + 0.6359X7, and the estimated probability was p = exp(LP)/[1 + exp(LP)]. The apparent AUC was 0.922 (95% CI, 0.872–0.972). At the threshold of 0.1484 selected by the maximum Youden index, sensitivity was 95.45%, specificity was 84.31%, and the Youden index was 0.7977. The Hosmer-Lemeshow statistic was χ2 = 4.358 (P = 0.823), and the Brier score was 0.088. Bootstrap internal validation estimated optimism of 0.038, yielding an optimism-corrected AUC of 0.884. These performance estimates should be interpreted with caution because only 22 recurrence events were available for seven predictor parameters (Figure 2 and Tables 3,4).
Baseline characteristics of the retrospective comparative cohort
No statistically significant differences were observed between the two groups in the measured baseline characteristics, including age, sex, BMI, pathological type, lesion size, differentiation, vascular invasion, diabetes, and baseline HADS score (p > 0.05; Table 5). Because the follow-up strategy was not randomly assigned, similarity in measured characteristics does not rule out treatment selection bias or unmeasured confounding.
Twelve-month recurrence in the retrospective comparative cohort
During 12 months, recurrence was documented in 5 of 42 patients (11.90%) in the risk-guided follow-up group and 13 of 42 patients (30.95%) in the routine follow-up group. The risk-guided-minus-routine risk difference was −19.05 percentage points (95% CI, −35.55 to −1.37), the relative risk was 0.38 (95% CI, 0.15-0.98), and the odds ratio was 0.30 (95% CI, 0.10-0.94). Local recurrence occurred in 2 of 42 and 8 of 42 patients, respectively (OR, 0.21; 95% CI, 0.04-1.07; Fisher’s exact p = 0.088), while metachronous cancer occurred in 3 of 42 and 5 of 42 patients, respectively (OR, 0.57; 95% CI, 0.13-2.55; Fisher’s exact p = 0.713). Exact event dates and individual risk-tier assignments were not retained in the 2024 analysis dataset; therefore, no time-to-event or risk-tier-specific recurrence analysis was performed (Table 6).
Nursing compliance during follow-up
Generalized estimating equations did not show significant group-by-time interactions for dietary compliance, wound-care execution, medication adherence, or follow-up adherence; the false-discovery-rate-adjusted P value was 0.328 for each interaction. At 12 months, the risk-guided group nevertheless had higher odds of dietary compliance (OR, 5.55; 95% CI, 1.82–16.94), wound-care execution (OR, 7.22; 95% CI, 1.90-27.40), medication adherence (OR, 4.11; 95% CI, 1.33-12.69), and follow-up adherence (OR, 14.55; 95% CI, 1.78-118.76). These estimates describe the 12-month group differences but do not demonstrate significantly different longitudinal trajectories (Table 7).
Inter-group differences in psychological status
Generalized estimating equations showed significant group-by-time interactions for anxiety (χ2 = 20.96, false-discovery-rate-adjusted p < 0.001), depression (χ2 = 24.84, adjusted p <0.001), and total HADS score (χ2 = 40.80, adjusted p < 0.001). At 12 months, the estimated risk-guided-minus-routine differences were −1.60 points for anxiety (95% CI, -2.05 to -1.14), -1.71 points for depression (95% CI, -2.12 to -1.31), and -3.31 points for the total HADS score (95% CI, -3.95 to -2.67; Figure 3).
Inter-group differences in self-management ability
Significant group-by-time interactions were observed for dietary management, symptom monitoring, medication management, emotional regulation, and the total self-management score (all false-discovery-rate-adjusted p < 0.001). At 12 months, the estimated risk-guided-minus-routine differences were 8.62 points for dietary management (95% CI, 7.51–9.73), 10.31 points for symptom monitoring (95% CI, 9.17-11.45), 9.02 points for medication management (95% CI, 7.72–10.32), 9.10 points for emotional regulation (95% CI, 7.92–10.27), and 37.05 points for the total score (95% CI, 34.67–39.43; Figure 4).
Inter-group differences in nutritional status
Generalized estimating equations showed significant group-by-time interactions for BMI (false-discovery-rate-adjusted p < 0.001), serum albumin (adjusted p < 0.001), and hemoglobin (adjusted p = 0.006). At 12 months, the estimated risk-guided-minus-routine differences were 1.59 kg/m2 for BMI (95% CI, 0.50–2.68), 5.43 g/L for serum albumin (95% CI, 3.56–7.30), and 7.31 g/L for hemoglobin (95% CI, 3.56–11.06; Figure 5).
Inter-group differences in medical resource consumption and nursing satisfaction
Mean annual examination cost was RMB 6,330.79 ± 1,186.52 in the risk-guided group and RMB 8,269.29 ± 1,569.26 in the routine group; the bootstrap mean difference was −RMB 1,938.50 (95% CI, -2,533.51 to -1,342.91). Annual hospitalizations averaged 0.76 ± 0.79 and 1.69 ± 1.28, respectively, with a mean difference of -0.93 (95% CI, -1.38 to -0.50). Mean follow-up time was 27.05 ± 5.66 and 39.26 ± 5.96 min, respectively, with a mean difference of -12.21 min (95% CI, -14.67 to -9.83). Satisfaction-category distributions differed between groups (Mann-Whitney U = 1197.0, P = 0.001), and the overall satisfaction rates were 39 of 42 (92.86%) and 30 of 42 (71.43%), respectively (Fisher’s exact P = 0.020; Table 8).
Data Availability:
Raw data supporting the model development and retrospective comparative cohort analyses are provided in Supplementary File 1.
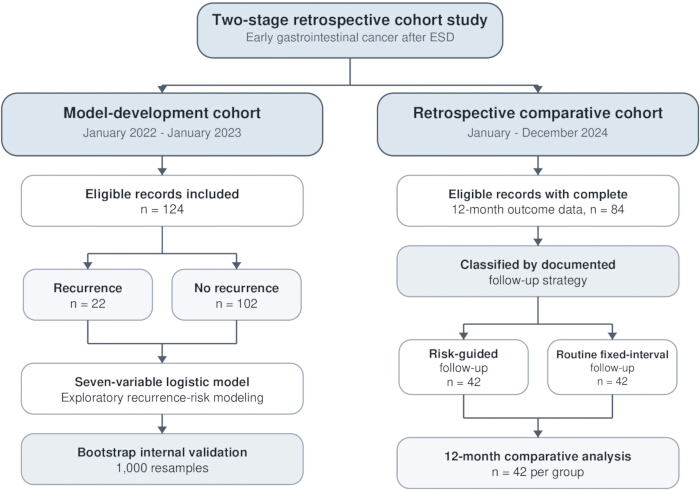
Figure 1: Included patients and analytic structure of the retrospective model-development cohort and the retrospective comparative cohort. Patients in the 2024 cohort were classified according to the follow-up strategy documented in their medical and nursing records; no random allocation was performed. Please click here to view a larger version of this figure.
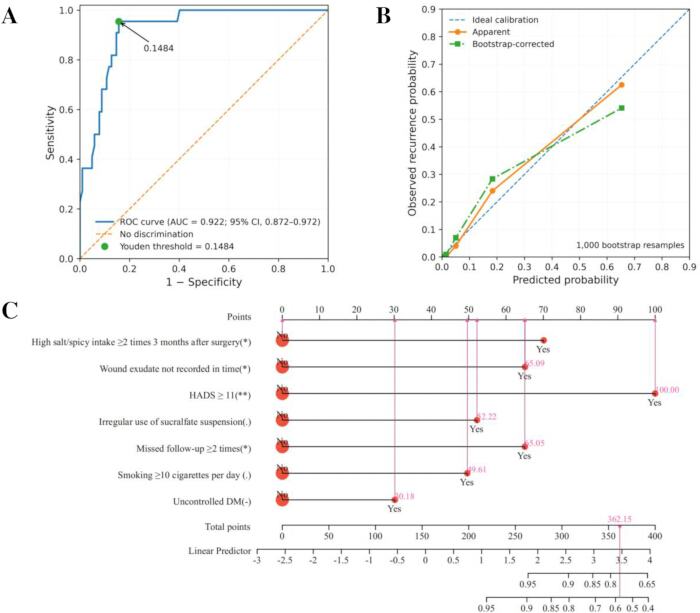
Figure 2: Apparent performance and internal validation of the seven-variable exploratory recurrence-risk model. (A) Receiver operating characteristic curve; the apparent AUC was 0.922 (95% CI, 0.872-0.972), and the Youden threshold of 0.1484, explicitly marked on the curve, yielded a sensitivity of 95.45% and specificity of 84.31%. (B) Apparent and bootstrap-corrected calibration curves based on quintiles of predicted risk; the two curves are separately identified in the plot, and the 45-degree line indicates perfect calibration. The bootstrap-corrected curve was obtained using 1,000 bootstrap resamples with refitting of the full model. (C) Nomogram based on the seven binary nursing-relevant variables. Abbreviations: AUC = area under the curve. Please click here to view a larger version of this figure.

Figure 3: Trends of HADS scores (anxiety/depression dimensions) at different time points after surgery between the two groups. (A) Anxiety dimensions score, (B) Depression dimensions score, (C) total score. Data are presented as mean ± SD; error bars represent SD. vs routine follow-up group * = p < 0.05, vs 1 month after surgery; # = p < 0.05, vs 6 months after surgery; & = p < 0.05. Please click here to view a larger version of this figure.
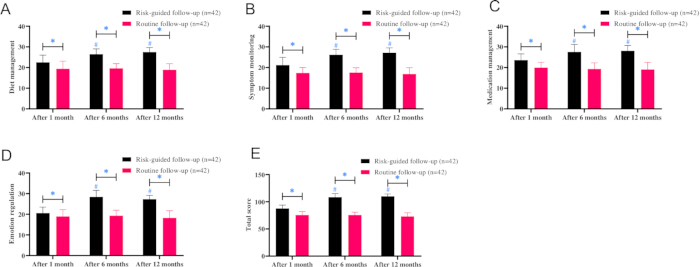
Figure 4: Trends of self-management ability scores in each dimension at different time points after surgery between the two groups. (A) Diet management score, (B) Symptom monitoring score, (C) Medication management score, (D) Emotion regulation score, (E) Total score. Data are presented as mean ± SD; error bars represent SD. vs routine follow-up group * = p < 0.05, vs 1 month after surgery; # = p < 0.05, vs 6 months after surgery; & = p < 0.05. Please click here to view a larger version of this figure.

Figure 5: Trends of nutritional status indicators at different time points after surgery between the two groups. (A) BMI, (B) Serum albumin (ALB), (C) Hb. Data are presented as mean ± SD; error bars represent SD. vs routine follow-up group * = p < 0.05, vs 1 month after surgery; # = p < 0.05, vs 6 months after surgery; & = p < 0.05. Please click here to view a larger version of this figure.
| Risk tier | Model probability | Follow-up schedule | Nursing measures | Provider and coordination | Documentation and fidelity |
| Low risk | <20% | One annual review; reinforcement every 3 months | Standardized booklet covering diet, lifestyle, and recurrence-warning symptoms; quarterly reinforcement messages | Routine gastroenterology nursing team | Recorded in routine follow-up records; no independent fidelity assessment |
| Intermediate risk | 20% to <40% | Semi-annual review, including one outpatient endoscopic reassessment; monthly telephone contact | Review of food diaries, individualized dietary planning, and reinforcement of medication adherence | Gastroenterology nursing team | Telephone and outpatient contacts recorded in nursing records; no prespecified fidelity threshold |
| High risk | ≥40% | Intensive scheduled support in addition to endoscopic surveillance | Eight weekly structured cognitive-behavioral support sessions; video-based wound-care instruction; daily warning-symptom logs with weekly feedback; monthly family sessions; coordinated diabetes management and glucose monitoring | Nursing team, family caregivers, and endocrinology service where diabetes was present | Components recorded in routine nursing records; provider credentials for the psychological component and a separate quantitative fidelity measure were not retained |
Table 1: Development, delivery, and content of the model-informed risk-guided follow-up pathway
| Indicator | Recurrent group | Non-recurrent group | Statistic | p value |
| Age, years | 61.23 ± 6.13 | 61.02 ± 4.99 | t = 0.170 | 0.866 |
| BMI, kg/m² | 23.83 ± 1.98 | 23.09 ± 2.74 | t = 1.207 | 0.23 |
| High-salt/spicy intake, yes/no | 15/7 | 31/71 | χ² = 11.075 | <0.001 |
| Incomplete wound records, yes/no | 14/8 | 28/74 | χ² = 10.579 | 0.001 |
| HADS score ≥11, yes/no | 17/5 | 25/77 | χ² = 22.493 | <0.001 |
| Irregular sucralfate use, yes/no | 15/7 | 35/67 | χ² = 8.626 | 0.003 |
| Missed follow-up ≥2 times, yes/no | 12/10 | 26/76 | χ² = 7.188 | 0.007 |
| Smoking ≥10 cigarettes/day, yes/no | 14/8 | 36/66 | χ² = 6.041 | 0.014 |
| Uncontrolled diabetes, yes/no | 12/10 | 32/70 | χ² = 4.245 | 0.039 |
| Lesion size ≥2 cm, yes/no | 13/9 | 40/62 | χ² = 2.921 | 0.087 |
| Poor differentiation, yes/no | 8/14 | 22/80 | χ² = 2.160 | 0.142 |
Table 2: Univariate associations between nursing-relevant indicators and 12-month recurrence after ESD
| Predictor | B | SE | Wald χ² | P value | OR | 95% CI |
| High-salt or spicy food intake | 1.312 | 0.669 | 3.842 | 0.05 | 3.715 | 1.000–13.797 |
| Incomplete wound-exudate documentation | 1.619 | 0.647 | 6.257 | 0.012 | 5.05 | 1.420–17.963 |
| HADS score ≥11 | 2.287 | 0.674 | 11.506 | 0.001 | 9.845 | 2.626–36.909 |
| Irregular sucralfate use | 0.934 | 0.644 | 2.104 | 0.147 | 2.543 | 0.720–8.979 |
| ≥2 missed follow-up appointments | 1.353 | 0.652 | 4.303 | 0.038 | 3.867 | 1.077–13.882 |
| Smoking ≥10 cigarettes/day | 1.108 | 0.652 | 2.887 | 0.089 | 3.028 | 0.844–10.870 |
| Uncontrolled diabetes | 0.636 | 0.649 | 0.961 | 0.327 | 1.889 | 0.530–6.734 |
| Intercept | −6.044 | 1.136 | 28.323 | <0.001 | 0.002 | — |
Table 3: Multivariable logistic regression model for 12-month recurrence after ESD
| Measure | Estimate |
| Recurrence events/total | 22/124 |
| Predictor parameters | 7 |
| Events per parameter | 3.1 |
| Apparent AUC | 0.922 |
| 95% CI | 0.872–0.972 |
| Probability threshold | 0.1484 |
| Sensitivity | 95.45% |
| Specificity | 84.31% |
| Youden index | 0.7977 |
| Hosmer–Lemeshow χ² | 4.358 |
| Hosmer–Lemeshow P value | 0.823 |
| Brier score | 0.088 |
| Bootstrap resamples | 1,000 |
| Estimated optimism | 0.038 |
| Optimism-corrected AUC | 0.884 |
Table 4: Apparent and bootstrap-corrected performance of the seven-variable exploratory recurrence-risk model
| Indicator | Risk-guided group | Routine group | Statistic | P value |
| Age, years | 60.38 ± 6.56 | 61.07 ± 6.09 | t = −0.500 | 0.618 |
| Sex, male/female | 25/17 | 23/19 | χ² = 0.194 | 0.659 |
| BMI, kg/m² | 23.94 ± 2.36 | 23.10 ± 2.49 | t = 1.591 | 0.115 |
| Pathological type, squamous/adenocarcinoma | 11/31 | 14/28 | χ² = 0.513 | 0.474 |
| Lesion size, cm | 1.78 ± 0.47 | 1.66 ± 0.60 | t = 1.053 | 0.295 |
| Differentiation, well/moderate/poor | 18/19/5 | 16/21/5 | χ² = 0.218 | 0.897 |
| Vascular invasion, yes/no | 7/35 | 8/34 | χ² = 0.081 | 0.776 |
| Diabetes, yes/no | 9/33 | 12/30 | χ² = 0.571 | 0.45 |
| Baseline HADS score | 8.45 ± 2.69 | 8.33 ± 2.14 | t = 0.225 | 0.823 |
Table 5: Baseline characteristics of the retrospective comparative cohort
| Outcome | Risk-guided group | Routine group | Effect estimate | p value |
| Overall recurrence | 5/42 (11.90%) | 13/42 (30.95%) | RD, −19.05 percentage points (95% CI, −35.55 to −1.37); RR, 0.38 (0.15–0.98); OR, 0.30 (0.10–0.94) | 0.033 |
| Local recurrence | 2/42 (4.76%) | 8/42 (19.05%) | OR, 0.21 (0.04–1.07) | 0.088 |
| Metachronous cancer | 3/42 (7.14%) | 5/42 (11.90%) | OR, 0.57 (0.13–2.55) | 0.713 |
Table 6: Twelve-month recurrence in the retrospective comparative cohort
| Indicator | Group-by-time χ² | FDR-adjusted p | 12-month OR | 95% CI |
| Dietary compliance | 2.387 | 0.328 | 5.55 | 1.82–16.94 |
| Wound-care execution | 3.158 | 0.328 | 7.22 | 1.90–27.40 |
| Medication adherence | 2.227 | 0.328 | 4.11 | 1.33–12.69 |
| Follow-up adherence | 3.347 | 0.328 | 14.55 | 1.78–118.76 |
Table 7: Nursing compliance during follow-up analyzed using generalized estimating equations
| Indicator | Risk-guided group | Routine group | Mean difference or test | 95% CI/P value |
| Annual examination cost, RMB | 6330.79 ± 1186.52 | 8269.29 ± 1569.26 | −1938.50 | −2533.51 to −1342.91 |
| Annual hospitalizations | 0.76 ± 0.79 | 1.69 ± 1.28 | −0.93 | −1.38 to −0.50 |
| Follow-up time, min | 27.05 ± 5.66 | 39.26 ± 5.96 | −12.21 | −14.67 to −9.83 |
| Satisfaction categories | 34/5/3/0 | 20/10/8/4 | Mann–Whitney U = 1197.0 | P = 0.001 |
| Overall satisfaction | 39/42 (92.86%) | 30/42 (71.43%) | Fisher’s exact test | P = 0.020 |
Table 8: Resource use and nursing satisfaction in the retrospective comparative cohort
Supplementary File 1: Raw patient-level data supporting the model-development and retrospective comparative cohort analyses.Please click here to download this file.
Discussion
This study examined whether nursing-relevant postoperative indicators could be incorporated into an exploratory recurrence-risk model and linked to a practical follow-up pathway. In the retrospective development cohort, the seven-variable model showed high apparent discrimination, although its limited event count, temporal overlap between several indicators and recurrence, and absence of external validation preclude firm conclusions regarding predictive transportability. A separate retrospective comparative cohort allowed the documented outcomes of patients who had received risk-guided or routine follow-up to be compared over 12 months; because the follow-up strategy was not randomly assigned, these comparisons represent observational associations rather than causal intervention effects.
Fixed-interval surveillance may not account for differences in postoperative behavior, emotional burden, adherence, or the quality of ongoing monitoring17. The present pathway aimed to link nursing-relevant indicators to follow-up intensity and predefined care actions. Dietary behavior, medication use, emotional distress, glycemic control, smoking, and appointment attendance represent potentially modifiable or monitorable domains, whereas wound-exudate documentation primarily reflects the care and monitoring process. This framework may assist in organizing postoperative nursing, but the current data do not establish that each indicator lies on a causal pathway to recurrence.
The observed 12-month recurrence proportion was 19.05 percentage points lower in the risk-guided group than in the routine-follow-up group. This difference is consistent with a potential benefit of more structured support, but the retrospective nonrandomized comparison cannot distinguish the contribution of the risk model from that of additional contact, supportive care, patient selection, residual confounding, or differential surveillance and detection18. The recurrence findings should therefore be regarded as hypothesis-generating rather than as definitive evidence of intervention effectiveness.
Psychological support, dietary and medication counseling, wound-related symptom recording, family involvement, and comorbidity management were combined within the risk-guided pathway19,20. The longitudinal HADS and self-management findings are consistent with the possibility that structured nursing contact supported emotional and behavioral management21; however, the pathway was multicomponent, and the present design cannot determine which component accounted for the observed differences. No stress biomarkers, immune measures, component-specific mediation analyses, or independent fidelity assessments were obtained, and mechanistic interpretations should therefore be avoided22. Available provider and implementation information indicated that mental-health credentials for the cognitive-behavioral component were not retained and that no formal Delphi or quantitative fidelity procedure was used.
Previous post-ESD recurrence models have generally been site-specific and have emphasized clinicopathological or mucosal factors. For example, Xu et al. developed a nomogram for recurrence after ESD in early gastric cancer using Helicobacter pylori infection and positive lymph nodes as independent predictors, reporting an AUC of 0.933, although no independent external validation was performed2. The FAMISH score, developed for metachronous gastric lesions after gastric ESD, incorporated age, sex, family history, corpus intestinal metaplasia, synchronous lesions, and persistent H. pylori infection; its initial 3-year AUC was 0.704, and subsequent external validation yielded a 5-year AUC of 0.708 with acceptable calibration, supporting its use for surveillance risk stratification9,23. Direct numerical comparison with the present AUC is inappropriate because these models differ in their target populations, predictors, outcome definitions, follow-up durations, calibration, and validation strategies. To our knowledge, no directly comparable post-ESD recurrence model has focused primarily on nursing-relevant behavioral and care-process indicators or linked estimated risk directly to a nursing follow-up pathway; the contribution of the present study therefore lies in this linkage rather than in demonstrating superior predictive performance.
The measured resource-use and satisfaction outcomes provide preliminary information regarding feasibility and acceptability24. Patients in the risk-guided group had lower recorded examination costs, fewer hospitalizations, shorter follow-up time, and a higher overall satisfaction rate than those receiving routine follow-up (Table 8). These findings do not constitute a formal economic evaluation because the analysis did not estimate quality-adjusted survival, incremental cost-effectiveness, or all relevant direct and indirect costs25. Moreover, the locally developed satisfaction scale requires further validation26.
This study has several limitations. First, both cohorts were retrospective and single-center, creating risks of selection bias, information bias, incomplete or misclassified documentation, and residual confounding. Second, only 22 recurrence events were available for seven predictor parameters, resulting in a low events-per-parameter ratio and possible coefficient instability and overfitting. Third, several nursing-relevant variables were measured during postoperative intervals that overlapped with the recurrence-observation period; temporal precedence could not be established for every patient, and the model should therefore not be interpreted as a baseline prognostic tool. Fourth, bootstrap resampling provided only internal validation, and no independent temporal, geographical, or multicenter external validation was performed before the score was incorporated into routine follow-up. Fifth, the 2024 comparison was nonrandomized, and additional contact, patient selection, unmeasured confounding, and differential surveillance or detection may have contributed to the observed group differences. Sixth, exact recurrence dates and individual risk-tier assignments were unavailable in the 2024 analysis dataset, precluding time-to-event and tier-specific analyses. Seventh, esophageal, gastric, and colorectal lesions were pooled despite differences in recurrence mechanisms and surveillance requirements, while anatomical site was not retained in the analysis dataset for stratified analysis. Eighth, the pathway was multicomponent, and the archived records did not retain complete provider training, manualization, or independent fidelity data, so the relative contributions and reproducibility of individual elements remain uncertain. Finally, follow-up was limited to 12 months, and the study-specific self-management and satisfaction measures require further external psychometric validation. Independent external model validation and an adequately powered prospective multicenter evaluation of the care pathway are required before routine implementation.
In conclusion, an exploratory seven-variable logistic model based on nursing-relevant postoperative indicators showed high apparent discrimination but was developed from a small single-center cohort, involved temporal overlap between several indicators and recurrence, and was not externally validated. In a separate retrospective comparative cohort study, receipt of model-informed, risk-guided follow-up was associated with lower observed 12-month recurrence and more favorable psychological, self-management, nutritional, satisfaction, and resource-use outcomes than routine follow-up. These observational findings do not establish predictive transportability or a causal effect of the intervention. Date-verified model redevelopment, independent external validation, and an adequately powered prospective multicenter evaluation are required before routine clinical implementation.
Disclosures
The authors have no conflicts of interest to declare.
Materials
| Name | Company | Catalog Number | Comments |
|---|---|---|---|
| Automatic biochemical analyzer | Mindray Bio-Medical Electronics Co., Ltd., Shenzhen, China | BS-240 Pro | Measurement of serum albumin and hemoglobin |
| CO2 insufflator | Micro-Tech (Nanjing) Co., Ltd., Nanjing, China | CO2-300 | Used to reduce postoperative discomfort during endoscopy |
| Electronic endoscope system | Olympus (China) Co., Ltd., Beijing, China | EVIS X1 (CV-1500) | Used for diagnostic endoscopy and postoperative surveillance after ESD |
| Electronic medical record system (EMR) | Winning Health Technology Group Co., Ltd., Nanjing, China | HIS-V8.0 | Extraction of clinical and nursing data |
| Electronic weighing scale | Xiaomi Communications Co., Ltd., Beijing, China | XMTZC05HM | Measurement of body weight for BMI calculation |
| Endoscopic clipping device | Micro-Tech (Nanjing) Co., Ltd., Nanjing, China | HX-610-135 | Hemostasis and wound closure after ESD |
| Endoscopic submucosal dissection knife | Micro-Tech (Nanjing) Co., Ltd., Nanjing, China | KD-650Q | Standard ESD knife for lesion resection |
| Gastrointestinal Disease Self-Management Scale | Chinese version | N/A | Assessment of self-management ability |
| High-frequency electrosurgical generator | Shanghai Hutong Electric Co., Ltd., Shanghai, China | GD-350-B | Provides cutting and coagulation during ESD |
| Hospital Anxiety and Depression Scale (HADS) | Chinese validated version | N/A | Psychological assessment of anxiety and depression |
| Proton pump inhibitor (PPI) | Jiangsu Hengrui Medicine Co., Ltd., Lianyungang, China | H20051628 | Acid suppression after ESD |
| R statistical software | R Core Team | R 4.3.1 | Bootstrap internal validation and statistical analysis |
| Statistical analysis software | IBM SPSS | SPSS 26.0 | Statistical analysis of study data |
| Sucralfate oral suspension | CSPC Pharmaceutical Group Ltd., Shijiazhuang, China | H13023653 | Post-ESD mucosal protection and ulcer healing |
References
- Cao W, et al. Changing profiles of cancer burden worldwide and in China: a secondary analysis of the global cancer statistics 2020. Chin Med J (Engl). 2021;134(7):783-91.
- Xu H, Yang X, Lu Y, Wang S. Prediction of recurrence of early gastric carcinoma after endoscopic submucosal dissection. Afr Health Sci. 2023;23(2):283-9.
- Draganov PV, et al. Endoscopic submucosal dissection in North America: a large prospective multicenter study. Gastroenterology. 2021;160(7):2317-27.e2.
- Rodriguez-Carrasco M, et al. Local recurrence after endoscopic submucosal dissection of gastric neoplastic lesions: special attention should be given also to safety margins. Scand J Gastroenterol. 2024;59(9):1105-11.
- de Moura EGH, Monte Junior ES. Endoscopic submucosal dissection and endoscopic mucosal resection: progress, techniques, and new directions. Arq Gastroenterol. 2021;58(2):129-30.
- Minamide T, et al. Local recurrence risk of esophageal squamous cell carcinoma due to intralesional damage during endoscopic submucosal dissection. J Gastroenterol Hepatol. 2023;38(10):1802-7.
- Nakajo K, et al. Salvage endoscopic resection for cT1N0M0 local recurrence after chemoradiotherapy for esophageal squamous cell carcinoma: endoscopic submucosal dissection versus endoscopic mucosal resection. Jpn J Clin Oncol. 2022;52(9):982-91.
- Li S, et al. Risk factors and a nomogram for predicting local recurrence in adult patients with early gastric cancer after endoscopic submucosal dissection. Dig Liver Dis. 2024;56(11):1921-9.
- Rei A, et al. Metachronous lesions after gastric endoscopic submucosal dissection: first assessment of the FAMISH prediction score. Endoscopy. 2023;55(10):909-17.
- Haasnoot KJC, et al. Low risk of local recurrence after a successful en bloc endoscopic submucosal dissection for noninvasive colorectal lesions with positive horizontal resection margins (R-ESD study). Endoscopy. 2023;55(3):245-51.
- Riley RD, Collins GS. Stability of clinical prediction models developed using statistical or machine learning methods. Biom J. 2023;65(8):e2200302.
- Riley RD, et al. Minimum sample size for developing a multivariable prediction model: PART II - binary and time-to-event outcomes. Stat Med. 2019;38(7):1276-96.
- Li Q, et al. The Chinese version of hospital anxiety and depression scale: psychometric properties in Chinese cancer patients and their family caregivers. Eur J Oncol Nurs. 2016;25:16-23.
- Steyerberg EW, et al. Internal validation of predictive models: efficiency of some procedures for logistic regression analysis. J Clin Epidemiol. 2001;54(8):774-81.
- Pimentel-Nunes P, et al. Endoscopic submucosal dissection for superficial gastrointestinal lesions: European Society of Gastrointestinal Endoscopy (ESGE) Guideline - Update 2022. Endoscopy. 2022;54(6):591-622.
- Japanese Gastric Cancer Association. Japanese Gastric Cancer Treatment Guidelines 2021 (6th edition). Gastric Cancer. 2023;26(1):1-25.
- Gu LS, Lee LY, Huang HY. Post-cancer treatment-related symptom distress and fear of cancer recurrence in colorectal cancer survivors. Hu Li Za Zhi. 2024;71(3):52-63.
- Dahmardeh H, Rezvaniamin M, Salar A. The effectiveness of acceptance and commitment therapy on fear of cancer recurrence in patients with gastrointestinal cancer with a stoma: a randomized controlled trial. Asian Pac J Cancer Prev. 2025;26(12):4569-73.
- Li Q, Liu J, Li L, Luo Y. Effect of prehabilitation on postoperative outcomes in patients with upper gastrointestinal tract cancer: meta-analysis. BJS Open. 2025;9(5):zraf091.
- Yang Y, et al. Deep learning-enabled multiphoton microscopy predicts colorectal cancer recurrence from routine FFPE specimens. NPJ Digit Med. 2025;8(1):689.
- Chou YJ, et al. Serial multiple mediation model of fear of cancer recurrence in patients with colorectal cancer. Health Psychol. 2025;44(10):955-62.
- Li Q, et al. Application effect of preoperative chemoradiotherapy combined with rehabilitation nursing in patients with rectal cancer surgery. Biotechnol Genet Eng Rev. 2024;40(3):2628-42.
- Niu Z, et al. External validation of the FAMISH predicting score for early gastric cancer with endoscopic submucosal dissection. Eur J Gastroenterol Hepatol. 2024;36(1):26-32.
- Lagergren P, et al. Severe reflux and symptoms of anxiety and depression after esophageal cancer surgery. Cancer Nurs. 2022;45(4):280-6.
- Alinia S, et al. Exploring the impact of stage and tumor site on colorectal cancer survival: Bayesian survival modeling. Sci Rep. 2024;14(1):4270.
- Matallana C, et al. Organ/space surgical site infection and long-term outcomes of rectal cancer surgery: retrospective population-based cohort study. BJS Open. 2025;9(3):zraf052.